Author: Luis Ribera

  • Trade Implications of Russia’s Invasion of Ukraine

    Trade Implications of Russia’s Invasion of Ukraine

    The Russian invasion of Ukraine has impacted financial and energy markets, as well as agricultural markets, increasing price volatility for major commodities.  Russia and Ukraine are not major markets for US agricultural exports, ranking 56th and 80th, respectively.  Before 2014, when Russia invaded Crimea, US exports of agricultural products ranged between $1.2 to $1.7 billion annually.  Afterwards, US agricultural exports to Russia have been around $250 million annually, with animal products (e.g., beef, poultry) taking the largest hit (USDA, 2022).  Moreover, neither Russia nor Ukraine are major exporters of agricultural products to the US; the US ranks 55th and 53rd, respectively.  That said, both Russia and Ukraine are major players in the international wheat and corn markets.  In 2020, Russia was the largest wheat exporter reaching almost $8 billion, while Ukraine was fifth with almost $3.6 billion in wheat exports.  Moreover, Ukraine is the fourth largest corn exporter reaching almost $5 billion, while Russia is the 11th with $400 million in 2020 (UN Comtrade, 2022).  Since Russia and Ukraine’s marketing year ends at the end of May, the impacts of the Russian invasion on their wheat and corn exports this marketing year could be minimal. On the other hand, it is unknown the extent of infrastructure damage for hauling and shipping, or the impact of shipping restrictions in the Black Sea that could slow down or increase the cost of trade.  Finally, Russia accounts for 14 percent of the world’s nitrogenous fertilizer exports and is the leading supplier of urea to the US. Additionally, Russia and Belarus accounts for about 20 percent of US potash imports (USDA, 2022). The sanctions again Russia and Belarus (for supporting the Russian invasion) could hurt US agricultural producers as they are already experiencing record high fertilizer prices.

    UN Comtrade (2022). https://comtrade.un.org/
    U.S. Department of Agriculture (USDA) (2022). Global Agricultural Trade System. Foreign Agricultural Service. https://apps.fas.usda.gov/gats/default.aspx
     

    Figure 1. Top Wheat Exporting Countries: 2020

    Source: United Nations Comtrade Database, 2022

    Figure 2. Top Corn Exporting Countries: 2020

    Source: United Nations Comtrade Database, 2022

    Ribera, Luis, and Andrew Muhammad. “Trade Implications of Russia’s Invasion of Ukraine.” Southern Ag Today 2(11.4). March 10, 2022. Permalink

  • U.S. Exports to China: Better than Last Year’s, But Still Below Phase I Agreement Levels for 2021

    U.S. Exports to China: Better than Last Year’s, But Still Below Phase I Agreement Levels for 2021

    US exports to China in 2021 reached almost $33 billion, a 24.6 percent increase from last year.  As a matter of fact, China has been the largest market for US commodities in the last couple of years surpassing Canada and Mexico.  Moreover, in 2021 China was the number one destination for soybeans, corn, sorghum, cotton, and nuts, accounting for 69 percent of all US commodities exported to China. Although year over year US exports to China have been higher, they still fell short of the agreed amount for 2021 under the Phase 1 agreement.  The chart above shows the monthly cumulative amount of US exports to China for 2012, 2020, 2021, and Phase I 2020 and 2021.  US exports to China in 2012 were the largest amount exported ever before the Phase 1 agreement, around $26 billion, while Phase 1 2020 and 2021 amounts were agreed at $32 and $39 billion, respectively.  The red line represents 2020 exports and the yellow line 2021 exports and both years US exports fell short of reaching 83 and 85 percent of the agreed amount under the Phase 1 agreement (blue and black lines). Although 2020 and 2021 exports fell below the agreed amount, both years marked the largest amount of US exports to China.  Hopefully, this trend continues for 2022 and beyond.

    Monthly Cumulative Amount of US Exports to China for 2012, 2020, 2021, and Phase I 2020 and 2021.  

    Source: GATS, FAS/USDA

    Ribera, Luis. “U.S. Exports to China: Better than Last Year’s, But Still Below Phase I Agreement Levels for 2021“. Southern Ag Today 2(7.4). February 10, 2022. Permalink

  • Importance of Southeastern Ports for US Agricultural Exports

    Importance of Southeastern Ports for US Agricultural Exports

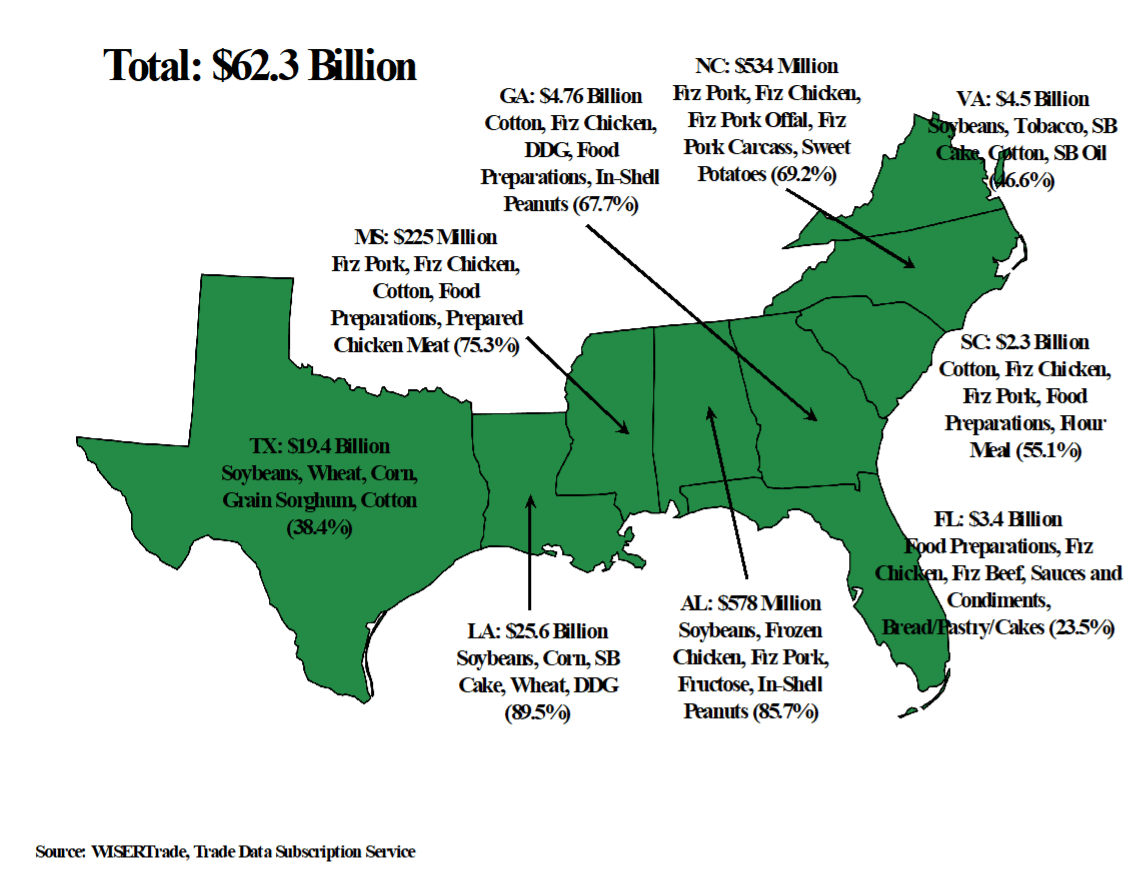
    The US is the largest agricultural exporter in the world reaching almost $150 billion in 2020 and the Southeastern ports are very important to get those commodities overseas.  In 2020, a total of $62.3 billion were exported through the ports in Alabama, Florida, Georgia, Louisiana, Mississippi, North Carolina, South Carolina, Texas, and Virginia.  Louisiana led the way with $25.6 billion in agricultural exports and its top five commodities exported were soybeans, corn, soybean cake, wheat, and DDG.  Exports from Florida and Texas ports seem to be the most diverse as their top five commodities exported accounted for 23.5 and 38.4 percent, respectively.  On the other hand, exports through Louisiana and Alabama ports seem to be more concentrated as their top five commodities accounted for 89.5 and 85.7 percent total ag exports, respectively.  The most common crops exported by these ports were cotton and soybeans, while the most common meats were frozen chicken and frozen pork.

    importance of southeastern ports for US ag exports

    Ribera, Luis. “Importance of Southeastern Ports for US Agricultural Exports.” Southern Ag Today 1(42.4). October 14, 2021. Permalink