Author: Ryan Loy

  • Sifting through the Rice Market: Rising Supplies and Growing Competition

    Sifting through the Rice Market: Rising Supplies and Growing Competition

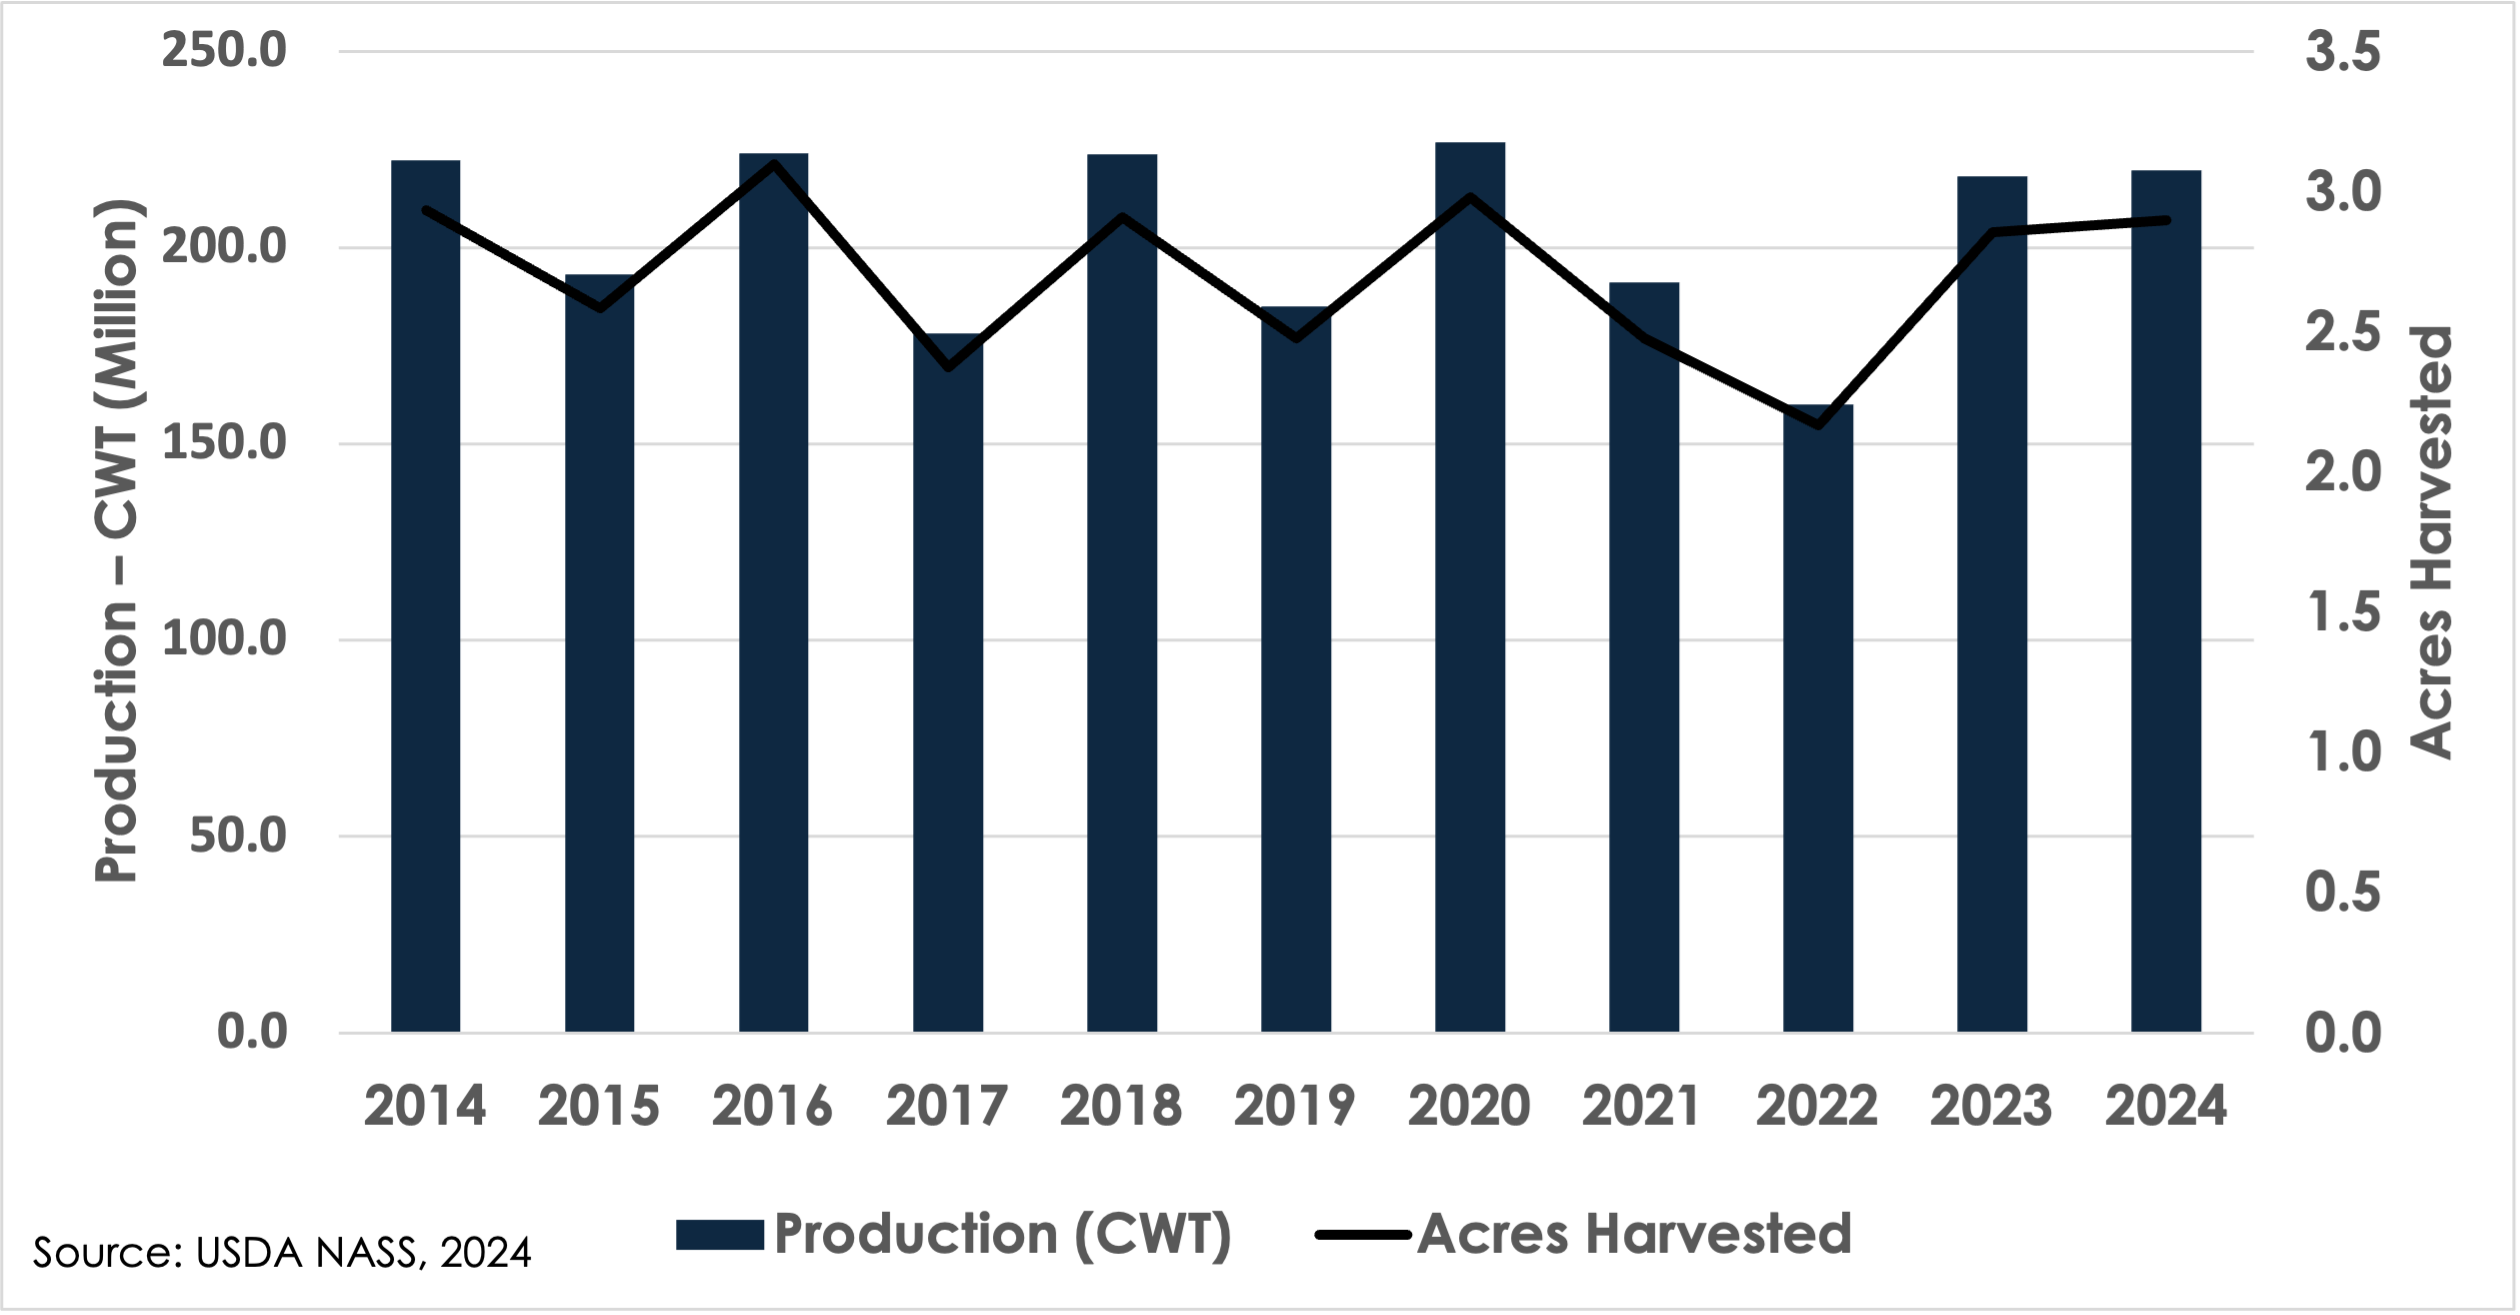
    With several key moves during the 2024 rice market, and harvest behind us, we can let the dust settle and make some observations and conclusions as we look toward 2025. A major shift in domestic production patterns emerged in 2022; volatile input costs, triggered by the Russian-Ukraine War and supply chain disruptions, led to a decline in rice acreage as southern U.S. farmers opted to grow less input-intensive crops like soybeans and corn. These challenges were exacerbated by a severe drought in California that substantially reduced short/medium grain rice production. Rice production rebounded in 2023 and maintained that level in 2024, when more stable fertilizer prices shifted producers back to rice to counter the risk of lower prices, as was the case in other commodities (Figure 1). Recent conversations with agronomists indicate that U.S. rice farmers may maintain or expand rice acreage and production in 2025.

    Figure 1. U.S. All Rice Class Production and Acres Harvested (2014 – 2024)
    The November 2024 World Agricultural Supply and Demand Estimates (WASDE) report indicates the current outlook for U.S. rice is for larger ending stocks, weaker exports and unchanged supplies and domestic use from October 2024 (USDA-AMS, 2024). All rice exports combined are lowered 1 million cwt to a total of 100 million. All rice ending stocks are increased 1 million cwt to 46.7 million, a 19% increase from the 2023/24 marketing year. The seasonal average farm price for long grain and southern short/medium grain is unchanged at $14.50/cwt, suggesting a cautious domestic response to the stock increases (Figure 2).

    Figure 2. Rice Marketing Year Average Farm Prices (2020/21 – 2024/24F)

    Internationally, it’s important to note the spread between India’s rice, Thailand/Vietnam rice, and U.S. milled rice. U.S. long grain is and has remained for several months at $800/metric ton, while Vietnam and Thailand are currently selling at $550 and $500/metric ton, respectively. The price gap widened following the September 2024 lift of India’s export ban on non-basmati milled rice. Currently, India has set the price floor at $490/metric ton. India’s return to the international market has forced Thailand and Vietnam to lower their prices by 10-13%, impacting demand for U.S. long grain rice in countries like Iraq. Iraq’s preference for cheaper rice from Asia, influenced by the price differential, has reduced demand for U.S. rice exports and poses a challenge for U.S. farmers (Childs and Jarrell, 2024). 

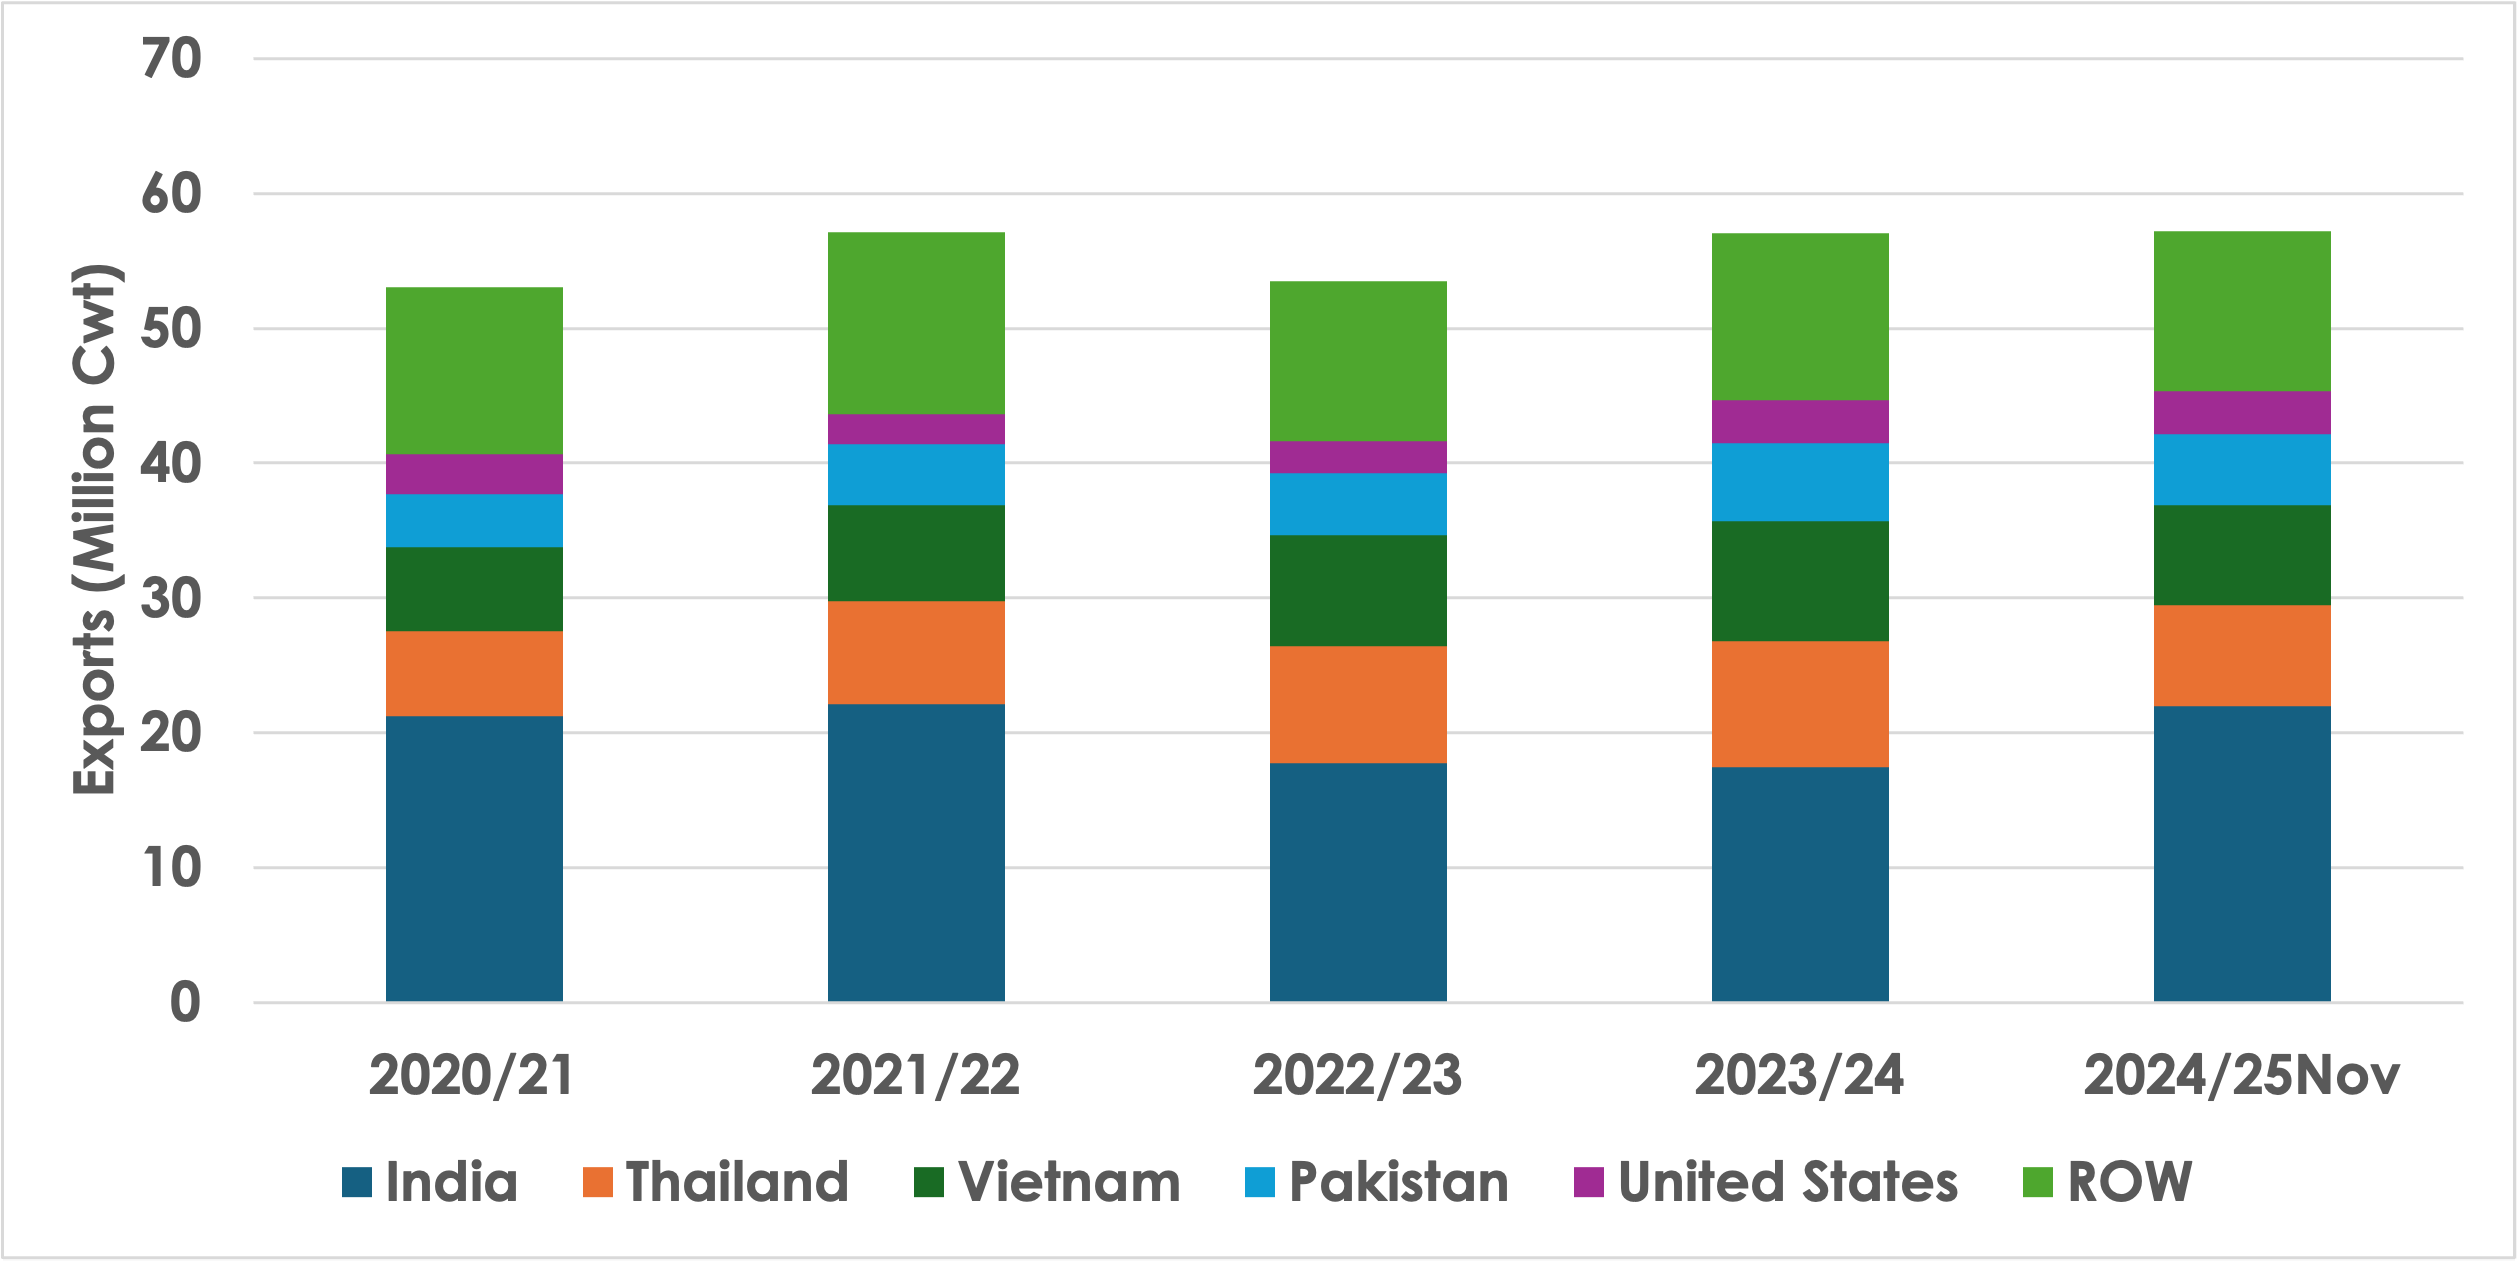
    Looking ahead, global rice exports for 2025 are expected to increase by 4% YoY, bringing total exports to 56.3 million metric tons. India is projected to reclaim much of their share, reaching a volume of 21 million tons. However, countries like Pakistan, Thailand, Vietnam, and the United States are expected to see a decline in export volumes (Figure 3). 

    Figure 3. Milled Rice Exports (2020/21 – 2024/25Nov)
    Source: USDA-FAS, 2024

    References

    United States Department of Agriculture, Agricultural Marketing Service. (2024). World Agricultural Supply and Demand Estimates (WASDE-654). Retrieved November 9, 2024, from, https://www.usda.gov/oce/commodity/wasde/wasde1124.pdf

    United States Department of Agriculture, Foreign Agricultural Service – PSD Reports. (2024). World Rice Trade. Retrieved November 9, 2024, from, https://apps.fas.usda.gov/psdonline/app/index.html#/app/downloads

    United States Department of Agriculture, National Agricultural Statistics Service. (2024). Rice Production and Acres Harvested. Retrieved October 2024, from, https://quickstats.nass.usda.gov/

    Loy, R., and Hunter, B. (2024). The Disparity Between Crop Prices Received and Input Prices Paid.” Southern Ag Today 4(28.3). July 10, 2024. Available at, https://southernagtoday.org/2024/07/10/the-disparity-between-crop-prices-received-and-input-prices-paid/

    Childs, N., & Jarrell, P. (2024). Rice outlook: October 2024 (Report No. RCS-24I). U.S. Department of Agriculture, Economic Research Service. Retrieved November 2024, from, https://www.ers.usda.gov/webdocs/outlooks/110219/rcs-24i.pdf?v=5219.8


    Loy, Ryan. “Sifting through the Rice Market: Rising Supplies and Growing Competition.Southern Ag Today 4(48.3). November 27, 2024. Permalink

  • The Disparity Between Crop Prices Received and Input Prices Paid

    The Disparity Between Crop Prices Received and Input Prices Paid

    The United States Department of Agriculture National Agricultural Statistics Service (USDA-NASS) releases monthly indexes for input prices paid and output prices received. These indexes include collecting survey responses for output and input prices for agricultural production, crops, livestock, and food commodities. The spread between these two indices often helps understand where farmers are getting price squeezed and how their profit margins are impacted. Current farm income instability from inflationary pressures, high interest rates, and several supply chain disruptions (e.g., the Russian-Ukraine war and Panama/Suez Canal) are forcing farmers to pay higher input costs while receiving lower commodity prices, emphasizing the need to consider these indexes into the future. 

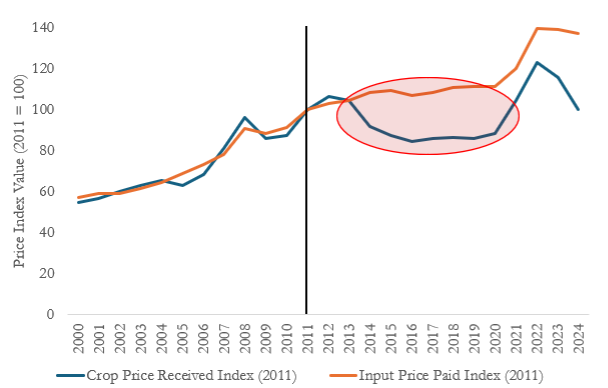
    These price indices measure the change in prices paid (and received) relative to a point in time—2011 in this case (Figure 1). The base year is often chosen during a time without prevailing inflation or major supply chain disruptions (Schulz, 2022). 2011 was a good year for agricultural production and profitability. As such, using 2011 as a base year is a way to highlight how better or worse-off agricultural producers are compared to a good year. 

    Figure 1. Crop Output Prices Received vs. Input Prices Paid

    Figure 1 compares the annual index value from 2000-2024 for the two indices with 2011 as the base year. The price received index in 2012 was 102.8%, meaning that the crop price received, on average, in 2012 was 2.8% higher than in 2011 (base year = 100%). The red circle in Figure 1 shows the beginning of a divergence between input and output prices. In 2013, when writing the 2014 farm bill, the index for input prices paid was almost exactly the index for output prices received. This is where most of our current farmer safety net support stems from, and since then, we’ve seen a major divergence in the two indices, with the widest gaps between 2014 – 2020 (USDA-NASS). From 2021 – 2022, we saw both indices increase, but the gap remained, and the divergence has grown wider in 2023 and 2024 due to declining commodity prices. 

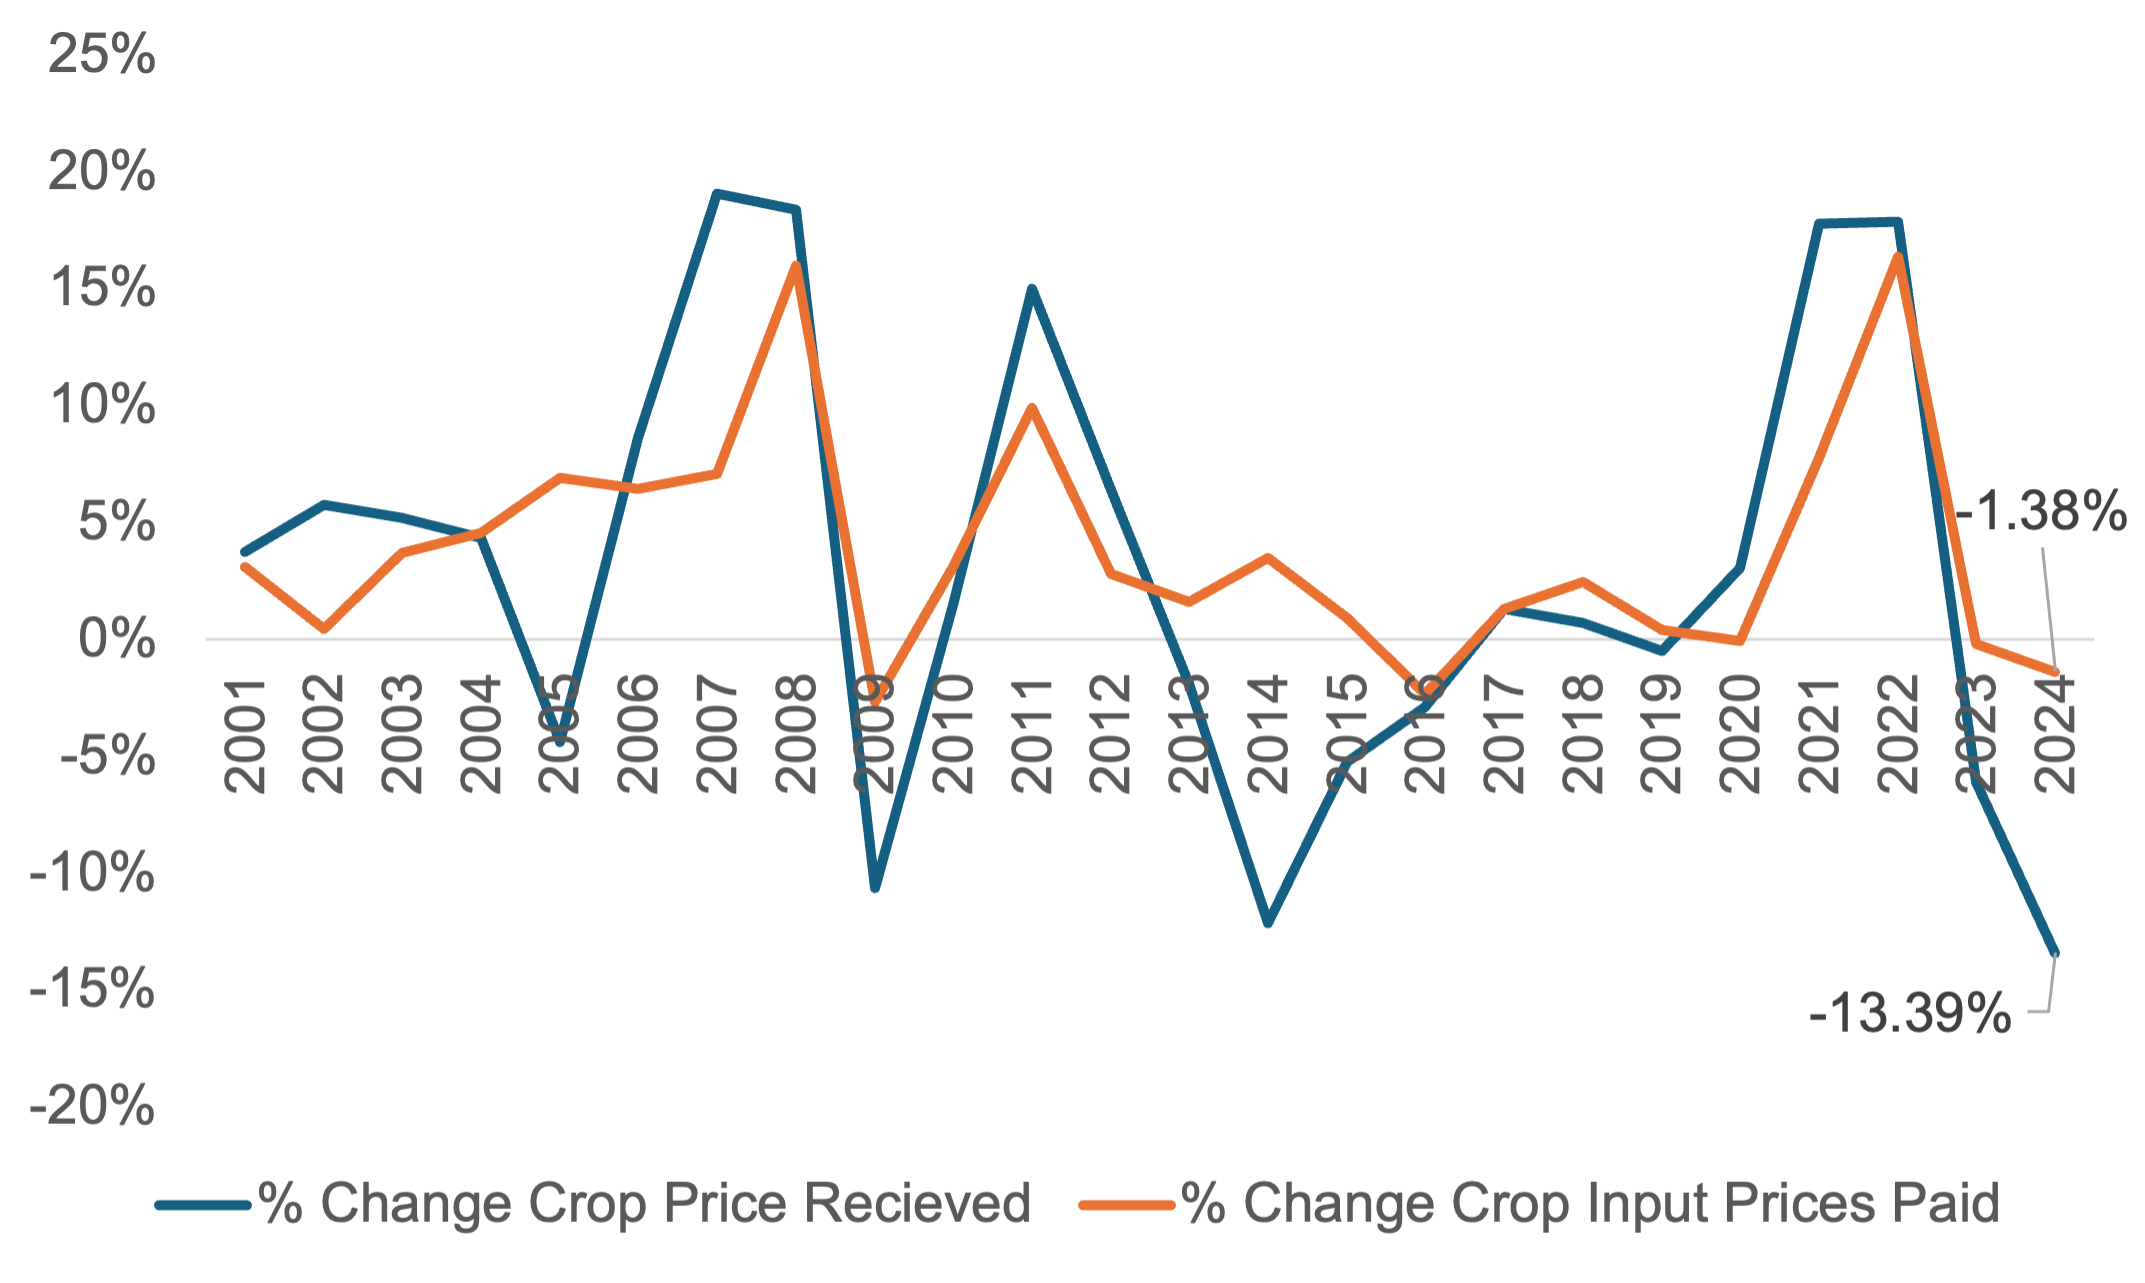
    Another way to view the indices is to calculate how they change year to year. Figure 2 plots the same indices as Figure 1 but shows the yearly change between the index values. Using this percentage change helps producers understand 1) the volatility of crop output prices and 2) the magnitude of change as compared to the previous year. A key takeaway is that input prices are less volatile (in terms of yearly % change) than output prices. Secondly, the percentage change in crop output prices between 2023 and 2024 (-13.8%) is much larger than the percentage decrease in input prices (-1.38%) during that period.

    Without any relief in the form of improved crop prices received, figure 1 suggests farmers will continue to suffer from cost/price squeezes and eroding profit margins. Further, figure 2 shows the magnitude of that spread between the indices in Figure 1; if input and output prices continue this trajectory, an improved farm safety net will be warranted. This will be at the forefront of every producer’s mind, with ongoing Farm Bill debates in 2024.  

    Figure 2. Year-over-Year % Change in Input and Output Crop Prices


    References

    Schulz, L. (2022). Disentangling Input and Output Price Relationships. Retrieved from: https://www.extension.iastate.edu/agdm/articles/schulz/SchSep22b.html

    The Observatory of Economic Complexity (OEC). (2024). Fertilizers in Russia. Retrieved from: https://oec.world/en/profile/bilateral-product/fertilizers/reporter/rus

    USDA-Economic Research Service (2024). Farm Sector Income & Finances: Highlights from the Farm Income Forecast. Retrieved from: https://www.ers.usda.gov/topics/farm-economy/farm-sector-income-finances/highlights-from-the-farm-income-forecast/

    USDA- Economic, Statistics, and Market Information System. (2024). Agricultural Prices. Retrieved from: https://usda.library.cornell.edu/concern/publications/c821gj76b?locale=en


    Loy, Ryan, and Hunter Biram. “The Disparity Between Crop Prices Received and Input Prices Paid.Southern Ag Today 4(28.3). July 10, 2024. Permalink

  • Tax Reporting for Crop Insurance

    Tax Reporting for Crop Insurance

    With tax season in full swing, knowing how to properly report crop insurance premiums and indemnities is important to ensure accurate tax reporting. Many producers have CPAs or accounting firms that manage their finances and taxes. However, understanding how to report crop insurance proceeds is a great on-farm skill when maintaining accurate financial records.

    The Schedule F, “Profit and Loss from Farming,” is an Internal Revenue Service (IRS) form that allows producers to report net profit (or losses) from their agricultural production (IRS, 2022). The Schedule F shows income and expenses pertaining to principal farming activities, such as grain and livestock sold, any income from cooperatives, program payments, and federal crop insurance distributions. Crop insurance proceeds (or indemnities) must be included on a Schedule F as farm income regardless of how much proceeds a producer receives to cover the producer premium. Importantly, crop insurance proceeds can be reported in several ways depending on when you sell your grain. 

    1. Reporting crop insurance indemnities – not deferred

    Assume a producer received $50,000 in crop insurance indemnities this year and would receive a 1099-MISC form from the crop insurance company confirming that indemnity amount. The producer’s normal business practice is to sell their crop in the same year as production (i.e., crops produced in 2023 are sold in 2023). Therefore, the producer must report the indemnity on the tax return for the year the crop was sold and produced. The $50,000 indemnity would be reported on lines 6a and 6b.  

    Figure 1. Reporting a $50,000 Crop Insurance Indemnity

    1. Reporting crop insurance indemnities – deferred

    Again, assume a producer received $50,000 in crop insurance indemnities this year. However, the producer normally reports income from crops in a following tax year under their normal business practices. Therefore, the producer can defer the crop insurance indemnities to next year. The $50,000 would again be reported on line 6a. But now, the producer checks the box on line 6c to defer the indemnity until next year (Figure 2). To defer, a producer must submit a statement containing 1) producer’s name and address, 2) declaration that the producer is making the deferral, 3) identifying crop and damage information, 4) declaration that crop income is normally included in the following year, and 5) name of the insurance carrier. For more information on how to compile this statement, please consult a tax professional.

    Now, let’s assume the producer deferred a $30,000 indemnity in 2022 and must report it on their 2023 taxes (Figure 3). The producer would follow Figure 2 and then report the $30,000 on line 6d. 

    Figure 2. Deferring a $50,000 Crop Insurance Indemnity

    Figure 3. Reporting a Deferred Crop Insurance Indemnity from 2022

    1. Reporting crop insurance premiums

    Lastly, the premium paid is reported as expense on the Schedule F. The full amount of premium paid must be reported regardless of how much indemnities cover the premium cost. In this case, premiums reduce Schedule F profit and lessens the tax burden on their farming enterprise. Assume a producer paid a total of $40,000 in premiums for 2023, they would report this amount on Schedule F, Part II, line 20, effectively reducing taxable Schedule F profit by $40,000. 

    Figure 4. Reporting a $40,000 Crop Insurance Premium

    It’s worth noting that we are not tax accountants, and every farm’s situation is unique. Therefore, you should always consult with a tax professional when preparing your farm’s taxes. 

    References

    Internal Revenue Service. (2023, July 13). About Schedule F (Form 1040), Profit or Loss From Farming. Retrieved September 25, 2023, from https://www.irs.gov/forms-pubs/about-schedule-f-form-1040.

    Loy, R. and Biram, H.D. (2023). Cultivating Financial Security: A Guide on Farm Finances, Taxes, and Crop Insurance. University of Arkansas System Division of Agriculture, Cooperative Extension Service Fact Sheet No. FSA80.

    Tidgen, K.A. (2019). Special Rule for Taxing Crop Insurance and Disaster Payments. Iowa State University Center for Agricultural Law and Taxation. Retrieved September 25, 2023, from https://www.calt.iastate.edu/blogpost/special-rule-taxing-crop-insurance-and-disaster-payments.


    Loy, Ryan, and Hunter Biram. “Tax Reporting for Crop Insurance.Southern Ag Today 4(11.3). March 13, 2024. Permalink

  • A Quick Look at the 2024 Rice Market

    A Quick Look at the 2024 Rice Market

    Following two consecutive years of decline (see Figure 1), United States (U.S.) rice production increased to roughly 2.9 million acres in 2023 (USDA-ERS, 2024). In 2022 and 2023, the world was consuming more rice which showed up in the long grain rice Marketing Year Average Prices (MYAP) of $16.70/cwt and $15.7/cwt, respectively (USDA-NASS, 2024).  Production increases in 2023 (see Figure 1) followed 2022 high prices that were last seen around harvest of 2013. Fast forward to March 2024, where the current November rough rice futures contract is trading at $14.66/cwt. The November contract price decline has been steady since late December 2023 but has recently begun to increase again ($0.44/cwt since February 27, 2024). 

    Figure 1. U.S. Rice Production, Exports, and Stocks. Source: USDA-FAS, 2024

    There was an extreme multi-year drought in California during the 2022 growing season. During this time, California rice producers could not plant nearly 300,000 acres, due to a lack of water for irrigation (Smith, 2023). Arkansas (a state that almost exclusively grows long-grain varieties) responded by increasing its acreage of medium-grain rice by 55,000 acres in 2023 (USDA-NASS, 2023). However, California rebounded in 2023 and surpassed 500,000 acres of medium-grain rice (Farm Progress, 2024). An abundance of medium-grain rice could hinder any upside price potential if the demand for medium-grain remains at normal levels.

    An Eastern Pacific El Nino has also disrupted off-season rice production for Thailand, Burma, and Indonesia. These countries rely on off-season production to improve their stocks and export amounts. Now, they face extreme drought, impacting yields and production, and may not have enough carry-over and ending stocks to bring rice to the global economy (Reuters, 2023). The USDA forecasts that global rice production for 2023/24 will exceed 2022/23 by only 0.1% (583,000 metric tons). Thus, the El Nino conditions are poised to further tighten global rice supplies in these major exporting countries. 

    Global rice supplies are also strained from India’s July 2023 export ban on non-basmati rice (Glauber and Mamun, 2024). The ban was implemented to help lower domestic rice prices and to ensure rice availability in India. On a global scale, India accounted for nearly 40% of all rice exports in 2022, further showing the global impact of India’s exports (USDA-FAS, 2023). Referring to Figure 2, the ban forced a 93% decline in non-basmati rice exports between August and November of 2023 (Glauber and Mamum, 2024). Importing countries are now forced to turn to alternative suppliers to meet their rice demands. It’s worth noting that India is currently in an election year and it’s doubtful the ban would be lifted before a general election in April or May. If the ban is lifted post-election, watch for Indian rice to flood the market, and put further downward pressure on global rice prices. 

    Figure 2. India Rice Exports. Source: International Food Policy Research Institute, 2024

    Overall, the 2024 rice market will be extremely sensitive to ongoing global conflicts, weather, government policies, and shipping issues such as low water levels in the Panama Canal, a potential return to low water levels in the Mississippi River, and conflicts in the Red Sea. There could continue to be opportunities in the export market should Mississippi River levels stabilize during harvest and if India’s export ban continues. With planting around the corner, it’s worth highlighting that on a per-bushel basis, the current soybean-to-rice price ratio for November 2024 delivery is 1.78 ($11.73/$6.60). This ratio has continued to decline since 2021, when the ratio was 2.41. All to say that the relative prices of other commodities, such as soybeans, are in a similar declining price environment as rice.  

    References

    Barchart.com. (2024, February). Rough Rice Nov ’24 (ZRX24). Retrieved February 29, 2024, from https://www.barchart.com/futures/quotes/ZRX24/profile.

    Fitchette, T. (2023). How will Rice and Soybeans Compete for Acreage in 2024? Farm Progress. Retrieved February 21, 2024, from https://www.farmprogress.com/rice/how-will-rice-and-soybeans-compete-for-acreage-in-2024-.

    Glauber, J. and Abdullah, M. (2024). India’s Export Restrictions on Rice Continue to Disrupt Global Markets, Supplies, and Prices. International Food Policy Research Institute. Retrieved February 25, 2024, from https://www.ifpri.org/blog/indias-export-restrictions-rice-continue-disrupt-global-markets-supplies-and-prices.

    Reuters (2023, November). Dry Soil to Curb Asia’s Early 2024 Rice output, Pressure Supply. Retrieved February 29, 2024, from https://www.reuters.com/markets/commodities/dry-soil-curb-asias-early-2024-rice-output-pressure-supply-2023-12-01/.

    Smith, A.D. (2023). California Rice is Back. Ag Data News. Retrieved February 28, 2024, from https://asmith.ucdavis.edu/news/california-rice-back.

    USDA-FAS. (2024, February). Grain: World Markets and Trade. Retrieved February 12, 2024, from https://apps.fas.usda.gov/psdonline/app/index.html#/app/downloads

    USDA-FAS. (2023, September). Rice Export Prices Highest in More Than a Decade as India Restricts Trade. Retrieved January 8, 2024, from https://fas.usda.gov/data/rice-export-prices-highest-more-decade-india-restricts-trade

    USDA-NASS (2023, March). Arkansas Prospective Plantings. Retrieved January 14, 2024, from https://www.nass.usda.gov/Statistics_by_State/Arkansas/Publications/Crop_Releases/Prospective_Plantings/2023/arplant23.pdf.

    USDA-ERS. (2024, January). Rice Outlook: January 2024. Retrieved January 26, 2024, from https://www.ers.usda.gov/webdocs/outlooks/108291/rcs-24a.pdf?v=5101.6.


    Loy, Ryan. “A Quick Look at the 2024 Rice Market.Southern Ag Today 4(11.1). March 11, 2024. Permalink

  • Using the Share Rent Equivalent Model to Determine Farmland Value

    Using the Share Rent Equivalent Model to Determine Farmland Value

    Every year, the Farm Service Agency (FSA) national office reviews the Soil Rental Rates used for the Conservation Reserve Program (CRP). The FSA has recently announced that county-average rental rates will be updated based on the 2023 National Agricultural Statistics Service (NASS) Cash Rent Survey results for dryland rent estimates. When considering the prevalent farm lease arrangements and production practices, NASS survey results may not provide accurate estimates. This results in a county-average rental rate that does not reflect typical rent paid in a county. For example, Figure 1 highlights the percentage change in proposed CRP rental rates in Arkansas between 2023 and 2024, where negative values represent counties facing lower CRP rental rates than in 2023. 

    Figure 1. Percentage Change in Stated CRP Rental Rates This figure provides the year-over-year percentage change in stated CRP rental rates in Arkansas between 2024 and 2023. (Source: USDA-FSA, 2023)

    Several acceptable models can be used to address rental discrepancies or determine an alternative rate. One such method approved by the FSA is the “Share Rent Equivalent Model.” The model intends to infer cash rents in situations (e.g., counties) where share leases predominate available data or where share leasing is the rule rather than the exception. Acceptable supporting data sources for the model include an average of the most recent three years of yield data, including NASS county yields. When NASS yields are unavailable, RMA T-yields can be substituted. 

    Arkansas counties are an example, though this model applies to any county in the southeast region of the United States. Given the prevalence of 20% and 25% share leases found in the southeast region and the limited amount of non-irrigated crop production, the model incorporates county-specific production practices and lease structures that more accurately reflect the soil value and environmental benefits of the CRP program. Table 1 utilizes the “Share Rent Equivalent Model” to determine an alternative cash rent for 20% and 25% share leases under a wheat/soybean double cropping system for Arkansas County, Arkansas.  

    Table 1. Share Rent Equivalent Model for Wheat/Soybean Production, Arkansas County

    CropWinter WheatNon-Irrigated SoybeansWinter WheatNon-Irrigated Soybeans
    Share Rent (%)25%25%20%20%
    RMA T-Yield (bu/ac) (2020-2022 avg.)63416341
    RMA 2023 Harvest Price$6.60$12.84$6.60$12.84
    Cash Rent Equivalent ($/acre)$103.95$131.61$83.16$105.29
    Total Cash Rent Equivalent ($/acre)$235.56$188.45
    Note: Share Rent (%) * RMA T-Yield * RMA 2023 Harvest Price = Cash Rent Equivalent. 
    Total Cash Rent Equivalent = Cash Rent Equivalent (Winter Wheat) + Cash Rent Equivalent (Soybeans).

    The results in Table 1 more closely resemble non-irrigated cash rents in the representative county, particularly in the current commodity market environment for grains. Figure 2 is a map of alternative CRP rental rates derived from the “Share Rent Equivalent Model” for 20% crop-share arrangements in predominate agricultural counties in Arkansas. Furthermore, the model’s accuracy is determined by calculating the percentage change between the 2023 effective CRP rental rate and the alternative 2024 CRP rates from the model. Figure 3 maps this percentage change for each county in Arkansas. According to Figure 3, our estimates are only marginally higher than what was stated in 2023. Therefore, we can conclude that the “Share Rent Equivalent Model” reflects existing CRP rental rates more accurately than the survey-based approach. Work with your local FSA office to determine if the Share Rent Equivalent model more accurately reflects cash rent in your county.  

    Figure 2. Share Rent Equivalent CRP Rental Rates at 20% Crop Share (2024) This figure provides the per acre share rent equivalent CRP rental rates under a 20% crop share. (Source: USDA-FSA, 2023)

    Figure 3. Percentage Difference in the Share Rent Equivalent at 20% and Stated CRP Rental Rate This figure shows the percentage difference in the 2024 share rent equivalent and the 2023 stated CRP rental rate. (Source: USDA-FSA, 2023)

    References

    USDA-FSA. (2024, January). 2023 ARC-County Benchmark Yields and Revenues as of January 5, 2024. Retrieved January 31, 2024, from https://www.fsa.usda.gov/programs-and-services/arcplc_program/arcplc-program-data/index.

    USDA-FSA. (2022, October). 2022 ARC-County Benchmark Yields and Revenues as of October 31, 2023. Retrieved December 20, 2023, from https://www.fsa.usda.gov/programs-and-services/arcplc_program/arcplc-program-data/index.

    USDA-FSA. (2023, December). Provisional County-Average Rental Rates to Determine CRP SRR’s for FY 2024. Retrieved January 30, 2024, from https://www.fsa.usda.gov/Internet/FSA_Notice/crp_1012.pdf.

    USDA-NASS. (2022, August). Arkansas Cash Rents County Estimates. Retrieved December 20, 2023, from https://www.nass.usda.gov/Statistics_by_State/Arkansas/Publications/County_Estimates/2021-2022/22_AR_cash.pdf.

    USDA-RMA. (2023). USDA-RMA Actuarial Data Master.


    Loy, Ryan, and Hunter Biram. “Using the Share Rent Equivalent Model to Determine Farmland Value.Southern Ag Today 4(9.3). February 28, 2024. Permalink