Category: Farm Management

  • Estimating the Cost of a Grain Bagging System

    Estimating the Cost of a Grain Bagging System

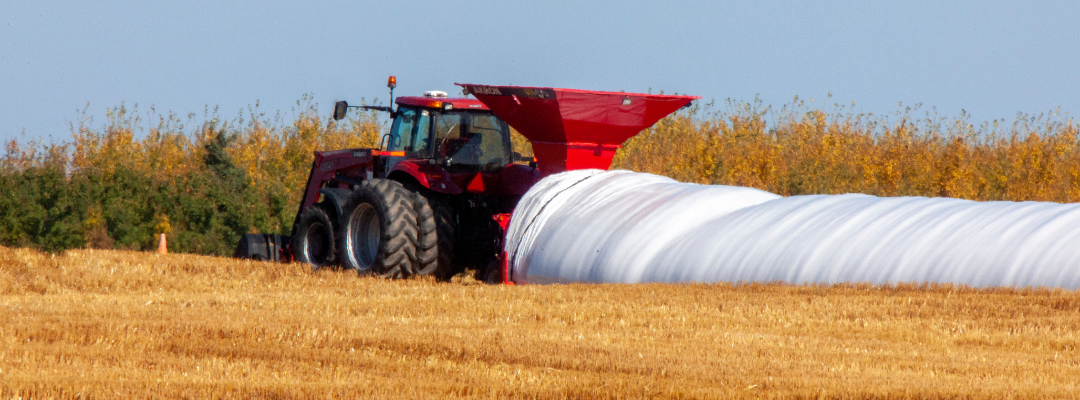
    Storage can be a valuable risk management and marketing tool for Southern corn producers. Storage allows producers to reduce harvest delays, avoid seasonal price lows, expand the marketing window, and harvest grain at higher moisture – if drying or aeration is available. There are two main options to store grain: grain bins or grain bags. This article provides an overview of the benefits, ownership costs, and operating costs for a grain bagging system.

    Benefits

    Labor continues to be a major challenge for agricultural producers. One of the primary benefits to using a bag system is the ability to reduce harvest labor requirements, particularly trucking. Storing corn at the edge of the field reduces the number of trucks required to keep combines running, avoids long lines at elevators and barge points, and distributes hauling to terminal markets during times of the year when labor is more readily available. Additionally, the ability to harvest a crop quickly reduces the risk of losses due to adverse weather. Extending the marketing interval allows producers to benefit from post-harvest price rallies. For example, in Memphis Tennessee, the ten-year average corn price was 70 cents higher in March/April compared to the harvest low. Mid-south producers that have cotton in their crop rotation can use bagging systems to modify annual storage availability, thus avoiding capital investment in permanent grain storage infrastructure when planted acreage varies year-to-year.

    Ownership Costs

    A bagging system requires capital investment in a loader, unloader, and tractor. This equipment is in addition to grain carts/trucks to transport grain from the combine to bagger. Purchase prices vary however many loaders can be obtained for less than $50,000. Bag unloaders will also cost around $50,000. Most operations will have access to a tractor that can be utilized in a bagging system, however this cost should also be included. Cost of ownership will vary for each operation; however, cost estimates should include capital recovery (depreciation + interest), taxes, insurance, and housing (TIH). For example, assuming an interest rate of 6.5% and TIH of 2.0% of the equipment value, estimated ownership costs for 100,000 bushels of storage is approximately 14 cents/bushel. Storing more bushels will distribute fixed costs lowering the ownership cost per bushel. 

    Operating Costs

    Operating costs vary by system; however, producers should consider site preparation, purchase price of storage bags, labor (loading, unloading, and monitoring), insecticides, sensors, bag disposal, and machinery expenses (fuel, repair and maintenance). Additionally, producers should account for potential storage loss/risk. Wildlife damage, insect and rodent infestation, weather, and damage from humans present a risk for storage losses. Estimated operating costs based on the assumptions below in Table 1 are 17-22 cents per bushel. Costs are highly variable so producers are encouraged to estimate costs based on operation specific variables and assumptions.

    Bagging systems may be a cost-effective method to store grain for Mid-south producers. Producers are encouraged to weigh the advantages and disadvantages of permanent storage (bin) and temporary storage (bag) systems to determine which system is best for their operation. Additionally, comparing ownership and operating costs with seasonal corn prices in your area will assist in determining if investment in storage is financially beneficial for your operation.

    Table 1. Example: Operating Cost Assumptions

    ValueUnit
    Bag Size16,000bu
    Bag Price$1,100$/bag
    Labor Rate$22,000$/hr
    Diesel Price$6.00$/gallon
    Interest Rate (Operating)6.5%%
    Repair and Maintenance5.0%% of purchase price

    Resources:

    Estimating Costs for Grain Storage: Bags and Bins- https://extension.tennessee.edu/publications/Documents/W1060.pdf

    Spreadsheet: https://arec.tennessee.edu/grain-bag-and-bin-storage/


    Duncan, Hence, and S. Aaron Smith. “Estimating the Cost of a Grain Bagging System.” Southern Ag Today 2(31.3). July 27, 2022. Permalink
  • Current Non-Real Estate Farm Debt

    Current Non-Real Estate Farm Debt

    Agricultural producers are currently having to manage numerous factors, including drought and rising input costs. In addition, the ag sector will see interest rates continue to increase as the Federal Reserve tries to reduce inflation. As the general economy and ag economy moves into a high interest rate environment, understanding agriculture debt becomes important. The majority of loans originate from the farm credit system or commercial banks. Every commercial bank in the U.S. submits quarterly performance reports. These reports include the number of agricultural loans and the status (on time or late) of the loans. Figure 1 displays the total loan volume, and total loan volume for all three late type volumes (30-89 days late, 90+ days late, Non-Accrual) for the last five quarters. The totals are for all the states in the Southern Region. 

    Through the first quarter of 2022, loans that are non-accrual and 90+ days late have maintained their trend. Non-accrual loan volume continued to decrease, while 90+ days late loans stayed relatively steady. These are positive indications that delinquent loan debt hasn’t increased. Total loan volume is approximately $1 billion higher than a year ago. This is expected as input costs have increased. Total debt volume for loans that are 30-89 days late continued to increase. This increase was expected due to the seasonality of these loans. That is, the highest volume of late loans is seen annually in Q1 and the lowest annually in Q3. Interestingly, the total volume of these loans (30-89 days late) is $8 million lower than in 2021. This also is a positive sign that loans stayed current over the past year, even with the increased input costs.   

    As we move into a high interest rate environment, the current status of commercial ag debt has some positivity. But this positivity could reverse for several reasons (i.e., drought continuation in areas). In the coming months, it is crucial that producers are efficient with their capital consumption and are mindful of their debt structure. 


    Martinez, Charley, and Haylee Ferguson. “Current Non-Real Estate Farm Debt“. Southern Ag Today 2(30.3). July 20, 2022. Permalink

  • Careful on the Curves

    Careful on the Curves

    Interest rates and inflation are closely linked phenomena.  As we discussed last week, expectations about inflation can provide insights to the direction of our overall economy.  The yield curve is another place where the market interest rates reveal a sense of what the market expects with regard to inflation and future economic conditions.

    The yield curve is simply the structure of market interest rates for instruments (treasury bills or corporate bonds) with varying maturity dates.  Ordinarily, the yield curve is expected to slope upwards: that is, as maturity length on a financial instrument increases, the yield on that instrument increases as well, reflecting the normal expectation that investors have to receive a higher yield to commit to longer-maturing investments.  In addition to the higher real interest and risk premiums associated with longer-maturing investments, expectations about inflation are embedded in the relationship between time to maturity and yield. 

    A steep yield curve (longer term rates are much higher than shorter term rates) can suggest the market expects higher inflation, economic growth, and/or volatility.  A flatter curve (little difference between short and long term rates) can signal lower inflation expectations and more stability.  Sometimes the yield curve inverts or slopes downward, with yields declining as maturity increases.  An inverted yield curve signals expectations of deflation and is a fairly reliable indicator of an impending recession.  

    Figure 1 shows the yield curve for Treasury bills/notes with maturities from one month to 10 years for the last day of April 2022 compared yield curves from February 2020 and November 2007. 

    Figure 1.  Treasury Yield by Maturity: Selected Daily Yields, 2007 to 2022

    Data Source: U.S. Department of the Treasury.  

    Clearly, in the recessionary environments of 2007 and 2020, the yield on long-maturity instruments was much lower relative to short-maturity instruments than would generally be expected.

    Recent changes in the shape of the yield curve trace out the development of inflation expectations in the post pandemic period.  Figure 2 shows the daily yield curve in two-month intervals beginning with the last trading day in August 2021. 

    Figure 2.  Treasury Yield by Maturity: Selected Daily Yields, 2021 to 2022

    Data Source: U.S. Department of the Treasury.  

    Not only have rates increased since last summer, but the slope of the yield curve has changed.  For maturities ranging from 1-month to 2-years, the curve has grown considerably more steep as of June 2022, likely indicating expecations of a continued struggle with inflation in the near term.  However, for maturities over the range of 1-year to 10-years, the curve has become flatter (compare October 2021 with June 2022).  The yield curve has not inverted as, for example, in 2007, which would suggest strong expectations of an imminent recession.  However, the longer term portion of the curve becoming flatter suggests an outlook of at least a slowdown in the economy that eventually gets inflation under control. 

    Klose, Steven and John D. Anderson. “Careful on the Curves.” Southern Ag Today 2(29.3). July 13, 2022. Permalink

  • Influential Expectations

    Influential Expectations

    When referencing prices, nominal simply means the actual quoted price of a good at a given time.  Real is a concept used to remove the inflation effect on prices and compare the true value of a good in different time periods.  For example, the US average price of gasoline recently hit $5/gallon.  To truly understand how expensive today’s prices are, we would have to account for inflation and adjust past gas prices to be quoted in 2022 dollars.  The inflation adjustment makes it a “real” value comparison.

    Real and Nominal also have a unique meaning when it comes to interest rates, and again inflation is a key component.  Nominal interest rates are the value you see quoted for a loan, a certificate of deposit, or yield on a bond.  The total nominal interest rate is made up of several components: the real interest rate, a risk premium, and expected inflation.  The real interest rate is the underlying cost of using someone else’s capital for a period of time.  The risk premium accounts for the uncertainty of the loan due to the credit worthiness of the borrower and/or how the loan is to be used.  Finally, expected inflation is added to account for the change in purchasing power between original loan proceeds and the loan repayment at a later date.  If, for example, a lender was expecting 5% inflation over the next year, the real interest rate was around 1.5%, and the risk premium was another 1% (the lender thinks the borrower is a trustworthy fellow), he would quote a nominal interest rate of 7.5%. 

    Expected inflation is an important part of the greater economic picture today.  Peoples’ feelings and expectations about future inflation influence how they buy, sell, borrow, lend, and negotiate prices in the market place.  In no small part, expected inflation can create a self-fulfilling prophesy.  All of this brings us to an interesting bit of economic data that gives us a hint at today’s market expectations for inflation.  Nominal interest rate quotes are readily available, but the components as described above are not transpartent in those quotes; at best, they can be estimated.  One such estimate is known as the TIPS spread or the 5-Year Breakeven Inflation Rate.  TIPS refers to Treasury Inflation-Protected Securites which are adjusted to offset inflation.  The nominal yield for regular Treasury notes includes real interest rates, virtually no risk, and market expectations for inflation.  The yield on TIPS has the same components but excludes expected inflation, therefore the market’s expectation of inflation is revealed in the spread, or yield difference, between the two types of notes.  Figure 1 shows the TIPS spread on five-year Treasury notes over the past twenty years.  The TIPS spread quickly rose from near zero at the onset of the pandemic to a high of 3.5% in mid to late March.  The spread has since fallen back to around 2.75% as of last week.  The decline over the last three months coincides with the Fed’s more aggressive action to fight inflation.  It’s too early to tell if the Fed’s higher interest rates are slowing down inflation, but this early indication in the TIPS spread suggests market expectations are improving with regard to inflation.  If your glass if half full, it’s an encouraging step it the right direction.  If your glass is half empty, a decline in inflation expections also reflects a growing concern about a future recession.  In reality, both interpretations are relevant regardless of how much water is in your glass.    

    Figure 1. Daily Yield Difference between Regular and Inflation-Protected 5-Year Treasury Notes

    Data Source: St. Louis Federal Reserve Bank

    Klose, Steven, and John D. Anderson. “Influential Expectations.” Southern Ag Today 2(28.3). July 6, 2022. Permalink

  • Can Solar Panels Improve Contract Farm Profitability?

    Can Solar Panels Improve Contract Farm Profitability?

    The cost of solar systems has been decreasing rapidly over the past 10 years, making it an attractive option for poultry growers across the U.S. seeking to counteract rising electricity costs. However, it is imperative that growers understand how a typical contract pays them back for their solar investment. The key points are how much electricity a system produces and the value of that electricity to the farm.

    Barring other restrictions, the maximum sized solar generation system utility companies typically allow a customer to install and connect to their grid is one with solar production capacity equal to the customer’s normal annual usage. Many solar installers will use this basic design logic to sell a customer a  large system  claiming they are going to offset 100% of the power bill. That claim will likely not be true for a poultry grower because the variable usage pattern of poultry production. The chart illustrates an example electric usage pattern of a poultry farm vs. the solar production potential of varying sized systems (100%, 50%, and 30% of annual usage). The highly variable usage pattern results in a lot of excess solar energy produced that is not being used by equipment on the farm but is put back on the grid. The realized value of the excess solar energy is highly variable across utility companies and for many growers in southeastern states, they will be compensated for it at rates much lower than retail. 

    To further examine how this scenario works out for contract poultry growers, a recent study was published in the Journal of American Society of Farm Managers and Rural Appraisers that examines how the variable power usage of broiler farms interacts with solar production and the resulting effect on the profitability of various solar system scenarios such as system size, location, and electricity rates. The study showed that under a simple net billing arrangement, where excess solar is valued at close to wholesale rates by the utility company, maximizing system size to match annual usage was not the most profitable, and in fact could be a losing proposition. The study also showed the impact of cost-share and tax credit incentives on profitability. The full study can be found here: https://higherlogicdownload.s3.amazonaws.com/ASFMRA/aeb240ec-5d8f-447f-80ff-3c90f13db621/UploadedImages/Journal/2022/SolarSystemProfitability_2022Journal.pdf

    The variable electricity usage pattern of poultry farms greatly affects the amount of lower valued excess solar energy a system produces (energy above the red line) compared to solar that directly offsets retail purchases (energy below the red line.) 

    Brothers, Dennis. “Can Solar Panels Improve Contract Poultry Farm Profitability?“. Southern Ag Today 2(27.3). June 29, 2022. Permalink