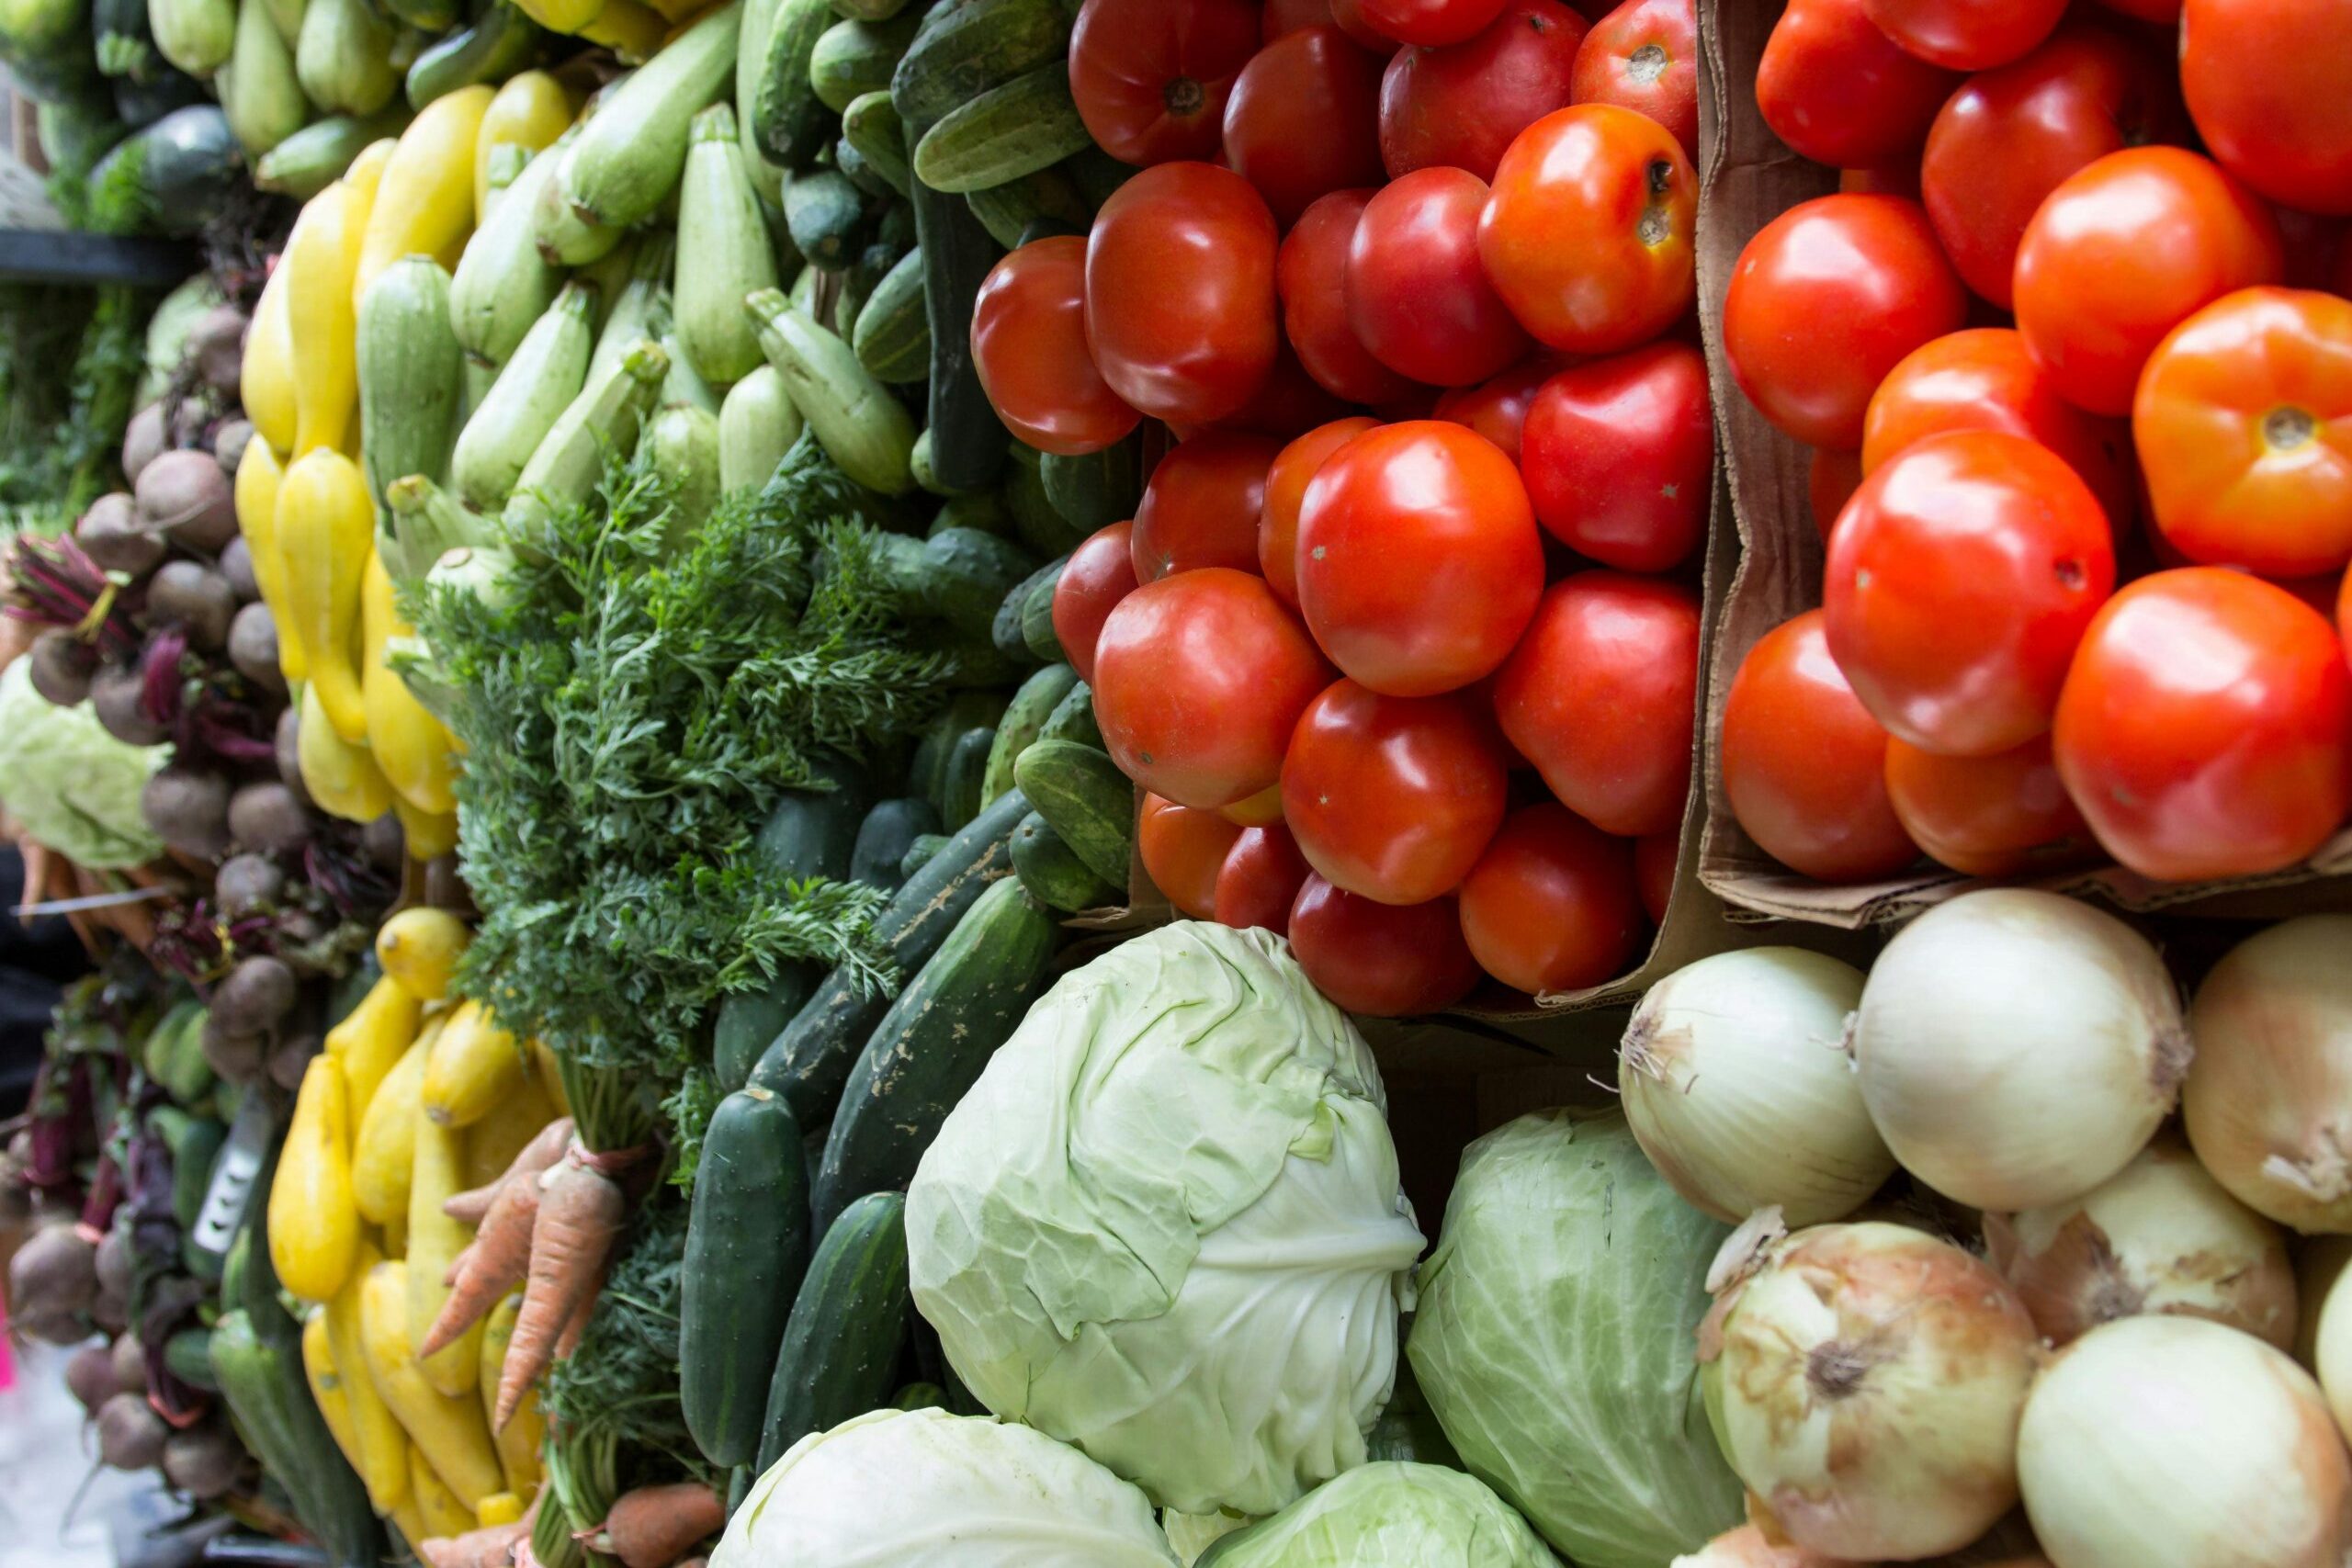
In recent years, fresh fruit and vegetable production in the United States has been on the decline, U.S. production has decreased by 10 and 23.1 percent respectively since 2000. With declining domestic production, imports of fresh fruits and vegetables have grown substantially with some products only being available in the United States due to imports. Since 2020, a larger share of the total supply of fresh fruit in the United States was imported than grown domestically and has increased from 36.6 percent in 2000 to 54.8 percent in 2022 (Figure 1). Vegetable imports in 2022 were 29.3 percent of the total supply up from 9.5% in 2000. The value of imported fresh fruits and vegetables for 2022 was $18.23 billion. After including exports, the total volume of fresh fruits and vegetables available in the United States was 94.65 billion pounds, or 283.63 pounds per capita.
The United States has gone from being a net exporter of fresh produce in 1980 with 3.25 billion pounds to a net importer starting in 1998 with 1.88 billion pounds (Figure 2). Net trade of fresh produce, excluding bananas, for the United States during 2022 totaled 24.4 billion pounds of trade deficit and has been over 10 billion pounds since 2013. The United States was a net exporter of fresh fruits, excluding bananas, from 1980 to 2002, since then the United States net imports have grown considerably. During 1980 the United States trade surplus of fresh fruits, excluding bananas, totaled 3.11 billion pounds of exports. In 2022, the trade deficit of fresh fruits, excluding bananas, totals 10.4 billion pounds of imports. As for fresh vegetables, the United States has not had exports exceed imports since 1992. During 2022, imports of fresh vegetables were 13.9 billion pounds higher than exports and continue to grow.
Japan is one of the largest beef importing countries in the world and stands out among major destinations for the U.S. In 2023, U.S. beef exports totaled $10 billion, with nearly $2 billion going to the Japanese market. This was only surpassed by exports to South Korea ($2.1 billion). However, Japan has been the leading U.S. market until recent years (USDA, 2024). It was not long ago when U.S. beef was outright banned in Japan due to BSE concerns (2004-2006) and was still somewhat restricted even after the ban was lifted (Muhammad et al., 2016). However, since then, the U.S. has been regaining market share and is once again the leading supplier of imported beef in Japan. This article focuses on the success of U.S. beef in Japan, highlighting the competition between the U.S. and Australia. Japanese beef imports have been relatively split between the U.S. and Australian beef – together, both account for around 80% of Japan’s total imports. Interestingly, the U.S. and Australia have similar but competing trade agreements with Japan: the U.S.-Japan Trade Agreement (USJTA) and Comprehensive and Progressive Agreement for Trans-Pacific Partnership (CPTPP) and face near identical reductions in beef tariffs since January 2020.
Annual quantity shares for beef exporting countries in Japan (e.g., Australia, U.S.) are reported in Figure 1. Import quantities have not significantly changed since 2000, and recent highs in export values (e.g., $4.9 billion in 2022) were mostly due to relatively higher prices (Trade Data Monitor®, 2024). Since quantities have been relatively unchanging, the change in shares reported in the figure reflects substitutions across countries. Prior to the BSE ban in 2004-2006, U.S. beef accounted for more than 50% of Japanese beef imports but decreased to almost 0% during the BSE ban period. Since 2006, however, the U.S. beef share has steadily increased to around 40% by 2017, peaking at 44% in 2020 when the USJTA entered into force, while the share for Australia decreased from more than 80% in 2006 to 41% by 2020. It is important to note that the declining share for Australia starting in 2018 was also due to increased exports from countries other than the U.S.
In terms of value, the U.S. currently exports significantly more to Japan than Australia. For instance, in 2022, when U.S. beef exports reached a record high of $2.3 billion, Australia exported only $1.6 billion. Noted reasons for higher U.S. values include the following: relatively higher prices for grain-fed U.S. beef; the fact that the U.S. mostly exports brisket, plate, chuck, and round, whereas Australia mostly exports chuck, round, loin, and other cuts; and the U.S. dominates the beef offal market in Japan where chilled offal (internal organs and cheek meet) and frozen beef tongue sell anywhere from 50% to 100% more than the traditional muscle cuts and beef product (Trade Data Monitor®, 2024).
Figure 1. Quantity shares of Japanese beef imports by exporting country: 2000–2023
Note: CPTPP is the Comprehensive and Progressive Agreement for Trans-Pacific Partnership, and USJTA is the U.S.-Japan Trade Agreement. Source: Trade Data Monitor® (2024)
References
Muhammad, A., K.E.R. Heerman, A. Melton, and J. Dyck. 2016. Tariff Reforms and the Competitiveness of U.S. Beef in Japan. LDPM-259-01. Economic Research Service, U.S. Department of Agriculture. https://www.ers.usda.gov/publications/pub-details/?pubid=37650
Agricultural trade has certainly been a major topic among farmers and farm organizations recently amidst declining U.S. ag exports, a new era of ag trade deficits, and disappointment over trade policy. Dating back to colonial days, trade has been a major part of the Southern agricultural economy. Historically, the Southern region has produced, marketed, and shipped various unique southern commodities such as tobacco, rice, cotton and sugar, along with grains, livestock products, fruits, and vegetables to markets around the globe.
How important is agricultural trade to various southern states today? In reality, individual state or regional trade data are difficult to measure since agricultural production, processing, and trade can occur in multiple states and/or regions. For example, a calf born and backgrounded in a southern state, might be finished at a feed lot in the midwest, and proccessed/packaged for export in another state or region. Which state/region gets credit for this export?
USDA’s Foreign Agricultural Service (FAS) relies on data from Census where U.S. ag exports by state or region are based on the final origin of movement of the product to the export market. Given a large volume of U.S. grain shipped out of New Orleans, the FAS methodology results in Louisana being the nation’s largest ag exporting state, despite the vast majority of these grains being produced in other states. Thus, FAS export data will generally understate the relative importance of international markets for inland states. Over the past five years (2019-2023), the FAS database ranks the Southern region as the leading ag exporting region with 38% of the value of U.S. agricultural exports, followed by the Western region (31%), Midwestern region (25%) and the Northeastern region (5%). According to the FAS database, five of the eight largest U.S. agricultual ports by volume are located in the Southern region which accounted for 60% of U.S. ag export volume over the past five years, with New Orleans being the largest ag port accounting for 36% of U.S. ag export volume and 18% of U.S. ag export value.
Alternatively, USDA’s Economic Research Service (ERS) measures trade data by state based on the state’s share of production value (cash receipts). Using the ERS methodology, within the southern region Texas recorded the largest value of agricultural exports over the past five years, averaging $6.9 billion of ag exports annually (ranks 6th nationally), followed by North Carolina ($3.9 billion), Arkansas (3.5 billion), Florida ($3.4 billion), Georgia ($3.1 billion) and Kentucky ($2.7 billion). Regionally, the ERS database ranks the Midwestern region as the largest exporting region with 48.1% of U.S. ag exports over the past five years, compared to only 23.2% for the Southern region, reflecting a large percentage of the U.S. agriculture initially produced in the Midwest, but exported out of other regions.
What about the relative importance of agricultural trade? Adopting the ERS methodolgy, ag exports represents about 1/3 of ag cash receipts in the Southern region. Using this metric, Table 1 illustrates that over the past five years of ERS export data,, Louisiana is the most ag trade-dependent Southern U.S. state with ag exports accounting for nearly one half of the state’s ag cash receipts, followed by Tennessee, Florida, Kentucky, and Mississippi rounding out the top five.
Table 1: Ag Export Trade Dependency
Southern U.S. State
Ag Exports as a Percent of Ag Cash Receipts (2018-2022)*
U.S. Rank
1. Louisiana
49.0%
5
2. Tennessee
44.6%
11
3. Florida
42.8%
14
4 . Kentucky
42.2%
16
5. Mississippi
38.2%
22
6. Arkansas
35.5%
25
7. South Carolina
35.4%
26
8. Virginia
32.6%
30
9. Georgia
32.6%
31
10. Maryland
32.4%
32
11. North Carolina
31.7%
34
12. Texas
29.6%
37
13. Oklahoma
27.3%
41
14. Alabama
24.5%
46
*Source: Calculations based on ERS/USDA data
Snell, Will. “Trade’s Importance to Southern Agriculture.” Southern Ag Today 4(18.4). May 2, 2024. Permalink
The United States (U.S.) is the fifth largest sugar producing country in the world, but also the third largest sugar importer (U.S. Department of Agriculture (USDA) Foreign Agricultural Service (FAS), 2024). Last year, the U.S. imported sugar from more than 70 countries and met roughly 29% of demand through preferential-access imports and high-tier (also known as tier-2) imports. When domestic production rises, the U.S. will import less sugar and vice-versa. An important aspect of the U.S. trade in sugar are the Suspension Agreements[1] on sugar with Mexico, which went into place in 2014 and were revised in 2017 (USDA Economic Research Service (ERS), 2024).
As part of U.S. sugar supply, preferential access is granted to trading partners through the World Trade Organization (WTO) or through free trade agreements (FTAs). Sugar that enters under those agreements arrive under a tariff-rate quota (or TRQ), which effectively allows sugar to enter the U.S. duty-free (USDA ERS, 2024). Those who import sugar into the U.S. above the quota are required to pay a duty to the U.S. government (tier-2 duty), which was established in 1994 at the rate of 15.36 cents/pound for raw sugar and 16.21 cents per pound for refined sugar (USDA ERS, 2024). The U.S. is projected to import an average 425,000 tons of tier-2 sugar per year (USDA, 2024).
Administratively, the USDA Secretary announces the minimum quantity of sugar under its WTO commitments that may be imported at the in-quota tariff rate prior to the start of the fiscal year and may increase that amount of preferential-access sugar as the year progresses depending on the amount of sugar that Mexico (the largest U.S. trading partner for sugar) is anticipated to export to the U.S. and depending on the U.S. supply and demand situation.
For fiscal year 2023/24, total sugar imports into the U.S. are estimated at 3.42 million short tons raw value (STRV), down from last year’s estimate of 3.61 million STRV (henceforth we will refer to STRV as tons) (Figure 1). The USDA recently increased the raw sugar TRQ by 137,789 STRV after determining that additional supplies of raw cane sugar were required in the U.S. market (announced March 7th, Federal Register, 2024).
While the overall amount of sugar imported into the U.S. has not changed dramatically from year to year, it is notable to consider the period post-free trade with Mexico as well as several anomalous years (Figure 1). Under NAFTA, Mexico had the ability to send unlimited amounts of sugar to the U.S. market if that sugar was not subsidized by the Mexican government or dumped on the U.S. market. Following the more than 2 million tons of sugar exports to the U.S. in fiscal years 2012/13 and 2013/14, the U.S. sugar industry sued Mexico at the International Trade Commission, which found Mexico guilty of subsidizing and dumping sugar in the U.S and causing significant damage to American sugarbeet and sugarcane farmers. The two countries negotiated Suspension Agreements to manage that trade (both with respect to quantity and price) following 2014 (U.S. International Trade Administration, 2024). More recently, Mexico has suffered drought, and thus the amount of sugar they supply to the U.S. market has been sharply constrained. As a result, the amount of tier-2 sugar entering the U.S. market has been increasing (Figure 1).
Figure 1. Total U.S. sugar imports by source. USDA, 2024.
While Mexico is still the largest foreign supplier of sugar to the U.S., over the past few years the crop in Mexico has been limited due to drought conditions and high fertilizer costs. As a result, and as mentioned above, there have been large amounts of sugar arriving, both under preferential access (e.g., WTO and FTA trade agreements) and through tier-2 imports. As reported by USDA (2024), in fiscal year 2022/23 Mexico was still the largest exporter to the U.S. with more than 1.1 million tons of sugar shipped to the U.S. Other countries exporting more than 100,000 tons of sugar to the U.S for the period included Brazil, Guatemala, Dominican Republic, Columbia, El Salvador, Costa Rica, and Argentina (U.S. Census Bureau, 2024). Overall, in fiscal year 2022/23 the U.S. imported 3.61 million tons of sugar from more than 70 countries (USDA, 2024).
Given forecast sugar use in the U.S. of 12.56 million tons and exports of at least 197,000 tons, the carryover this year is expected to be 1.72 million tons of sugar, or roughly 3.44 billion pounds of sugar (Deliberto and DeLong, 2024; updated for April WASDE). That brings the forecast of stocks-to-use to 13.5%. Of course, throughout the remainder of this year, there will be adjustments to both supply and demand that will typically result in a stocks-to-use that will likely fall within the USDA target range of 13.5% to 15.5% by the end of the year.
Based on the production of 9.22 million tons relative to demand – plus total use of closer to 12.75 million tons – the U.S. will likely import about 3.42 million tons of sugar this year, or 26.8% of total use. That would keep the U.S. as the fifth largest sugar producer and the third largest sugar importer in the world.
[1] For more on the Suspension Agreements with Mexico, see this previous article in Southern Ag Today.
The global rice market has seen a fair share of volatility in the current marketing year, which started off with India’s export ban on white non-basmati rice on July 2023 (see https://southernagtoday.org/2023/07/27/shaking-the-global-rice-market-india-bans-exports-of-white-non-basmati-rice/). While India is bypassing the export ban with government-to-government sales, still the impact of that measure has been felt globally through higher export prices and export activity out of other major rice exporters such as Thailand and Vietnam. Export prices for long-grain non-aromatic rice out of Asia have for the most part remained above $600/metric ton (mt) since then (USDA, 2024a; FAO, 2024).
Export prices for U.S. long-grain rice have remained stable since August at around $760-765/mt (USDA, 2024a), which reduced the gap between U.S. and Asian rice prices significantly. For example, in marketing year 2022/23 the average U.S. export price for long grain milled rice #2/4% was $743/mt relative to $481/mt for Thailand 100% B and $460/mt for Vietnam 5%, that is, a 55% and 61% price premium for U.S. rice relative to Thai and Vietnamese rice, respectively. In the first seven months (August-February) of the current 2023/24 marketing year the U.S. rice price premium has decreased to 20% and 18% relative to Thai and Vietnamese rice, respectively. Arguably more importantly, U.S. export prices so far in 2023/24 have been much more competitive vis-à-vis Mercosur rice (average quotes of $819/mt and $792/mt for Brazilian and Uruguayan long-grain 5% rice, respectively (FAO, 2024)), in part due to the large 2023 U.S. crop (153.9 million hundredweight (cwt) according to the March 2024 WASDE Report (USDA, 2024b)) and short 2023 Mercosur rice crop (303 million cwt or 8% below the average of the previous 3 years).
The increased price competitiveness of U.S. long-grain rice so far in 2023/24 can explain the extraordinary performance of exports so far. The volume of long-grain rice exports negotiated in the first seven months of the 2023/24 marketing year (53.7 million cwt rough basis) increased 82% relative to the same period in 2022/23, driven primarily by paddy rice exports (175% increase) and milled rice (33% increase). Exports to Mexico increased from 1.76 million cwt in August-February of 2022/23 to 11.2 million cwt in the same period in 2023/24, largely at the expense of Brazilian paddy rice. On the milled rice segment, Haiti and Iraq remain the largest destinations with 38% and 26% of long grain milled rice exports, respectively.
Figure 1. Exports of U.S. long-grain rice to selected core markets in the first seven months of the last eight marketing years (rice marketing year: August-July).
Overall, USDA’s supply and use projections for 2023/24 point to a 14% increase in supply (driven by increases in both production and imports), a 17% increase in use (driven by increases in domestic use and exports), leading to a 6% reduction in ending stocks (USDA, 2024b).
With the 2023/24 performance as reference, what can we expect for the upcoming marketing year? USDA’s March 2024 prospective plantings (USDA, 2024c) suggest a 12.2% increase in long grain area relative to last year (2.3 relative to 2.05 million acres in 2023), with most of the increase expected in Arkansas. At 2023 average yields, the increase in area will amount to a 16 million cwt increase in production reaching 170 million cwt in 2024, which will put pressure on exports to clear the market. At the same time, rice harvest in Mercosur is coming to an end and production is projected to increase by 9% to 329 million cwt, mainly in Brazil, which will potentially put pressure on U.S. exports in core markets in Mexico and Central America. Finally, it is important to acknowledge the risky nature of U.S. milled rice exports. First, the delicate social, political, and economic situation in Haiti makes that trade highly risky. Second, trade with Iraq has been highly political in nature, which also leaves the industry at the mercy of forces beyond their control. In summary, the expected size of the 2024 U.S. crop (as inferred from March 2024 prospective plantings), the large Mercosur crop, and the risks in key export outlets can be seen as warnings for the upcoming U.S. long-grain season. Moreover, if India decides to end the export ban (still unknown), then further downward price pressure may be expected.