Every July at the Southern Extension Committee Meetings, Southern Ag Today likes to take the opportunity to recognize our authors for all their hard work. We look at all the articles written over the past year May 2022 – April 2023 and decide which were read, viewed, and shared the most using our analytics. We are pleased to announce our 2022-2023 winners.
In 2022, U.S. consumers faced persistently high egg prices, where egg prices increased significantly more than food prices overall. According to the Bureau of Labor Statistics, the average retail price of eggs (grade A, not seasonally adjusted) reached a record high of $4.25/dozen in December 2022, up 138% from December 2021 ($1.79/dozen). The reasons given for this surge included supply-chain disruptions due to the COVID-19 pandemic, increased egg demand during the holiday season, and overall inflation, but most articles cited highly pathogenic avian influenza (i.e., bird flu) outbreaks and resulting bird loss as the primary cause. In a recent article in Choices (Muhammad et al., 2023), I proposed that higher production costs along with the negative consequences of bird flu sufficiently explained the rise in egg prices. The reason why I was not completely sold on bird flu as the sole or even primary cause is that the U.S. experienced similar and even larger losses in the egg laying population due to bird flu in 2015, yet egg prices did not increase as much as they did in 2022. To be certain, egg prices did increase in 2015, peaking at $2.97/dozen, but this increase was still significantly less than what was experienced last year.
What many failed to discuss—including me—is the role that imports might have played in mitigating the effects of negative production shocks due to substantial declines in the U.S. egg-laying population. Figure 1 shows relative bird loss, expressed as a percent of the total table-egg laying population, and the quantity of in-shell egg imports (million dozen) from January 2010 to December 2022. The U.S. table egg laying population ranged from 283 million birds in 2010 to a high of 337 million birds in 2019, and monthly bird losses between 2% and 4% appear to be the price of doing business. In 2015, however, bird losses peaked at 11% due to bird flu. In the months that immediately followed, in-shell egg imports reached record levels, increasing to nearly 14 million dozen in October 2015, which is more than a 2,000% increase when compared to average monthly imports prior and in the months that followed (less than one million dozen on average). Imports did not significantly increase again until 2022 when bird losses peaked at around 9% in 2022 and exceeded 4% in the months that followed. Unlike 2015, however, the response in in-shelled egg imports was marginal by comparison, increasing to only 2 million dozen in late 2022. The reasons for the significantly larger import response in 2015 versus 2022 is a subject for another time. But what is clear is that the surge in imports in 2015 and the relatively modest import increase in 2020 could be a reason why egg prices increased more so in 2022.
Figure 1. Relative Bird Loss and In-Shelled Egg Imports in the United States: January 2010 – December 2022
Note: Relative bird loss is a measure of monthly losses expressed as a percent of the total table-egg laying population (total flock) in the U.S. Sources: Livestock Marketing Information Center (LMIC) (2023) https://lmic.info/; USDA Quick Stats (2023) https://quickstats.nass.usda.gov; and USDA Foreign Agricultural Service (2013) https://apps.fas.usda.gov/gats/default.aspx.
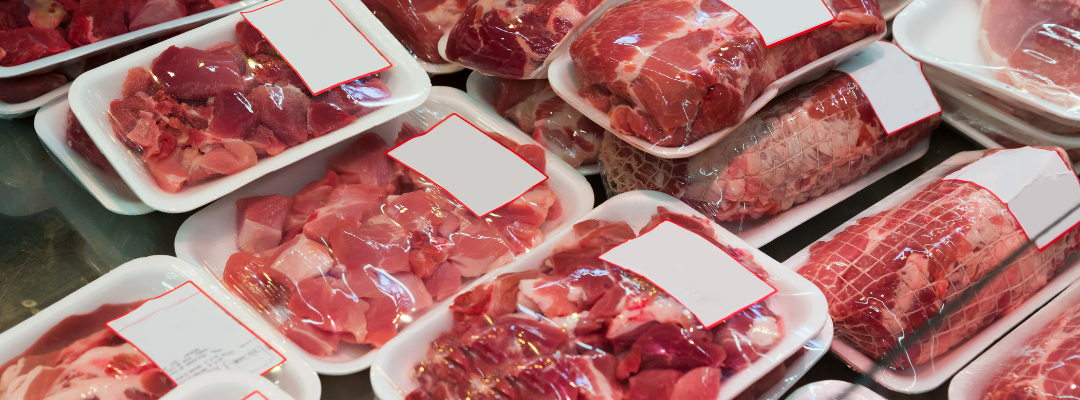
Despite record beef exports in 2022 ($11.7 billion), there are signs of weakening beef trade for the U.S. in 2023. Note that total U.S. beef and beef product exports year-to-date (January-March) in 2023 were down in terms of value by 22% when compared to the same period in 2022, and down 8% in terms of volume. This overall decline was primarily driven by declines in sales to Asian markets, most notably the leading destinations for U.S. beef exports: Japan, South Korea, and China. In terms of value (volume), U.S. beef exports to Japan were down 20% (4%), South Korea 36% (15%), and China 21% (15%) (USDA, 2023). A noted reason for these declines is the relatively strong U.S. dollar, which has made beef exports relatively more expensive, and recent and anticipated declines in U.S. beef production.
In previous SAT articles, I highlighted the rise of China as a major buyer of U.S. beef and a major beef importing country overall. As mentioned in these articles, China emerged from relative obscurity and is now the third leading market for U.S. beef behind Japan and South Korea. In 2022, China imported $2.2 billion dollars of U.S. beef and beef products, with sales comparable to well established foreign markets: South Korea ($2.7 billion in 2022) and Japan ($2.3 billion in 2022). Unfortunately, the trade data for 2023 indicate that U.S. beef may be losing ground in the Chinese market. Figure 1 shows China’s beef imports from the U.S., as well as from all countries in 2022 and 2023 (January – March). Even as U.S. beef exports to China declined in the first quarter of 2023 from $382 million to $344 million (or 40 thousand to 38 thousand metric tons), China’s beef imports overall increased by more than $100 million and nearly 103 thousand metric tons. According to Trade Data Monitor® (2023), China imported 125% more beef from Brazil during this period (124 thousand metric tons in the first quarter of 2022 versus 280 thousand metric tons in 2023). Foreign demand for U.S. beef demand will remain a significant concern going forward as declining beef production could put even more pressure on U.S. beef prices. It appears that this is having and will continue to have a negative impact on U.S. beef exports overall and in China in particular.
Figure 1. China’s beef and beef product imports in 2022 and 2023: YTD (January – March)
Note: TMT is Thousand Metric Tons. Beef and beef products are defined according to the U.S. Department of Agriculture BICO category, which mostly comprised of beef cuts and to a lesser degree beef offal. Source: Trade Data Monitor®
In 2022, the Mississippi River experienced a severe drought that disrupted barge transportation from the Midwest to ports on the Gulf of Mexico. Our research found that the drought led to a 3.9% reduction in agricultural exports from Louisiana ports, resulting in agricultural trade losses of $563.9 million between July 2022 and January 2023. Wheat exports were the most affected, with a considerable decrease in export volume of 350 million kilograms at Louisiana ports. However, there was limited evidence of adverse trade effects for soybeans and corn.
While we found some evidence of negative effects on agricultural commodities at the beginning of the Mississippi River drought in 2022, there was a strong trade recovery when transportation disruptions ended. As a result, there was limited diversion for affected commodities except for wheat, which was diverted to East and West coast ports.
Figure 1 shows that non-Louisiana Gulf ports experienced more pronounced trade disruptions (‑15.1%) than Louisiana ports (-3.9%), despite Louisiana ports accounting for over 86% of agricultural exports shipped through Gulf ports. Our study also found evidence of considerable trade diversion, with positive trade effects for East coast (5.8%) and West coast ports (7.1%). These estimates imply that some agricultural suppliers opted for alternative transportation modes to facilitate foreign shipments via ports on the East and West coasts.
Our research highlights the urgent need to mitigate the impact of natural disasters and supply chain disruptions on barge-dependent agricultural exports, especially on the Mississippi River. While various federal and state agencies offer direct relief and recovery support for drought impacts, a more comprehensive plan may be necessary to address this potential long-term issue. The lack of tools to deal with similar supply chain disruptions can limit the production capacity of agricultural farmers and their access to foreign markets.
While the Bipartisan Infrastructure Law has authorized up to $108 billion to support federal public transportation programs, including barge transportation on the Mississippi River, it may take time for these solutions to take effect, and the federal funding allocation for barge shipping remains unclear. It is crucial to enhance the availability and efficiency of alternative transportation options. Our study underscores the importance of adopting proactive measures to mitigate the impacts of climate-induced trade disruptions on U.S. agriculture.
Figure 1: Agricultural Trade Effects of the 2022 Mississippi River Drought.
Note. The figure shows the average post-event trade effects of the 2022 Mississippi River Drought for export volume and unit value by U.S. port region. All regressions include port-destination-good-event-year and port-destination-good-event-month fixed effects. The “Louisiana” label denotes ports within the state of Louisiana, while “Gulf” encompasses Gulf ports, excluding those in Louisiana. The “East” category includes ports in the South Atlantic and New England customs divisions, and the “West” category includes those ports from the Pacific customs divisions.
*This work was supported by the National Institute of Food and Agriculture through the Agriculture and Food Research Initiative Award 2019-67023-29343. This paper does not necessarily reflect the views of USDA. Full paper is available here: https://tinyurl.com/yn76tw3w.
According to USDA 2023 Prospective Plantings report, the long-grain rice planted area is projected at 1.96 million acres, a 9% increase relative to 2022, but still slightly below the 5-year average (2.0 million acres). At trend yields of 7,299 pounds per acre, we could expect a 14.6 million hundredweight (cwt) or 11.4% increase in production relative to 2022.
With the expected increase in production, the pressure will be on exports to perform well and help keep market prices stable. While the share of long-grain exports to total use has been decreasing steadily since 2015, exports still accounted for between 41% and 48% of total long-grain rice use during this period[1]. The short 2022 U.S. long-grain crop (on top of an already short 2021 crop) puts extra pressure on farm prices, which have reached record levels in 2022/23 (USDA estimates an average farm price of $16.90/cwt).
So far, 8 months into the 2022/23 marketing year, export performance has been lagging with only 34.9 million cwt (rough basis) of long-grain rice exported, compared to an average 52.4 million cwt during the same period in the last 5 years. Paddy rice exports are down almost half relative to last year, mostly due to a sharp 71% decrease in exports to Mexico and a 38% decrease in exports to Central America (Figure 1), where Mercosur (primarily Brazil) has displaced the U.S. as the top supplier. Exports of milled rice are showing a good performance despite the lack of price competitiveness, which indicates the importance of other factors aside from price. For example, the U.S. negotiated 250 thousand metric tons of milled rice exports to Iraq, a market in which U.S. rice is clearly not price competitive.
The expectation is that a larger 2023 U.S. crop and the smaller 2022 Brazilian crop (7.9% smaller than in 2021) could provide the incentives for the U.S. to reclaim at least part of the Mexican and Central American markets. However, other aspects related to (1) milling and culinary quality differences vis-à-vis Mercosur rice, and (2) the prospects of policy changes in Central America aimed at extending trade preferences to competing countries similar to those given to the U.S. under CAFTA-DR, may hinder the prospects for U.S. rice in these Latin American markets.
Figure 1. Exports of U.S. long-grain rice to Mexico and Central America in the first eight months of the last seven marketing years (rice marketing year: August-July).
[1] USDA includes imports of fragrant (jasmine and basmati) rice in the rice supply and use estimations, but they are removed in this analysis as fragrant rice is a different market segment than long-grain rice.