Category: Trade

  • U.S. Exports to China: Better than Last Year’s, But Still Below Phase I Agreement Levels for 2021

    U.S. Exports to China: Better than Last Year’s, But Still Below Phase I Agreement Levels for 2021

    US exports to China in 2021 reached almost $33 billion, a 24.6 percent increase from last year.  As a matter of fact, China has been the largest market for US commodities in the last couple of years surpassing Canada and Mexico.  Moreover, in 2021 China was the number one destination for soybeans, corn, sorghum, cotton, and nuts, accounting for 69 percent of all US commodities exported to China. Although year over year US exports to China have been higher, they still fell short of the agreed amount for 2021 under the Phase 1 agreement.  The chart above shows the monthly cumulative amount of US exports to China for 2012, 2020, 2021, and Phase I 2020 and 2021.  US exports to China in 2012 were the largest amount exported ever before the Phase 1 agreement, around $26 billion, while Phase 1 2020 and 2021 amounts were agreed at $32 and $39 billion, respectively.  The red line represents 2020 exports and the yellow line 2021 exports and both years US exports fell short of reaching 83 and 85 percent of the agreed amount under the Phase 1 agreement (blue and black lines). Although 2020 and 2021 exports fell below the agreed amount, both years marked the largest amount of US exports to China.  Hopefully, this trend continues for 2022 and beyond.

    Monthly Cumulative Amount of US Exports to China for 2012, 2020, 2021, and Phase I 2020 and 2021.  

    Source: GATS, FAS/USDA

    Ribera, Luis. “U.S. Exports to China: Better than Last Year’s, But Still Below Phase I Agreement Levels for 2021“. Southern Ag Today 2(7.4). February 10, 2022. Permalink

  • U.S. Imports and the Continued Rise in Fertilizer Prices

    U.S. Imports and the Continued Rise in Fertilizer Prices

    Last November, I wrote an article for Southern Ag Today about the spike in fertilizer prices. Since that time, import prices have continued to rise. As mentioned in the previous article, U.S. fertilizer imports have averaged nearly $6 billion over the last five years (around 25 million metric tons), accounting for a significant share of total U.S. fertilizer use (USDA-ERS, 2019). Additionally, the global fertilizer market had already been tightening before plants were forced to cut production given the rise in the cost of natural gas, a key feedstock (Larkin, 2021). Given the continued rise in U.S. fertilizer prices, a more detailed look at imports could help explain why the price of some fertilizers have increased more than others.

    In 2020, the U.S. imported about $6.5 billion in fertilizer. That year, the top imports included potassium chloride ($2.7 billion), urea ($1.3 billion), monoammonium phosphate ($590 million), urea-ammonium ($400 million), and diammonium phosphate ($400 million). In January 2020, import prices ranged from as low as $130 per metric ton (MT) for urea-ammonium to about $267/MT for and diammonium phosphate. In 2021, diammonium phosphate increased to over $1000/MT and monoammonium phosphate increased to over $700/MT; urea increased to over $500/MT. Interestingly, the price of imported diammonium phosphate fell in November 2021 to $625/MT, which was a significant decline from the $1,008/MT high the previous month. Other trends, however, suggest that fertilizer import prices will continue to increase.

    U.S. Fertilizer Import Prices Significantly Higher in 2021 Due to Global Supply and Demand Issues

    Source: U.S. Department of Agriculture, Foreign Agricultural Service’s Global Agricultural Trade System (2022). https://apps.fas.usda.gov/GATS/default.aspx

    References

    Larkin, N. (October 15, 2021) Supply Lines Fertilizer Crisis Piles More Pressure on World’s Future Food Supply. Bloomberghttps://www.bloomberg.com/news/newsletters/2021-10-15/supply-chain-latest-warnings-mount-over-fertilizer-crisis

    U.S. Department of Agriculture, Economic Research Service (USDA-ERS) (2019). Fertilizer Use and Pricehttps://www.ers.usda.gov/data-products/fertilizer-use-and-price.aspx  

    U.S. Department of Agriculture, Foreign Agricultural Service (USDA-FAS) (2022). Global Agricultural Trade System. GATSFertilizer Use and Pricehttps://apps.fas.usda.gov/gats/default.aspx


    Muhammad, Andrew. “U.S. Imports and the Continued Rise in Fertilizer Prices.” Southern Ag Today 2(5.4). January 27, 2022. Permalink

  • China’s Purchase of U.S. Cotton Increased in 2020 and 2021

    China’s Purchase of U.S. Cotton Increased in 2020 and 2021

    Tariffs, another form of taxes, are taxes or duties that a government charges on goods coming into or going out of their country. Import tariffs are taxes charged to imported products. On January 15, 2020, the U.S. and China signed the “Phase One” trade agreement, which eased two-year trade tensions between the two countries. In the Phase One trade agreement, China agreed to purchase no less than $12.5 billion U.S. agricultural products above the corresponding 2017 baseline amount in 2020, and no less than $19.5 billion above the 2017 baseline amount in 2021.

    The cotton industry was caught in the middle of the trade war. Additional 25% Chinese import tariffs were implemented on U.S. raw cotton. After signing the Phase One trade agreement, China implemented a temporary lift of the retaliatory tariff for some U.S. products, including cotton (HS code 5201). 

    Since then, the purchase of U.S. cotton by China has increased. As shown in Figure 1, Chinese purchases of U.S. cotton in 2020 and 2021 exceeded the number of Chinese purchases for the five-year average between 2015 and 2019. Especially in 2020, the Chinese purchase of U.S. cotton supported cotton prices, and is one of the major reasons for cotton price recovery after the pandemic lockdown implemented in most Asian countries in the earlier months of 2020. The cotton purchases by China in 2021 from the U.S. were lower than what was in 2020, primarily due to the high cotton prices. 

    However, China’s purchase obligation of U.S. agricultural products under the Phase One Trade agreement only lasts until the end of 2021. The Phase One trade agreement stated that the trajectory of increases in U.S. agricultural goods purchased by China will continue in 2022 through 2025. However, producers need to be aware of the uncertainty of China’s future years’ cotton purchase and adjust their risk management strategies accordingly. 

    Figure 1. U.S. Cotton Export to China. Data includes cotton and cotton linters. Data Source: USDA FAS.

    Liu, Yangxuan. “China’s Purchase of U.S. Cotton Increased in 2020 and 2021“. Southern Ag Today 2(3.4). January 13, 2022. Permalink

  • The Rise in Shipping Costs and U.S. Agricultural Exports

    The Rise in Shipping Costs and U.S. Agricultural Exports

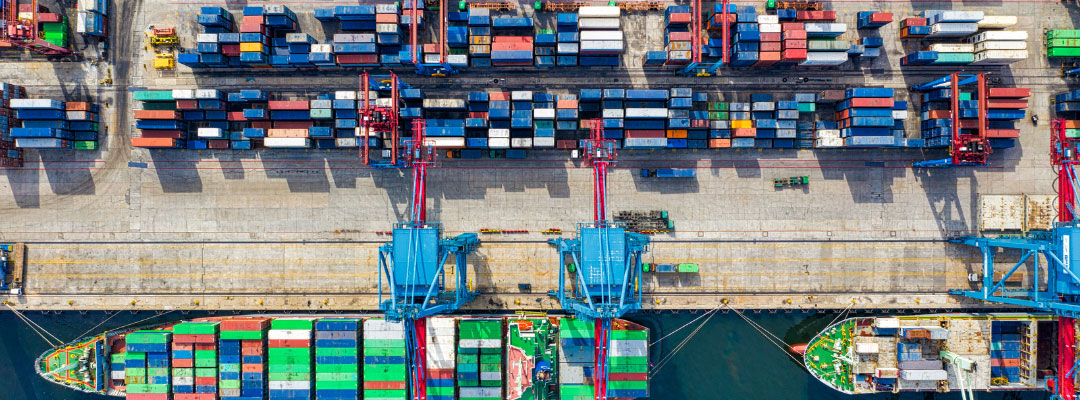
    The recent spikes in freight costs are having a significant impact on global trade. The average cost of shipping a standard large container (a 40-foot-equivalent unit) has surpassed $10,000 in recent months, more than four times higher than prices a year ago. Most of this is due to higher freight rates for routes out of China. For instance, container rates for shipments from Shanghai to New York increased from $2,500 to more than $20,000 in September 2021 (Freightos Data, 2021). To put this in context, an east coast buyer that spent $100,000 last year in freight costs when importing goods from China is now paying almost $1,000,000 in freight costs to import the same items. Given the high demand for containers out of China, there has been a shortage of containers at U.S. ports affecting exports. What does all of this mean for U.S. agricultural exports? Once consequence is that the bulk shipping rates have also increased from $1,000 to over $5,000 in October (now around $3,400) (Trading Economics, 2021), which affects commodities like soybeans and corn. 

    As we begin our research on the effects of shipping rates on U.S. agricultural exports, it is important to first understand the importance of different modes of shipping for U.S. agriculture. The figure shows the share (volume) of U.S. exports across product categories by different shipping modes (bulk, container, and air). To be expected, bulk commodities like wheat, corn, sorghum, and soybeans are most reliant on bulk carriers (more than 90% of all shipments by volume), whereas many products rely on both container and bulk shipping (e.g., poultry). U.S. exports of livestock products like beef, pork, and cheese are heavily reliant on container shipping (90% of all shipments). These products are likely to be the most affected by the recent spike in container rates and shipping costs.

    Share of Commodity Export Volume by Shipping Mode: 2003-2021

    Source: U.S. Department of Commerce, USA Trade® Online

    Sources: 

    Freightos Data (2021) FBX Routes. https://fbx.freightos.com/freight-index/FBX03

    Trading Economics (2021) Baltic Exchange Dry Index. https://tradingeconomics.com/commodity/baltic

    U.S. Department of Commerce (2021). USA Trade® Online. U.S. Census Bureau. https://usatrade.census.gov/


    Muhammad, Andrew, and Michael Adjemian. “The Rise in Shipping Costs and U.S. Agricultural Exports.” Southern Ag Today 1(51.4). December 16, 2021. Permalink

  • Cuba: Potential Market or Continuing Menace?

    Cuba: Potential Market or Continuing Menace?

    Passage of the Trade Sanctions Reform and Export Enhancement Act of 2000 allows U.S. firms to legally export their agricultural products to Cuba and travel there for business purposes. From modest beginnings of $140 million in 2002, U.S. exports grew to $387 million in 2004, peaking at $694 million in 2008. U.S. exports then fell to $456 million in 2012, $215 million in 2016 and $157 million in 2020 (Figure 1). Frozen poultry, soy products and corn have accounted for virtually all U.S. export in recent years. Remittances, exports and tourism are major hard currency earners for Cuba and determine market potential, and the success of U.S. exports. Market potential is hampered by strict U.S. regulations on financing and Cuban requirements to export through the state trading entity, Alimport. Cuba has the potential to be a $1.0 billion market absent government restrictions and more open trade between the two countries. Competition is keen and growing as the U.S. presence in the market has declined.


    Rosson, Parr. “Cuba: Potential Market or Continuing Menace?Southern Ag Today 1(49.4). December 2, 2021. Permalink