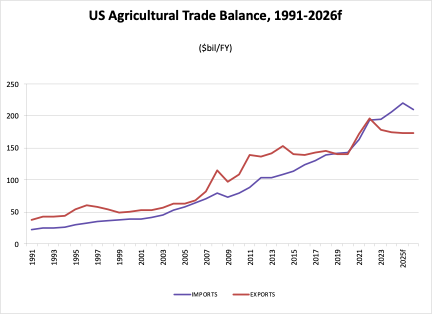
A substantial share of U.S. agricultural production is sold overseas (Figure 1). Exchange rates, therefore, play a central role in export competitiveness and, indirectly, in domestic price prospects. For crops with heavy export exposure, the value of the dollar is not just a macroeconomic headline; it is part of the demand curve faced by Southern producers.
The economic intuition is straightforward. Most globally traded agricultural commodities are priced in U.S. dollars. When the dollar strengthens, foreign buyers must use more local currency to purchase the same dollar-priced commodity, which tends to soften demand at the margin and place downward pressure on prices. When the dollar weakens, U.S. supplies become cheaper in foreign-currency terms, export bids often improve, and U.S. crops become easier to place in global markets. This helps explain why the dollar and broad commodity prices frequently move in opposite directions, even though exchange-rate effects can be offset by other market forces.
In 2025, the exchange-rate environment turned more supportive for U.S. agriculture. After rising 7.1 percent in 2024, the nominal broad dollar index declined 7.2 percent over 2025 (Figure 2). Over the same period, major U.S. agricultural customers experienced notable currency appreciation against the dollar: the euro strengthened 12.6 percent, and the Mexican peso appreciated 12.7 percent (Figure 3). These movements improved foreign purchasing power for U.S. shipments and helped support U.S. crop exports. At the same time, Brazil’s real appreciated by roughly 11 percent, which can tighten Brazilian exporters’ local-currency margins and reduce their ability to price aggressively, all else equal.
Empirical research supports this channel. Shane et al. (2008) find that a 1 percent decline in the trade-weighted dollar is associated with roughly a 0.5 percent increase in the value of U.S. agricultural exports. Exchange rates, however, rarely operate in isolation. Weather outcomes, yields, freight costs, geopolitics, and policy shocks can dominate price formation in the short run (an important lesson from the post-2022 period).
For Southern producers, the dollar’s decline in 2025 is a constructive signal for export-oriented crops because it supports international competitiveness without requiring lower farm-gate prices. The main limitation is timing: exchange-rate effects pass through bids, basis, and contracting practices unevenly, so benefits can vary across regions and marketing windows. Even so, the directional effect is favorable.
If global conditions remain orderly and U.S. interest rates drift lower, the dollar may stay softer and continue to support the export channel; renewed risk aversion, however, could reverse this trend and reintroduce headwinds. For export-dependent Southern crops, monitoring exchange-rate conditions alongside basis and contract timing remains an essential part of marketing discipline.
Figure 1 – Exports account for a large share of output in several U.S. crops
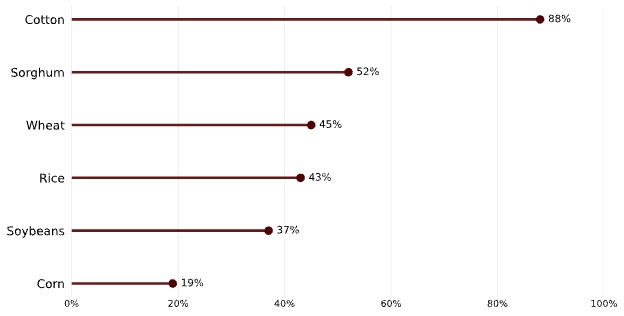
Source: U.S. Department of Agriculture, World Agricultural Supply and Demand Estimates (WASDE), January 2025
Figure 2 – The U.S. dollar declined in 2025
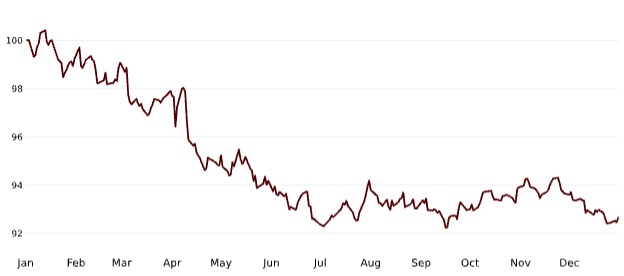
Source: Federal Reserve Bank of St. Louis (FRED): DTWEXBGS
Figure 3 – U.S. dollar weakened against key agricultural trading partners in 2025
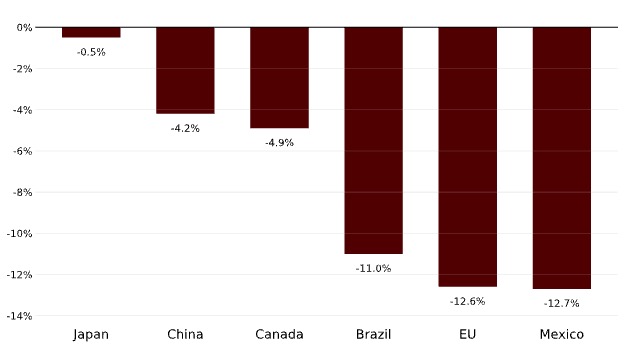
Source: Federal Reserve Bank of St. Louis (FRED): DEXBZUS, DEXCHUS, DEXMXUS, DEXCAUS, DEXJPUS, DEXUSEU. For the Euro, we convert FRED’s DEXUSEU (USD per EUR) to EUR per USD as 1/DEXUSEU
References
Federal Reserve Bank of St. Louis. (2026). Federal Reserve Economic Data. FRED. https://fred.stlouisfed.org/. Accessed January 23, 2026
Shane, M., Roe, T. L., & Somwaru, A. (2008). Exchange rates, foreign income, and U.S. agricultural exports. Agricultural and Resource Economics Review, 37(2). https://ageconsearch.umn.edu/record/45666/files/shane%20-%20current.pdf
U.S. Department of Agriculture, Office of the Chief Economist. (2025, January). World Agricultural Supply and Demand Estimates (WASDE). https://www.usda.gov/oce/commodity/wasde. Accessed January 23, 2026.
Clemets Daglia Calil, Yuri. “A Weaker Dollar Can be Good News for U.S. Crop Exports.” Southern Ag Today 6(5.4). January 29, 2026. Permalink