The decline in U.S. agricultural exports to China has made headlines, most notably due to China’s decision not to purchase U.S. soybeans this season. Soybeans are the largest agricultural export for the United States, and China has traditionally been the top foreign buyer of U.S. soybeans, making this shift particularly significant for American producers. While stories have been mostly about declines in U.S. exports to China, it is important to note that China’s agricultural imports—including related products like forestry, biodiesel, and seafood—are down overall in 2025 compared to 2024, reflecting a broader contraction in trade.
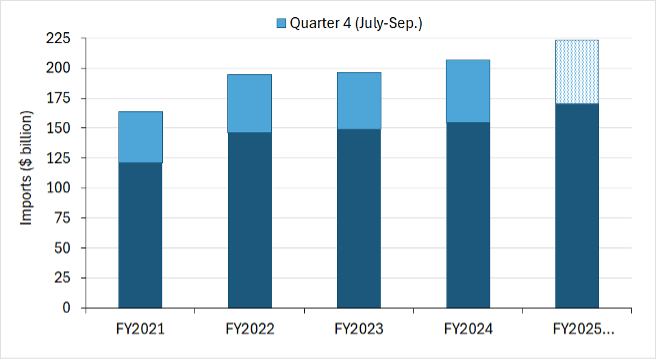
Figure 1 shows China’s total agricultural imports from global sources, including the United States and Brazil. Overall, total imports declined in 2025 compared to 2024, with the most significant drop occurring during the first half of the year. For example, imports in January 2025 fell to approximately $18 billion, down from $22 billion in January 2024. A year-to-date comparison (January–August) shows total imports decreased from $157 billion in 2024 to $145 billion in 2025, a reduction of $12.1 billion, or 7.5%. In terms of quantity or volume, the decline was even steeper—nearly 12% (Trade Data Monitor®, 2025), suggesting that lower import values were not solely driven by price changes but also by reduced quantities.
Although China’s agricultural imports declined overall, imports from the United States experienced a sharper and more sustained drop, beginning later in the year. In January 2025, imports from the U.S. were down by only $220 million compared to the previous year, and in February, they were up by nearly $600 million. However, starting in March, imports consistently fell below 2024 levels. By August, year-to-date China’s imports of U.S. agriculture and related products had dropped from $20 billion in 2024 to $14 billion in 2025, a decline of more than $5 billion, or 27.5%.
Brazil also experienced a decrease in agricultural export sales to China in 2025, though the decline was less severe than that of the United States. As of August 2025, imports from Brazil fell from $36.7 billion in 2024 to $31.2 billion, representing a 15.0% decrease. Month-to-month comparisons show sharper early-year declines: imports were down 51% in January, 43% in February, and 53% in March compared to the same months in 2024. However, beginning in May 2025, import levels from Brazil became more comparable to the previous year and even exceeded 2024 figures in some months. This mid-year rebound suggests that Brazil is benefiting from seasonal demand as well as favorable trade conditions.
Figure 1. China’s total agricultural imports from the World, United States, and Brazil: January 2024 – August 2025
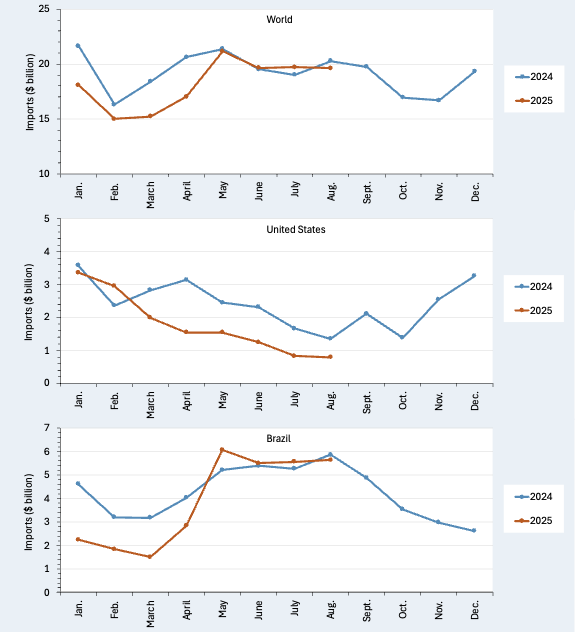
Source: Trade Data Monitor® (2025)
Reference
Trade Data Monitor®. (2025). Retrieved from https://www.tradedatamonitor.com
Muhammad, Andrew. “China’s Agricultural Imports from U.S. and Brazil Decline in 2025 – But the U.S. Faces Sharper Losses.” Southern Ag Today 5(40.4). October 2, 2025. Permalink