In a recent Southern Ag Today article, Muhammad et al. (2025) explored whether Brazil can compete with the U.S. in Japan’s premium beef market. They found Brazil has the volume but questioned the quality. This article digs deeper, showing how advances in genetics and feeding systems may close the gap.
Two key forces shape beef quality: genetics and nutrition. Historically, Brazil relied on grass-fed Nellore cattle (Bos indicus), which yield leaner, less marbled meat. However, change is underway.
Crossbreeding with British breeds such as Angus is increasing rapidly. Angus semen accounted for 49% of all beef semen sales in 2021 (USDA–FAS, 2021). In 2024, British breeds made up a third of sales, driven by demand for marbling and tenderness (ASBIA, 2024).
Meanwhile, Nellore genetics are also improving. Breeding programs have targeted carcass quality for over two decades. In 2024, more than 14.6 million beef cows, 22.3% of the national beef herd (Figure 1), were artificially inseminated (ASBIA, 2025). Over 420,000 purebred Zebu calves were registered that year, reflecting long-term investments in breeding (ABCZ, 2024).
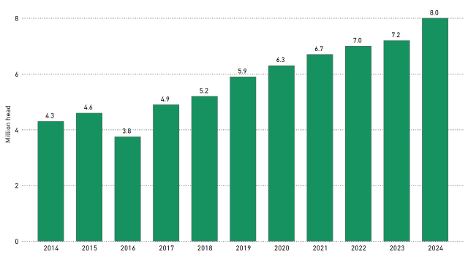
Nutritional gains have kept pace with advancements in genetics. Brazil rapidly expanded its feedlot systems, especially in the central-west and southeast regions. These enable grain finishing, improving marbling and consistency, key traits for markets like Japan. In 2024, Brazil had over 8 million head in feedlots (Figure 2), representing a 25% increase in five years (DSM-Firmenich, 2024). In 2023, feedlot-finished cattle made up 21.3% of all beef slaughter, underscoring the growing role of confinement (CNA, 2024). Advances in mineral nutrition, feed conversion, and precision feeding have further improved carcass yield and quality.
Brazil is no longer just a volume player. Upgrades in genetics, nutrition, and feedlot systems are reshaping its beef industry. It’s increasingly meeting premium standards. The U.S. still leads, but Brazil is narrowing the gap on quality.
Figure 1: Number and Percentage of Beef-Breeding Cows Inseminated in Brazil 2014-2024
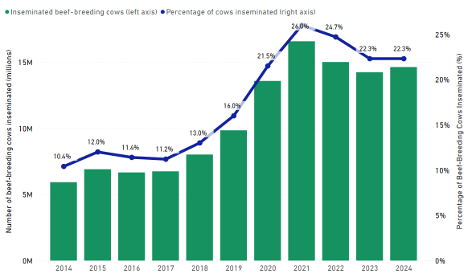
Figure 2. Cattle on Feedlots in Brazil 2014-2024
Referneces
ABCZ – Associação Brasileira dos Criadores de Zebu. (2024). Estatísticas do Registro Genealógico – RGN. https://www.abcz.org.br/produtos-e-servicos/area-tecnica/registro-genealogico/estatisticas
ASBIA – Associação Brasileira de Inseminação Artificial. (2024). Index ASBIA 2024 – Beef cattle semen sales by breed. https://asbia.org.br/index-asbia/
ASBIA – Associação Brasileira de Inseminação Artificial. (2025). Anuário ASBIA 2025. https://asbia.org.br/wp-content/uploads/Anuario/ASBIA_anuario_2025.pdf
CNA – Confederação da Agricultura e Pecuária do Brasil. (2024, August 5). Expectativa de retorno do confinamento em 2024 frente ao cenário de custos [Technical report]. https://www.cnabrasil.org.br/publicacoes/expectativa-de-retorno-do-confinamento-em-2024-frente-ao-cenario-de-custos
DSM-Firmenich. (2024). Panorama do Confinamento 2024 [Unpublished report].
Muhammad, A., Martinez, C., & Hossen, M. D. (2025, March 6). Market showdown: U.S. beef faces new challenges in Japan amid Brazilian reentry. Southern Ag Today, 5(10.4). https://southernagtoday.org/2025/03/06/market-showdown-u-s-beef-faces-new-challenges-in-japan-amid-brazilian-reentry/
U.S. Department of Agriculture – Foreign Agricultural Service. (2021). The Brazilian bovine genetics market and U.S. exports [PDF]. https://usdabrazil.org.br/wp-content/uploads/2021/03/The-Brazilian-Bovine-Genetics-Market-and-US-Exports_Brasilia_Brazil_03-01-2021-1.pdf
Moreira, Felipe Martins, and Yuri Calil. “Will Brazil Close the Quality Gap with U.S. Beef in Japan?” Southern Ag Today 5(30.4). July 24, 2025. Permalink