The global rice market in the last two years has been a rollercoaster driven mostly by India’s export restrictions and, since October of last year, by its massive rice crop. India’s production performance has been remarkable, breaking a new production record every year for the last ten years. USDA (2025a) estimates that production in marketing year 2024 (still in progress in India with the smaller rabi crop) will reach 147 million metric tons (MMT), milled basis, and exports could go as high as 24.5 MMT, significantly above the record 22 MMT exported in 2021.
Indonesia is also contributing to the bearish tone of the global rice market. While total rice consumption and production have followed a downward trend in the last decade, consumption rebounded in 2023 and 2024 while production kept falling, which created a surge in imports. Indonesia was the second-largest rice importer in 2023 and the largest in 2024, when imports reached 4.7 MMT. Weather is supporting the growth of production in 2025, which, together with ample stocks bought at competitive prices, suggests that Indonesia will need less than 1 MMT of imports this year (USDA, 2025a).
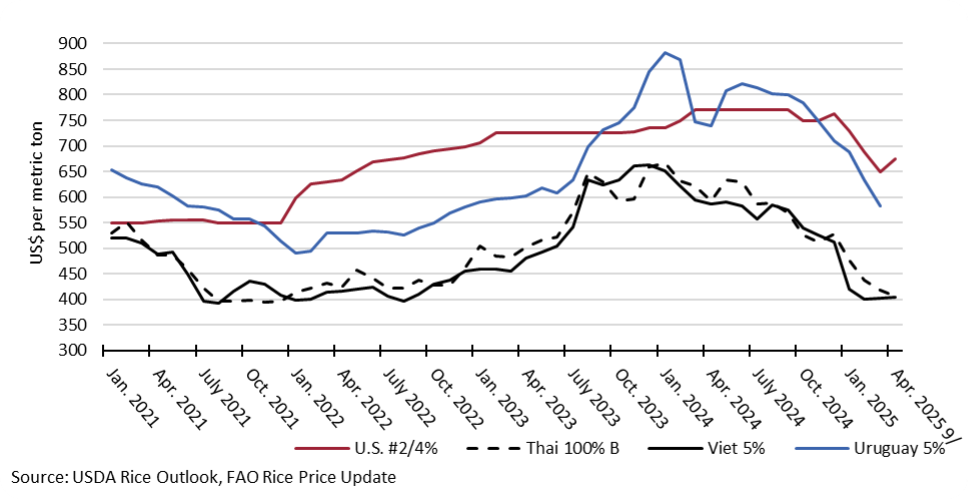
From the above, we can infer why long-grain rice prices have been under pressure since last October (Figure 1). Export prices out of Thailand and Vietnam have decreased by over $160/MT or 29% in the last six months, although they seem to have found a floor at around $400/MT in the last few weeks. Export prices out of Mercosur (Argentina, Brazil, Paraguay, and Uruguay) have also decreased sharply; for example, the export price of Uruguayan 5% long-grain rice averaged $582/MT in March relative to $800/MT in October, according to FAO (2025). The export price of U.S. long-grain #2/4% decreased but to a smaller extent (12%) over the last six months and seems to have found a floor at around $650/MT. Interestingly, amid decreasing long-grain prices across the board, U.S. export prices remain more resilient, even when the low milling quality of the U.S. crop has been a significant concern. Of particular concern for the milling industry is the fact that U.S farm prices have remained mostly unchanged: USDA average farm price decreased only 3% from $14.5/cwt in August to $4.2/cwt in April (USDA, 2025b). Lower export prices and steady domestic paddy prices put the squeeze on milling margins.
Nine months into the 2024/25 marketing year, the U.S. has exported 2.29 MMT (paddy basis) of long-grain rice, a 21% smaller amount relative to last year, driven by a decrease in paddy exports to all major markets (Mexico, Central America, and Colombia). Paddy rice from Mercosur continues to gain market share in core U.S. paddy markets. Exports of long-grain milled rice are at par with the previous year’s performance, thanks to the growth of exports to Iraq, which helps offset a sizable market loss in Haiti. U.S. exports will face higher competition from Mercosur in 2025, driven by a significant increase in production in Brazil and, to a lesser extent, Argentina, Paraguay, and Uruguay, which will result in more rice available for export.
Given the global and regional situation described above, what can we expect for the upcoming marketing year? USDA’s March 2025 prospective plantings (USDA, 2025c) suggest a similar crop than last year (2.24 million acres in 2025 relative to 2.28 million in 2024). Excessive rains in Arkansas early April have complicated crop establishment and caused significant infrastructure damage. Despite that, as of May 4th planting progress was almost 80%, but with a mix of situations depending on location (UADA, 2025a). The USDA projects the 2025 long-grain rice production at 167.2 million cwt, around 3% below the 2024 crop, and exports at 68 million cwt, slightly higher than in 2024. As discussed earlier, lower export prices have not caught up with farm prices so far, but a bearish global market will indicate that farm prices will adjust downward. For example, FAPRI (2025) projects that long-grain farm prices will drop below the reference price in 2025/26 to $13.28/cwt, while USDA’s WASDE report (USDA, 2025b) estimates an average farm price of $12/cwt for long grain rice. Looking at the University of Arkansas Rice Enterprise Budgets (UADA, 2025b) with those farm prices, the picture that emerges is worrisome, as all budgets yield negative returns above operating costs.
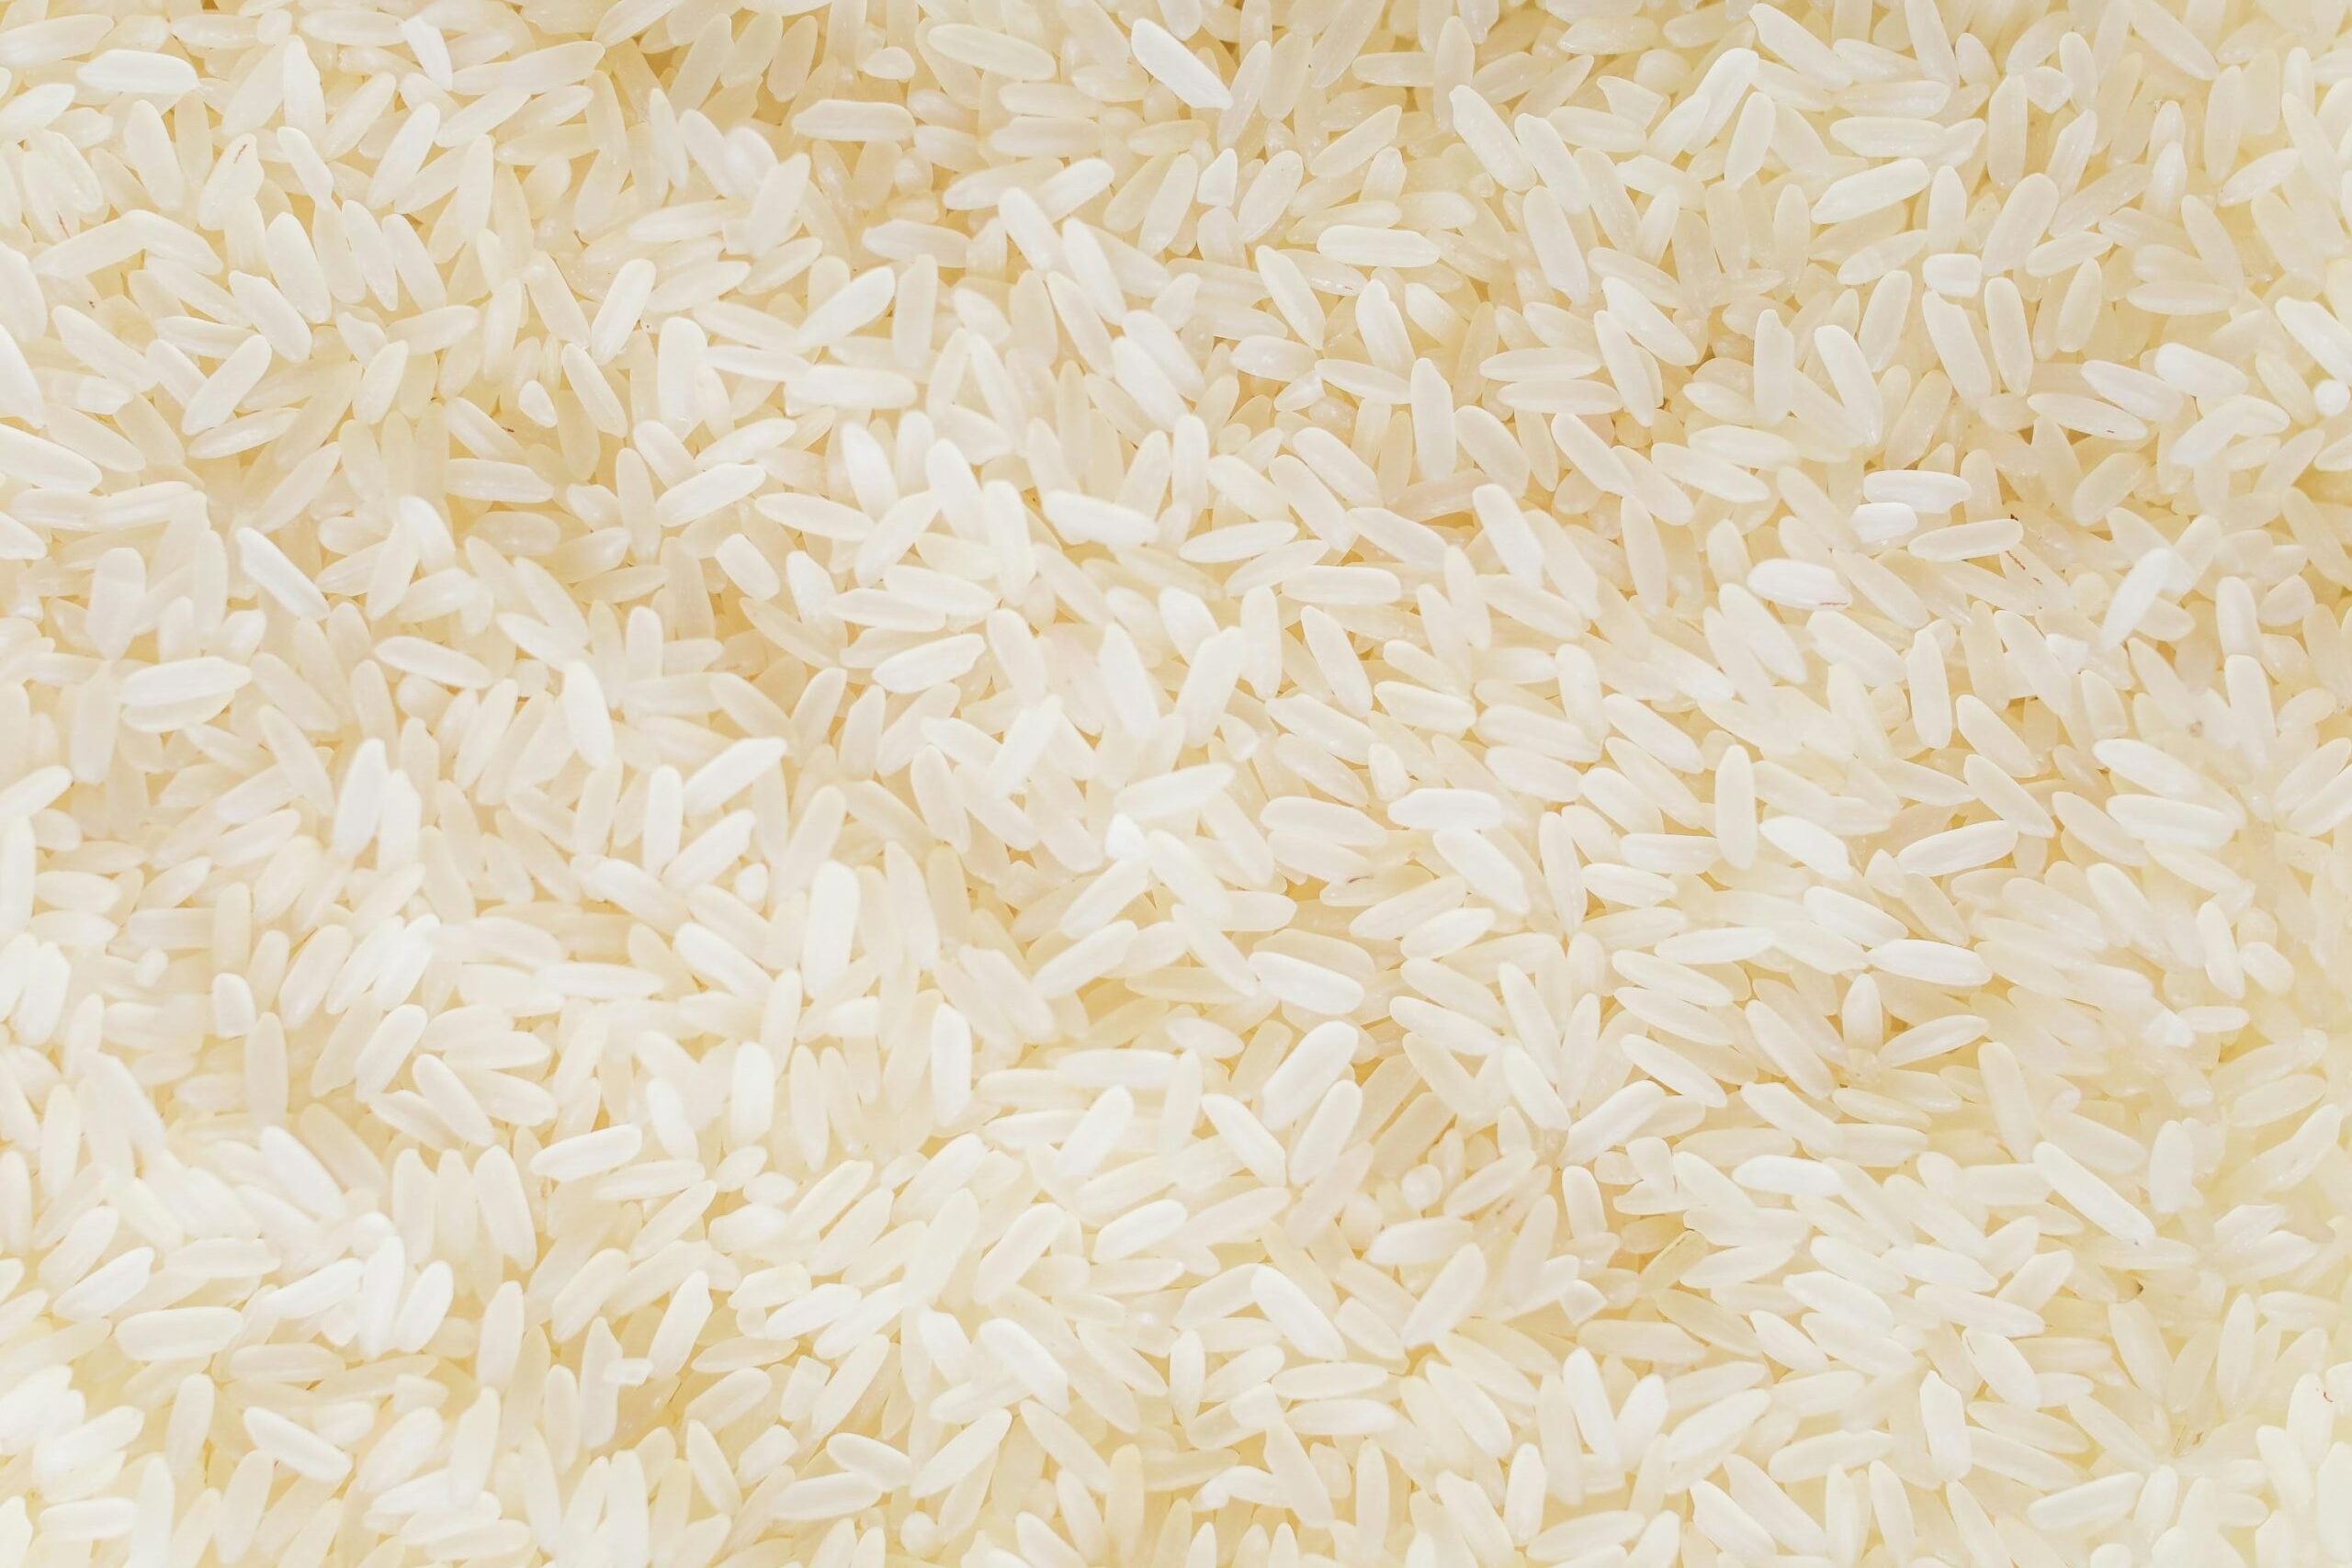
Figure 1. Monthly average export price of long-grain rice from selected exporters.
References
U.S. Department of Agriculture (USDA), 2025a. Production, Supply, and Distribution. Available at https://apps.fas.usda.gov/psdonline/app/index.html#/app/home.
FAO, 2025. Rice Price Update. April 2025. Available at https://www.fao.org/markets-and-trade/commodities/rice/fao-rice-price-update/en/.
USDA, 2025b. USDA WASDE Report. May 2025. Available at https://www.usda.gov/oce/commodity/wasde.
USDA 2025c. USDA Prospective Plantings. March 2025. Available at https://usda.library.cornell.edu/concern/publications/x633f100h.
University of Arkansas Division of Agriculture (UADA), 2025a. Arkansas Rice Update 5-9-25.https://arkansascrops.uada.edu/posts/crops/rice/arkansas-rice-update-5-9-25.aspx
UADA, 2025b. 2025 Arkansas Crop Enterprise Budgets. Available at https://www.uaex.uada.edu/farm-ranch/economics-marketing/farm-planning/budgets/crop-budgets.aspx.
USDA, 2025d. Rice Outlook. April 2025. Available at https://www.ers.usda.gov/publications/pub-details/?pubid=108546.
Food and Agricultural Policy Research Institute (FAPRI), 2025. U.S. Agricultural Market Outlook. Available at https://fapri.missouri.edu/wp-content/uploads/2025/04/2025-Baseline-Outlook.pdf.
Durand-Morat, Alvaro. “Global Market Prospects for U.S. Long-grain Rice for the Upcoming Marketing Year.” Southern Ag Today 5(20.4). May 15, 2025. Permalink