Brazilian beef was first banned in Japan in 2012 due to concerns over Bovine Spongiform Encephalopathy (BSE), also known as Mad Cow Disease. Brazil is currently in talks with Japan to begin beef shipments once again. Although Japanese imports of Brazilian beef were negligible prior to 2012, the possible reentry of Brazilian beef into the Japanese market could pose a significant challenge to U.S. beef exports.
The importance of Japan to global beef trade and U.S. beef exports cannot be overstated. Japan is the third largest beef importing country in the world and the second largest market for the U.S. In 2024, U.S. beef exports reached $10.5 billion. That year, exports to Japan accounted for 18% of the total (USDA, 2025a, 2025b). While Japan is important to U.S. export disappearance, the U.S. is especially important to Japan as its leading supplier. In 2024, for instance, Japan imported $1.8 billion worth of U.S. beef. This was 43% of Japan’s total beef imports, exceeding imports from Australia ($1.7 billion and 39%), and significantly larger than countries such as Canada, New Zealand, and Mexico. Despite the current strong position of U.S. beef in Japan, this could be challenged by the reentry of Brazilian beef into the Japanese market.
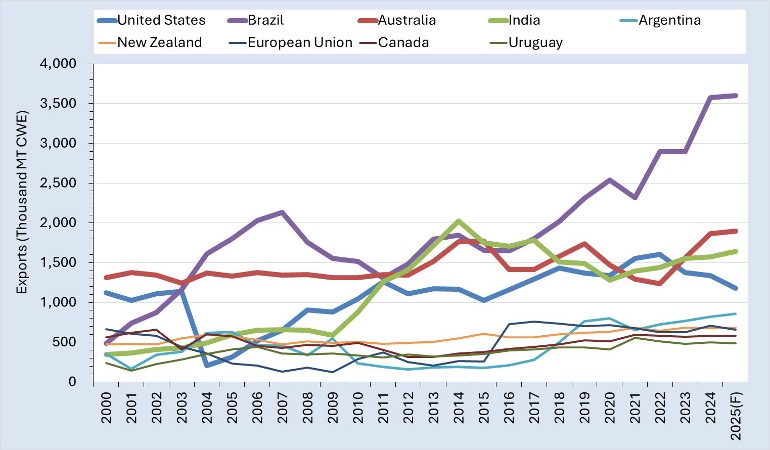
Around the time of the U.S.-China trade war in 2018, Brazil emerged as the leading global beef exporter, surpassing the U.S., Australia, and India (Figure 1). The rise of Brazil as a major beef exporter is largely due to increased demand in China. (https://southernagtoday.org/2023/01/12/chinas-import-of-u-s-beef-continues-to-increase-but-how-does-the-u-s-compare-to-other-competing-countries/). As China emerged as the leading beef importing country (almost $14 billion in 2024), Brazil became its leading supplier accounting for 45% of total Chinese imports in 2024, far exceeding other exporting countries.
With exports already exceeding those of major exporters such as the U.S. and Australia, does Brazil have the capacity to gain a significant share of the Japanese foreign beef market? In 2024, cattle and beef production in Brazil was based on 192.5 million head of cattle (including all beef and dairy cows and calves). Over the past couple of years, Brazil’s national cow herd has been liquidating, leading to higher supplies of slaughter cattle and total production. Last year, Brazil’s national herd was reduced by 2% and was expected to continue shrinking midway through 2025 (Aquino, 2024). Despite the shrinking herd, Brazil has maintained its share of world trade. Given the expectation of rebuilding, Brazil’s herd could rebuild at a higher pace to capitalize on the new demand from the Japanese market.
Future Japanese demand will be based on a combination of quality and quantity. Over the last few decades, Japanese beef consumers have trended more towards the preferences of the typical U.S. beef consumer. Products like ground beef, steaks, burgers, and fajitas have become increasingly popular in Japan. The key question is whether Brazil can match the quality of U.S. beef in Japan. Quantity is a lesser obstacle for Brazil with this potential market opportunity.
Figure 1. Beef and Veal Exports (Top Countries): 2000 – 2025(F)
References
Aquino, Camila. (2024). Livestock and Products Semi-annual: Brazil. Report Number: BR2024-0001. USDA, Foreign Agricultural Service.
USDA. (2025a). Production, Supply, and Distribution Online (PSD Online). Foreign Agricultural Service. https://apps.fas.usda.gov/psdonline/app/index.html#/app/home
USDA. (2025b). Global Agricultural Trade System (GATS). Foreign Agricultural Service. https://apps.fas.usda.gov/gats/default.aspx
Muhammad, Andrew, Charles Martinez, and Md Deluair Hossen. “Market Showdown: U.S. Beef Faces New Challenges in Japan Amid Brazilian Reentry.” Southern Ag Today 5(10.4). March 6, 2025. Permalink