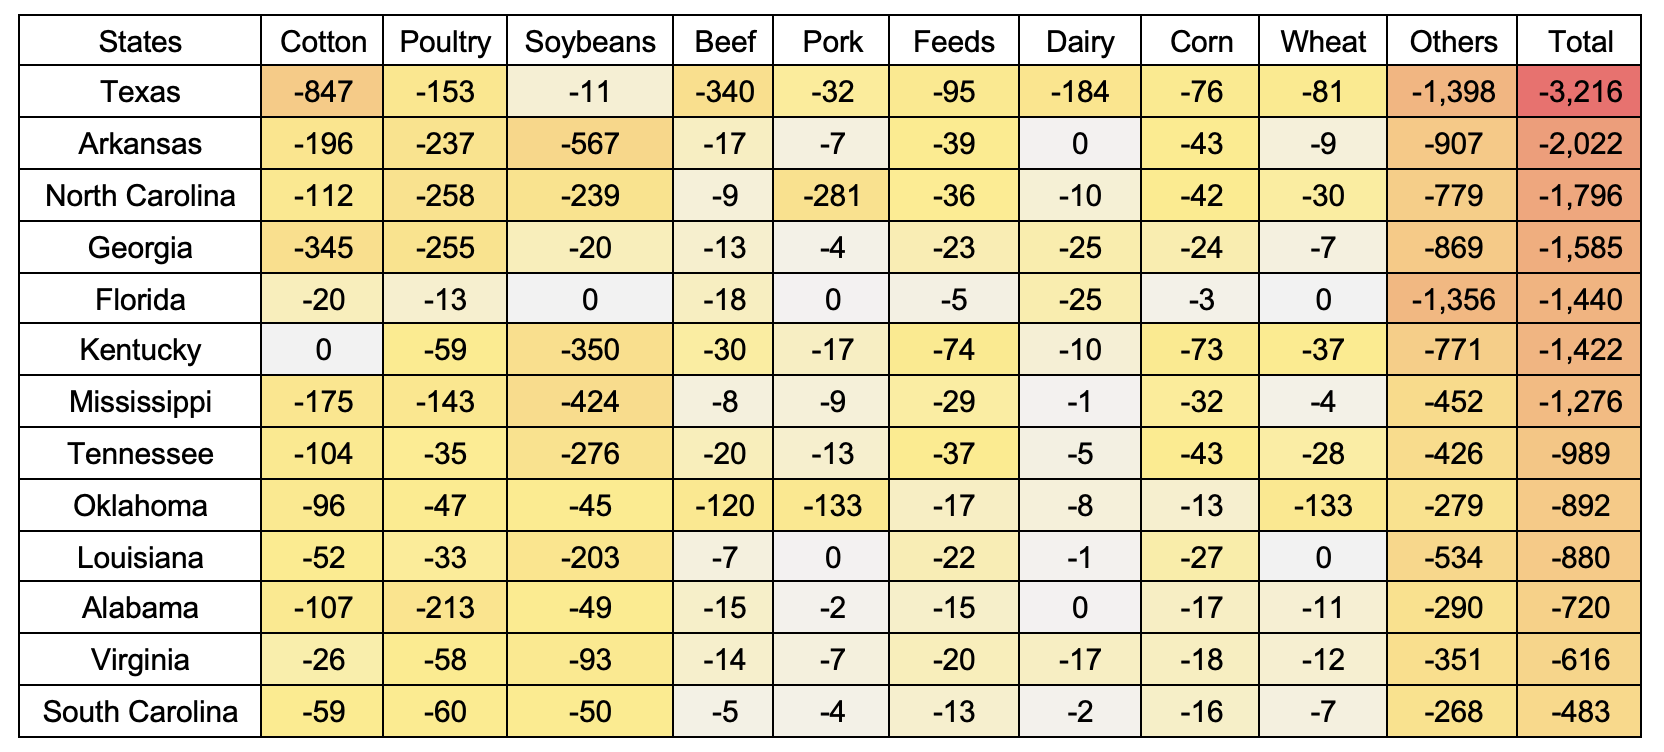
Category: Trade

  • Angola: U.S. Chicken Exports Facing Increasing Competition in this Leading Market 

    Angola: U.S. Chicken Exports Facing Increasing Competition in this Leading Market 

    The U.S. is the largest chicken meat producing country in the world. According to the U.S. Department of Agriculture, production in 2022 was almost 21 million metric tons (MT) (ready to cook equivalent), with the next largest country (Brazil) producing around 14.5 million MT. While most of this production is consumed domestically, between 10% and 20% of total production is exported each year (USDA, 2023a). In 2022, U.S. exports of poultry products – including chicken, turkey, and other fowl – accounted for $6 billion in global sales, making poultry products a top ten U.S. agricultural export. The leading poultry export for the U.S. is frozen chicken leg quarters (henceforth leg quarters), which accounted for $1.9 billion in export sales in 2022, nearly a third of all U.S. poultry exports (USDA, 2023b).

    Important to U.S. poultry exports is the country of Angola, which is located on the western Atlantic coast in the South African region. In 2022, Angola was the leading foreign destination for U.S. leg quarters in terms of value ($219 million) and the second largest foreign market in terms of volume (168 thousand MT). However, U.S. leg quarter exports to Angol have varied significantly over the last decade (See Figure 1), decreasing from a peak in 2014 ($243 million) to only $83 million in 2016. After 2016, U.S. exports recovered but immediately fell again during the pandemic in 2020. Since 2020, U.S. leg quarter exports to Angola significantly increased to $219 million in 2022. However, as Figure 1 shows, this was mostly due to higher chicken prices.

    Unfortunately, the U.S. is facing increasing competition in Angola from rising domestic production as well as competition from Brazil. In 2022, for instance, Angola’s imports of frozen chicken cuts (including leg quarters, other cuts, and offal) from the U.S. were up 23% (volume) in 2022, whereas imports from Brazil were up 32% (UN Comtrade, 2023). Despite U.S. leg quarter exports to all destinations being down by only 8% in terms of volume in 2023 (year-to-date as of August), exports to Angola were down 25% (USDA, 2023b). Figure 2 shows Angola’s frozen chicken cut imports in 2021 ($201 million) by exporting source. The U.S. was the leading supplier, accounting for 63%; Brazil accounted for 22%. 2023 year-to-date data for the U.S., as well as 2022 data for Angola, suggest that Brazil will likely account for more than a third of total imports by the end of 2023, while the U.S. share will likely decrease to slightly more than 50%.

    Figure 1. U.S. frozen chicken leg quarter exports to Angola: 2010 – 2022

    Source: U.S. Department of Agriculture (USDA, 2023b).

    Figure 2. Angola frozen chicken cuts imports (including leg quarters, other cuts, and offal) in 2021 by Source ($201 million)

    Source: Observatory of Economic Complexity (OEC) (2023).

    References

    Observatory of Economic Complexity (OEC). 2023. https://oec.world/en

    United Nations Comtrade Database (UN Comtrade). 2023. https://comtradeplus.un.org/

    U.S. Department of Agriculture (USDA). 2023a. Livestock and Poultry: World Markets and Trade. Foreign Agricultural Service, Washington, DC.

    U.S. Department of Agriculture (USDA). 2023b. Global Agricultural Trade System (GATS). Foreign Agricultural Service, Washington, DC. https://apps.fas.usda.gov/gats/default.aspx


    Muhammad, Andrew, and Md Deluair Hossen. “Angola: U.S. Chicken Exports Facing Increasing Competition in this Leading Market.Southern Ag Today 3(44.4). November 2, 2023. Permalink

  • Can Chinese Demand for U.S. Hides and Skins Recover?

    Can Chinese Demand for U.S. Hides and Skins Recover?

    Hides in the leather business typically refer to the skin of large animals while skins typically refer to smaller livestock. Raw cattle hides are generally grouped with offal items when discussing total animal value, but hides and skins are an important contributor to the total value of most cattle as the leather is commonly used for belts, shoes, wallets, jackets, car seats and interior, etc. Hide selections are grouped in several ways but are typically based on being branded or native (i.e., not branded), steers and heifers versus cows, dairy cows versus beef breeds, hides from mature bulls, and light versus heavy hides. The value of the hides is further based on the quantity of defects they contain as it relates to holes, cuts, lesions, or grain defects, often caused by injuries, horns, flies, ticks, grubs, and poor skinning and fleshing practices.

    Supplying its massive leather production industry, China has been the largest importer of hides and skins for both the U.S. and the world. However, imports over the past few years have been declining. In 2013, raw cattle hides and skins were a major agricultural export for the U.S., reaching $2.3 billion, with China accounting for 63%. However, as of 2022, U.S. exports were only $876 million, and it appears that exports in 2023 will be even lower (USDA, 2023). At first glance, it would not be unreasonable to think that raw hides and skins were affected by the U.S. trade war with China. Clearly, the tariffs the Chinese government imposed on U.S. hides and skins, on top of the tariffs that the U.S. government imposed on finished leather products resulted in direct and indirect negative impacts on U.S. exports of hides and skins to China. However, taking a longer view of the data, U.S. exports to China have been declining for nearly a decade.

    Figure 1 show Chinese imports of raw cattle hides and skins from the U.S., Australia, Canada, and all remaining countries combined (rest of world) since 2015. Note that Chinese imports exceeded $2.5 billion in 2015 but decreased to around $1.8 billion in 2016 and 2017. While imports fell even more in 2018 and 2019 during the trade war, this appears to be a part of an overall declining trend. For instance, imports from the U.S. fell by 66% during this period, but imports from Australia and the Rest of World also fell by 71% and 68%, respectively. According to USDA (2018), a combination of both internal and external factors has contributed to this reduced demand and has increased the cost of producing leather domestically. These factors include growing competition from synthetic materials, rising labor costs, and stricter environmental regulations. Although modest, import increases in 2021 and 2022 relative to 2020 may be a sign of a possible recovery.

    Figure 1. Chinese imports of raw cattle hides and skins: 2015-2022

    Note: Raw cattle hides and skins are defined according to the Harmonized System Classification (HS) HS 4101 raw hides and skins of bovine and equine animals (not tanned, parchment-dressed or further prepared)
    Source: Trade Data Monitor® (2023)

    References

    U.S. Department of Agriculture (USDA). 2018. Chinese Demand for Imported Hides Beginning to Weaken. Foreign Agricultural Service GAIN Report: CH186027.

    U.S. Department of Agriculture (USDA). 2023. Global Agricultural Trade System. Foreign Agricultural Service. https://apps.fas.usda.gov/gats/default.aspx


    Muhammad, Andrew, and Andrew Giffith. “Can Chinese Demand for U.S. Hides and Skins Recover?” Southern Ag Today 3(42.4). October 19, 2023. Permalink

    Photo by Pixabay: https://www.pexels.com/photo/colors-belt-skin-belts-65280/

  • U.S. Agricultural Imports are Expected to Surpass Exports Post Covid and Beyond

    U.S. Agricultural Imports are Expected to Surpass Exports Post Covid and Beyond

    Since the beginning of the 21st century, the United States has experienced an agricultural trade surplus in 20 of the last 22 years, with 2019 and 2022 being the only years where imports surpassed exports.  U.S. agricultural imports have increased from $43.1 to $199.3 billion from 2001 to 2022, respectively. This increase of U.S. agricultural imports was accentuated during the Covid-19 pandemic years as total imports increased by 40 percent in value and 13.1 percent in volume between 2019 and 2022 (Tables 1 and 2).  The rather large difference between value and volume increases shows that there was a price increase in most of the commodities mainly due to supply chain issues and inflation during COVID-19. The largest increase in value of the top five US agricultural imports from 2019 to 2022 are oilseeds and products, grain and feeds, and livestock and meats with 105.5, 54.5, and 44.6 percent increases, respectively.  Moreover, in terms of volume, livestock and meats, other and horticultural products have the largest increase with 35.5, 21.9 and 14.1 percent respectively.

    Figure 1.  Value of U.S. Agricultural Imports, Billion Dollars

    Table 1. Value of U.S. Agricultural Imports, Thousand Dollars

    Table 2. Volume of U.S. Agricultural Imports, Metric Tons

    The latest USDA Outlook for U.S. Agricultural Trade report (August 2023) forecasted imports for 2023 at $196.5 billion, down $1.5 billion from the May forecast mainly due to easing import prices throughout FY 2023.  The year-over-year imports from January to July show an overall decrease of 1.4 percent in value, but a 4.4 percent increase in volume confirming that prices of importing commodities are easing (Tables 1 and 2).  The value of the top five U.S. agricultural imports year-over-year has gone down except for grains and feeds.  On the other hand, the volume of all U.S. agricultural imports has gone up except for sugar and tropical products. Moreover, forecasted imports for 2024 are expected to be $199.5 billion, $3 billion above 2023, and virtually the same as 2022 imports.

    ReferencesU.S. Department of Agriculture (USDA).  “Outlook for U.S. Agricultural Trade: August 2023.”  AES-125, August 31, 2023. https://www.ers.usda.gov/webdocs/outlooks/107311/aes-125.pdf?v=1152.5

    Ribera, Luis. “U.S. Agricultural Imports are Expected to Surpass Exports Post Covid and Beyond.Southern Ag Today 3(40.4). October 5, 2023. Permalink

  • U.S. Agricultural Export Values are Expected to Decrease After a 7-Year Expansion Run

    U.S. Agricultural Export Values are Expected to Decrease After a 7-Year Expansion Run

    Trade is very important to production agriculture in the United States. Over the last 12 years, 2011 to 2022, agricultural exports have accounted for over one-third of US gross farm income, 33.9 percent (USDA ERS and FAS).  US agricultural exports have experienced a 7-year expansion run from 2015 to 2022, going from $137.2 billion to $195.9 billion. This increase of US agricultural exports was accentuated during the Covid-19 pandemic years as total exports increased by 38.8 percent in value and 8.1 percent in volume between 2019 and 2022 (Tables 1 and 2).  The rather large difference between value and volume increases shows that there was a price increase in most of the commodities which can be attributed partially to an increase in quantity demanded of US agricultural products, but also to inflation experienced worldwide as well as the Russia-Ukraine war. The largest increase in value of the top five US agricultural exports from 2019 to 2022 are oilseeds and products, grain and feeds, and dairy and products with 65.2, 64.5, and 61.4 percent increases, respectively.  Moreover, in terms of volume, grains and feeds, poultry and products, and oilseeds and products have the largest increase with 12.7, 6.6, and 4.6 percent respectively.

    Figure 1.  Value of US Agricultural Exports, Billion Dollars

    Table 1. Value of U.S. Agricultural Exports, Thousand Dollars

    Table 2. Volume of U.S. Agricultural Exports, Metric Tons

    The latest USDA Outlook for U.S. Agricultural Trade report (August 2023) forecasted exports for 2023 at $177.5 billion, down $3.5 billion from the May forecast largely due to decreases in corn, wheat and tree nuts exports.  The year-over-year exports from January to July show an overall decrease of 11.5 percent in value and 17.7 percent decrease in volume (Tables 1 and 2).  In both, value and volume, the largest decreases are in grains and feeds with 22.6 and 27.5 percent, respectively.  The main reason for this decline is competition from Brazil, EU, and Russia.   Moreover, forecasted exports for 2024 are expected to be $172 billion, $5.5 billion below 2023, and $23.9 billion below 2022 exports.

    References

    U.S. Department of Agriculture (USDA).  “Outlook for U.S. Agricultural Trade: August 2023.”  AES-125, August 31, 2023. https://www.ers.usda.gov/webdocs/outlooks/107311/aes-125.pdf?v=1152.5

  • The Rise and Fall of U.S. Chicken Feet in China: A Story of Bird Flu and Trade Bans

    The Rise and Fall of U.S. Chicken Feet in China: A Story of Bird Flu and Trade Bans

    According to the U.S. Department of Agriculture (USDA, 2023), U.S. producers shipped nearly $6.0 billion in poultry meat and related products (excluding eggs) to over 130 countries in 2022. China has emerged as the second largest destination for U.S. poultry exports, increasing from only $10 million in 2019 to a record $1.1 billion in 2022. This is a remarkable increase of more than 10,000% in just 4 years. Recall that China banned all U.S. poultry in January 2015 due to a highly pathogenic avian influenza (HPAI) (i.e., bird flu) outbreak in December 2014. Despite the U.S. being free of the disease by August 2017, the ban was not lifted until November 2019 (USDA, 2019). Since that time, however, the recovery of U.S. poultry in the Chinese market has been phenomenal. What is interesting is that this recovery has been driven by one product, frozen chicken feet (or paws), which are apparently preferred by Chinese consumers for their unique large size and consistent high quality (Baych, 2022). In 2022, frozen chicken feet accounted for more than 85% of all U.S. poultry exported to China.

    Figure 1 shows China’s frozen chicken feet imports from all major supplying countries. In 2010, frozen chicken feet imports in China were $571 million, and averaged only $350 million annually from 2010 to 2018. Since that time, however, China’s frozen chicken feet imports increased to $2.6 billion by 2022, primarily driven by imports from the U.S. In 2022, the U.S. accounted for 43% of China’s frozen chicken feet imports, followed by Brazil (20%), Russia (11%), Argentina (5%), and Chile (3%).

    Unfortunately, recent bans due to HPAI outbreaks in 2022 are limiting U.S. exports from certain states in 2023. This is occurring at a time when the Chinese are paying significantly more for imported frozen chicken feet. For example, import prices for frozen chicken feet from the U.S. were around $1.00/kg in 2014. In 2023, U.S. prices averaged between $5.00kg and $6.00/kg. Current restrictions are hurting overall U.S. sales to China and appears to be benefiting Brazil and Russia. As of June 2023, U.S. frozen chicken feet sales to China were down by 35% in terms of value and 51% in terms of volume. However, imports from Brazil and Russia were up, particularly in terms of value by 77% and 42%, respectively (See Table 1). The lifting of the HPAI ban in 2019 and the enforcing of bans on certain states in 2023 have given and taken away, respectively.

    Figure 1. China’s Frozen Chicken Feet Imports by Country of Origin: 2010-2023

    Source: Trade Data Monitor® (China Customs) (2023)

    Table 1. China’s Frozen Chicken Feet Imports from Brazil, Russia, and the United States: 2022 and 2023 Year-to-Date (January-June) Comparisons

    Jan-June 2022Jan-June 2023% Change
     Brazil 
    $198.3 million$351.8 million77.4%
    81.9 TMT86.6 TMT5.7%
     Russia 
    $106.4 million$150.9 million41.8%
    37.4 TMT39.1 TMT4.4%
     United States 
    $550.4 million$358.3 million-34.9%
    133.7 TMT65.2 TMT-51.2%
    Note: TMT is Thousand Metric Tons.
    Source: Trade Data Monitor® (China Customs) (2023)

    References

    Baych, A. 2022. Poultry and Products Annual Country: People’s Republic of China. USDA GAIN Report Number: CH2022-0100. Foreign Agricultural Service, Washington, DC.

    U.S. Department of Agriculture (USDA). 2019. American Poultry Farmers Regain Access to China. USDA Press Release No. 0176.19. https://www.usda.gov/media/press-releases/2019/11/14/american-poultry-farmers-regain-access-china

    U.S. Department of Agriculture (USDA). 2023. Global Agricultural Trade System (GATS). Foreign Agricultural Service, Washington, DC.