Category: Trade

  • U.S. Fresh Produce Availability

    U.S. Fresh Produce Availability

    The United States had a total supply of 105.51 billion pounds of fresh produce in 2022. Fruit availability in the United States totaled 42.26 billion pounds in 2022, or 40.1 percent of fresh produce. The total supply of fresh fruit can be split into U.S. production and imports which are, respectively, 19.11 and 23.15 billion pounds.  Fresh vegetables are also broken into production and imports, some products also include beginning stocks which contributed an additional 1.30 billion pounds in 2022. Vegetable production totaled 42.92 billion pounds with imports at 20.32 billion.

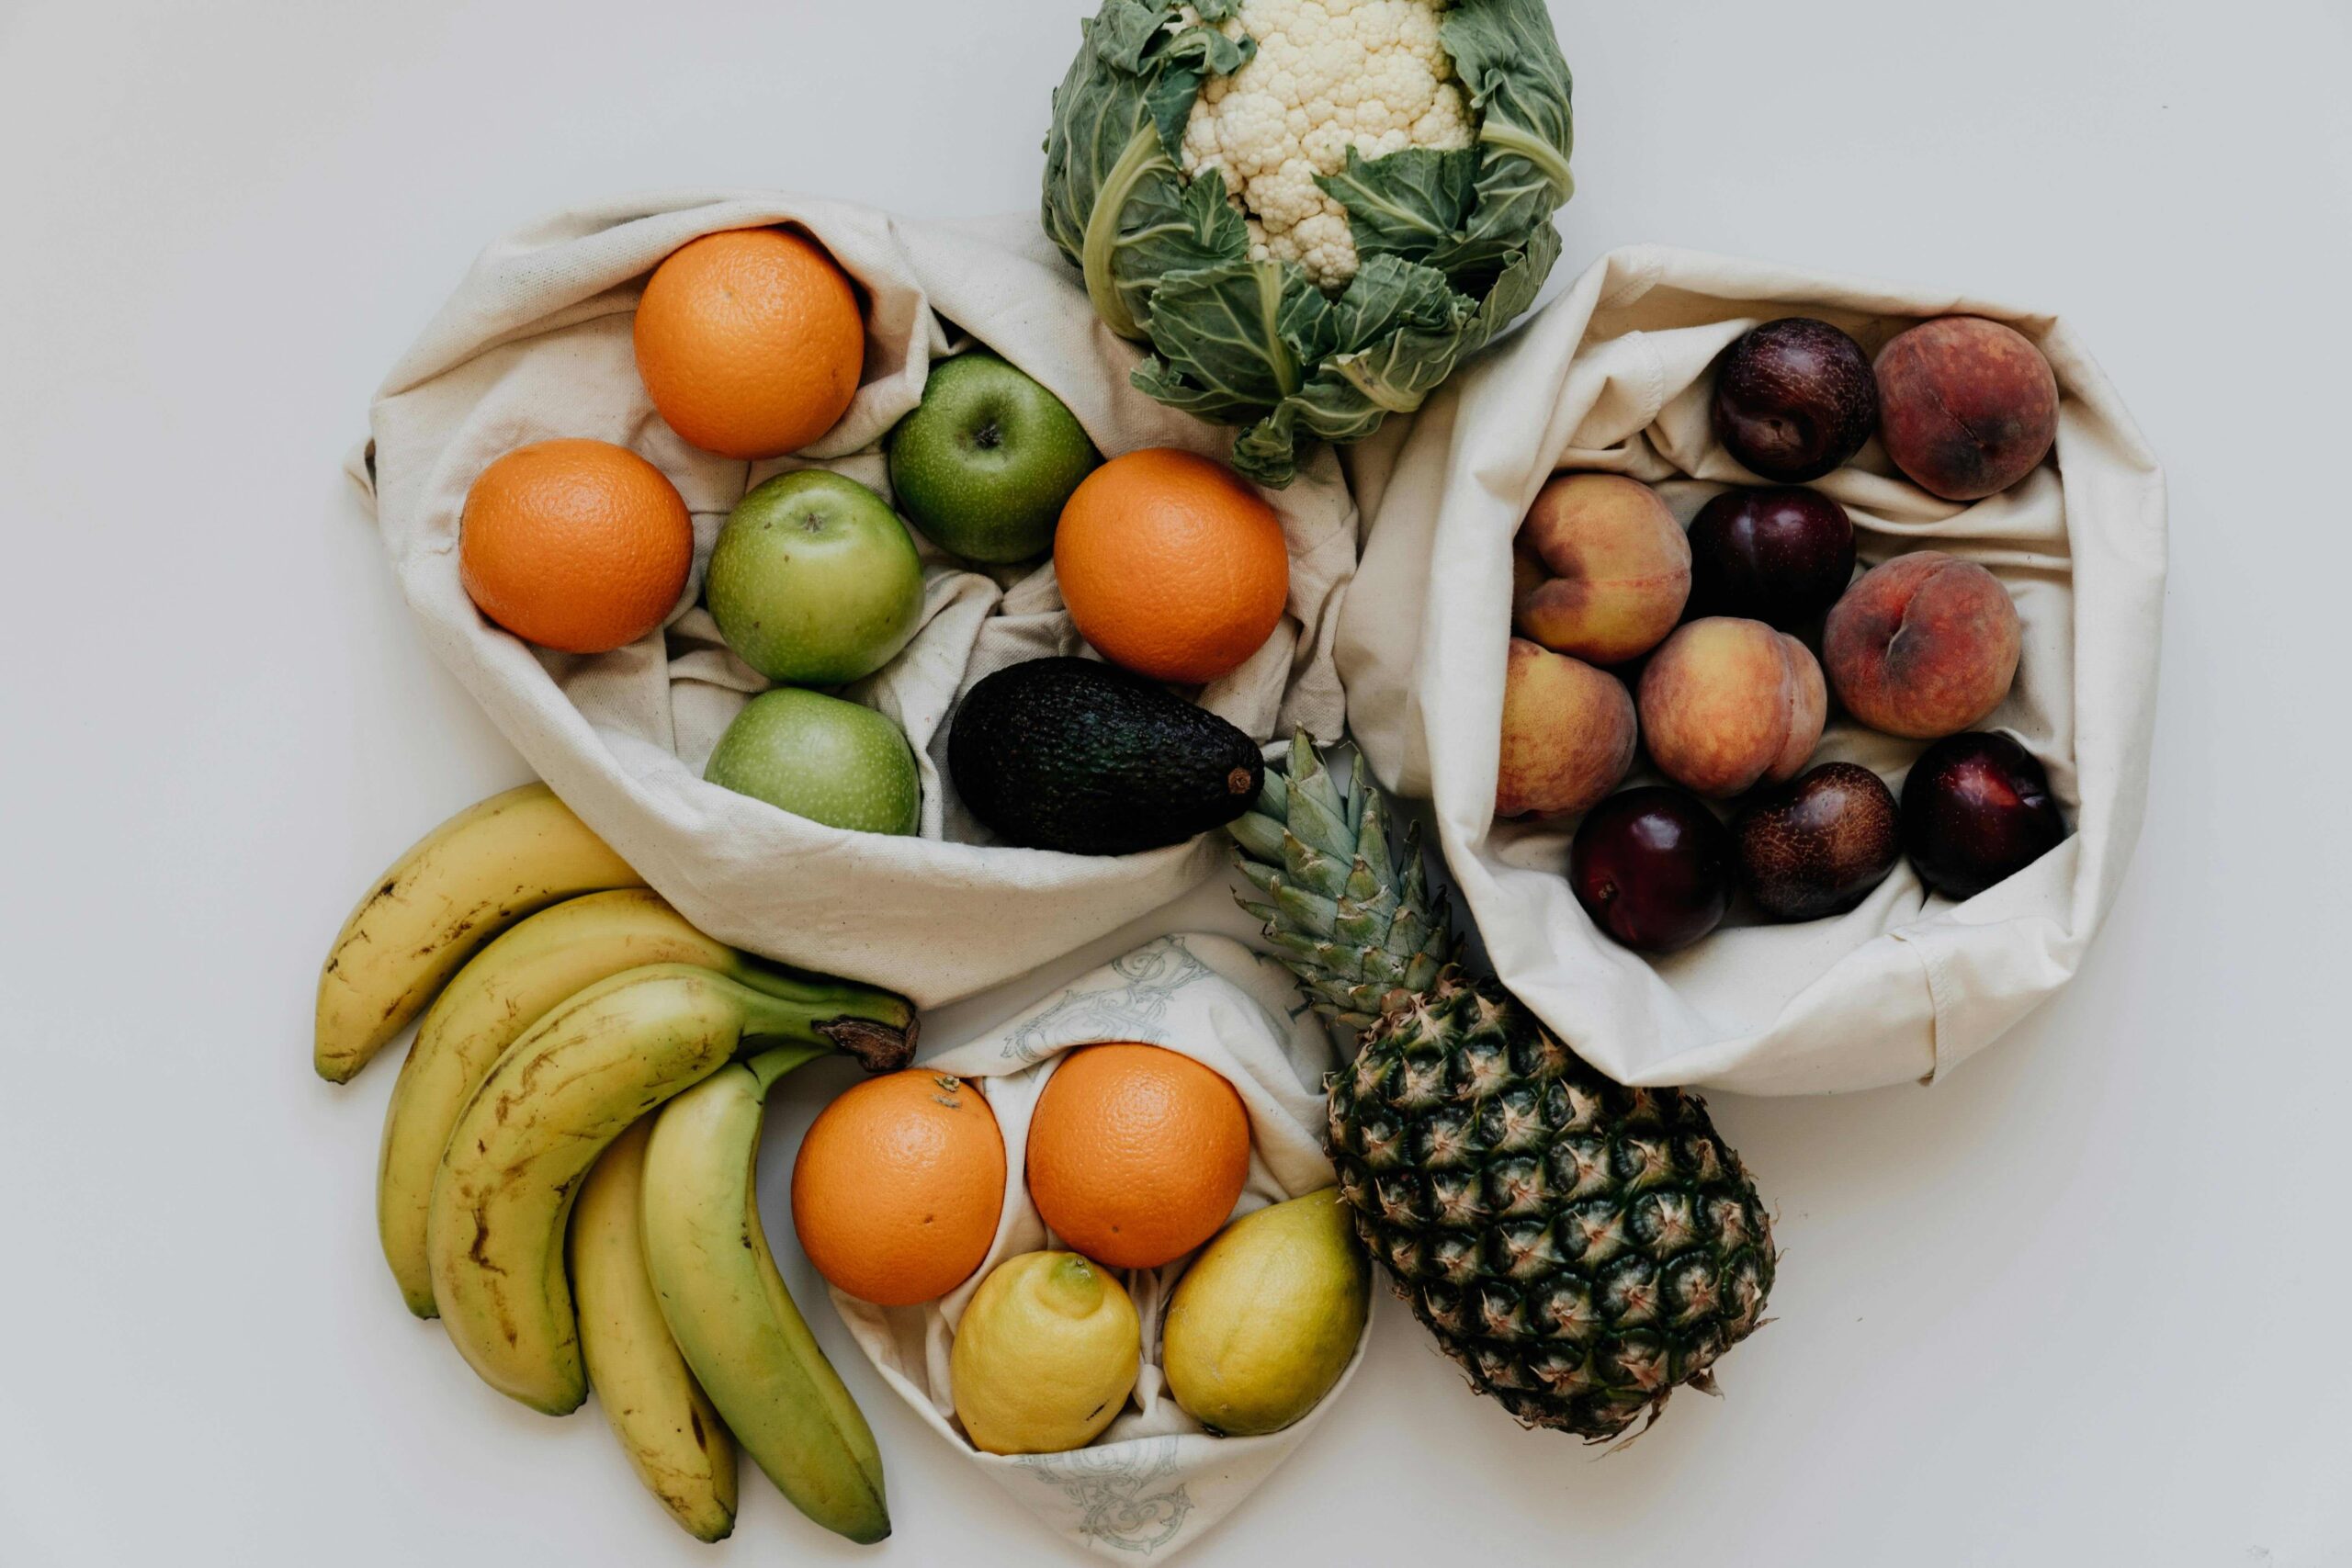
    The main fruits produced domestically were apples, oranges, strawberries, grapes, and lemons while the main fruits imported were bananas, avocados, pineapples, grapes, and limes.  The main vegetables produced domestically were potatoes, onions, leaf and romaine, head lettuce and sweet potatoes, while the main imported vegetables were tomatoes, cucumbers, bell peppers, potatoes, and onions. While production values are still unavailable for 2023, information on trade indicates that U.S. imports for fresh fruits increased by 2.13 percent from 2022. Fresh vegetables decreased by a third of a percent from one year to the next.

    Moreover, during 2023, Mexico was the largest exporter of fresh produce to the United States totaling an estimated 25.1 billion pounds, worth an estimated $17.96 billion. Of that 10.25 billion pounds, or 40.9 percent, was fresh fruit and the other 14.84 billion pounds were fresh vegetables. Mexico is the largest source of U.S. imports for a large variety of products. Mexican exports are dominated by tomatoes with 4.29 billion pounds of exports followed by avocados (2.48 billion pounds) and peppers (1.85 billion pounds). U.S. import volume for each of these three products from Mexico is larger than the total volume of fresh produce imported from any market outside of the top five.

    Guatemala and Costa Rica followed Mexico as the two next largest exporters of fresh produce to the United States. Guatemala was the source of 6.17 billion pounds of fresh produce with 4.44 billion pounds from Costa Rica. Over 90 percent of the total fresh produce exported to the United States for both countries was fresh fruit with the volume heavily concentrated to a few products. Of the 6.17 billion pounds of produce exported from Guatemala 4.38 billion pounds were bananas. Similarly, Costa Rica leads exports of pineapples to the United States with 2.46 billion pounds of the 4.44 billion.


  • Panama Canal Traffic Delays Threaten Southern Ag Global Supply Chains

    Panama Canal Traffic Delays Threaten Southern Ag Global Supply Chains

    The Panama Canal, a linchpin of global maritime trade, faces its most severe drought in history, resulting in unprecedented restrictions on vessel transits. Currently, hundreds of cargo vessels and tankers are stuck in front of the channel, with average wait times exceeding three weeks. This crisis is a major engineering challenge and a stark reminder of how vulnerable the global trade system is to weather shifts. At the heart of the Panama Canal drought lies the El Niño weather phenomenon, exacerbated by the broader issue of climate change. El Niño induces substantial weather anomalies, including reduced rainfall in Central America, directly affecting the water levels crucial for the canal’s operation. Climate change amplifies these effects further, resulting in more frequent and severe drought conditions.

    Under normal circumstances, the Panama Canal can accommodate about 35 ship crossings daily. However, the drought has caused a more than 30 percent reduction in vessel transits, limiting daily crossings to around 24 ships, as shown in Figure 1. This reduction is not just a logistical challenge but a substantial economic setback for Panama. Canal administrators anticipate a staggering loss of $500 million to $700 million in revenue for fiscal year 2024. The first quarter of fiscal year 2024 alone witnessed a 20 percent decrease in cargo volume, leading to 791 fewer ships than the previous year.

    Figure 1: Daily vessel transit through the Panama Canal plummets by 30 percent.

    Note. Daily average Panama Canal transits by vessel type obtained from the Panama Canal Authority (2024). Data is current as of January 18, 2024. Panamax and Neopanamax refer to vessel size limits at the Panama Canal. Panamax dimensions are set by the original locks, allowing vessels up to 110 feet in width, 1,050 feet in length, and 41.2 feet in depth. Neopanamax, on the other hand, is defined by the newer locks, accommodating ships up to 180 feet in width, 1,401 feet in length, and 60 feet in depth.

    The United States heavily relies on the Panama Canal for its agricultural exports, especially to Asian markets, facing profound repercussions due to this crisis. Figure 2 shows that grains and oilseeds are the major agricultural transit goods in volume. Last year, about 26 percent of U.S. soybean and 17 percent of corn exports passed through the Panama Canal. Due to the disruptions, U.S. agricultural exporters grapple with rising shipping costs and extended transit times. These additional expenses will translate into higher prices for agricultural products in Asian markets. For some perishable goods, shipping delays can impact market value due to compromised quality.

    Figure 2: Panama Canal handles over 26 percent of U.S. soybean and 17 percent of corn exports.

    Note. Agricultural transit volume data for fiscal years 2021 to 2023 come from Panama Canal Authority (2024). The fiscal year runs from October 1 to September 30. The figure shows the major agricultural exports by tonnage for the shipments on the Atlantic to Pacific route.

    The trajectory of the Panama Canal’s operational capacity in 2024 hinges mainly on environmental factors that are out of human control. While the impending rainy season might offer temporary relief, broader concerns surrounding climate change and the persistence of El Niño suggest the possibility of recurring droughts. In response, the Panama Canal Authority started to explore different water management techniques and new water sources to sustain both the canal’s functionality and Panama’s domestic needs.

    Looking into the future, U.S. agricultural exporters may need to reassess their logistical strategies, including exploring alternative shipping routes, adjusting shipping schedules, and potentially diversifying export markets to mitigate risks associated with the canal’s reduced capacity. The situation unfolding in the Panama Canal shows the vulnerability of global trade to environmental changes. It underscores the necessity for resilience and adaptability in international trade practices in the face of climatic challenges. This challenge calls for collaboration among global trade stakeholders to alleviate the impacts of these disruptions and strengthen the resilience of the international trading system.


    Lim, Sunghun, Sandro Steinbach, and Xiting Zhuang . “Panama Canal Traffic Delays Threaten Southern Ag Global Supply Chains.Southern Ag Today 4(8.4). February 22, 2024. Permalink

  • Creeping Imports and Hidden Costs to U.S. Fresh Produce Growers

    Creeping Imports and Hidden Costs to U.S. Fresh Produce Growers

    Rising U.S. agricultural imports, especially fruits and vegetables (F&V), have recently captured the attention of domestic producers. Between 2014 and 2023, U.S. agricultural exports increased from $152 billion to $179 billion, while imports grew to $195 billion from $109 billion (USDA Agricultural Trade Outlook, December 2014 and November 2023). During the same period, F&V exports remained stagnant ($24 billion), but their imports nearly doubled ($27 billion to $50 billion). Volume growth has been higher than the growth in value, e.g., the volume of blueberry and bell pepper imports increased by 194 and 110 percent, respectively, between 2011 and 2022. The import volume growth in the last decade has increasingly occurred during the harvesting windows for U.S. fresh produce (April through September, see Exhibit 1 for the case of blueberries).

    While American consumers enjoy a healthy diet and lower prices from the growth of F&V imports, domestic growers are challenged in protecting revenues already stressed by labor costs and weather events. In response to U.S. Trade Representative’s request in 2021, the U.S. International Trade Commission (USITC) examined import competition in specific F&V industries but provided mixed results. In the case of cucumbers and squash, the USITC reported that American growers could actually do better if imports were lower than current levels. However, in blueberries and spring table grapes, the USITC found that imports did not harm the domestic industry. 

    A recent study at the University of Georgia (UGA) examined the impact of imports on American growers’ revenue for four fresh produce: asparagus, bell peppers, blueberries, and strawberries. The study used an economic framework similar to that in USITC’s cucumber and squash investigations. Unlike the USITC, the UGA study tracked additional revenues from lowering imports between 2011 and 2021/22 for all four commodities by state and harvesting seasons.

    Turns out, growers could have made quite a bit more revenue if above-average import growth of fresh produce did not occur. Exhibit 2 shows that the additional revenues ranged from 1.7% (strawberries) to 28% (asparagus) of actual grower revenues, totaling $134 million, in 2021/22. The results did not change much when using prices at different marketing stages (farm-gate, terminal markets and shipping points). 

    The U.S. trade laws do not offer remedies to regional injuries, especially in the Southeastern states.  The F&V industry is critical to state and rural economies since it supports millions of jobs and raises a significant amount of revenue through crops produced and sold. American produce growers critically need risk management strategies such as revenue protection offered to program commodities in the Farm Bill and new technologies to stay competitive.

    Exhibit 1: Monthly Blueberry Imports, 2011-2022

    Exhibit 2: Actual and Counterfactual Revenues for 2021/22

    CommodityActual Revenue (mil $)Counterfactual Revenue* (mil $)Share of Additional Revenue in Actual Revenue (%)
    Asparagus (2022)45.7858.7928.42
    Bell Peppers (2022)612.57658.727.53
    Blueberries (2021)604.47631.584.48
    Strawberries (2022)2781.692829.831.73

    *Revenue when above-average growth in imports is removed.


    Munisamy, Gopinath, Ajit Khanal, and Dixit Poudel. “Creeping Imports and Hidden Costs to U.S. Fresh Produce Growers.Southern Ag Today 4(6.4). February 8, 2024. Permalink

  • Southern U.S. Agriculture Faces Headwinds in Asia Amid Red Sea Shipping Disruptions

    Southern U.S. Agriculture Faces Headwinds in Asia Amid Red Sea Shipping Disruptions

    The sudden disruption in the Red Sea, one of the world’s most critical maritime passageways, has sent shockwaves through global trade, having the potential to harm agricultural exports from the Southern U.S. We delve into the manifold implications of this blockade, examining its direct impact on trade flows, freight rates, and the challenges posed by the limited capacity at the Panama Canal for Southern agricultural exports.

    The Red Sea blockage, precipitated by heightened military tensions and attacks on commercial vessels by the Houthi terrorist organization, has led to a dramatic decrease in shipping activities through this critical route. As Figure 1 shows, about 500 cargo vessels were diverted via the Cape of Good Hope due to the attacks in the Red Sea. This diversion implies that the volume of container traffic in the Red Sea experienced a more than 50 percent decline in December, with the current volume almost 70 percent below normal as of January 18, 2024. This decline is a stunning indication of the magnitude of disruption faced by global shipping lines, including those serving agricultural exporters in the Southern U.S.

    The Southern U.S., a powerhouse of agricultural exports of grains, soybeans, cotton, and forest products, could be negatively affected by this disruption. The rerouting of vessels around the Cape of Good Hope, necessitated by the Red Sea blockage, has added up to 20 days to shipping times and increased freight rates. These delays could considerably impact perishable agricultural products, risking product spoilage and financial losses. Furthermore, the automotive sector, akin to the agricultural industry, has already started experiencing production adjustments due to the maritime delays. This parallel suggests that agricultural exporters from the Southern U.S. could face similar operational and logistical challenges, further compounding the adverse effects of the Red Sea crisis on the region’s agricultural economy.

    A direct consequence of the blockage has been the surge in ocean freight rates. Figure 2 illustrates an increase in the average cost of transporting a standard container (measured as a twenty-foot equivalent unit, TEU) from about USD 700 in November 2023 to over USD 1,900 in January 2024. On some routes, this increase is even more substantial. For instance, the freight rate from China to Northern Europe rose from nearly USD 750 to over USD 2,000 as of January 18, 2024. Although these figures are specific to the Europe-Asia route, they reflect a global trend in rising freight costs, which inevitably impacts the cost of exporting agricultural products from the Southern U.S. to international markets.

    The Panama Canal’s limited capacity further complicates the situation. Initially rerouting from the U.S. Atlantic Seaboard and the Gulf of Mexico to Asia via the Suez Canal, many carriers have shifted back to the Panama Canal. This redirection will lead to increased congestion and delays, exacerbating the logistical challenges for Southern U.S. exporters who rely on this route for more efficient access to Asian markets.

    The trade dynamics with South and Southeast Asia, an important and growing market for Southern U.S. agricultural exports, could be particularly affected. The extended transit times and shifting shipping routes disrupt the timely delivery of goods. Figure 3 shows that the daily freight capacity in the Red Sea fell by almost 70 percent below the expected level in January 2024. As cargo vessels reroute and face delays, the availability of products in South and Southeast Asian markets is affected, potentially leading to lost sales and strained trade relationships. The ripple effects of these disruptions are evident in increased insurance costs for vessels transiting high-risk areas like the Red Sea. These rising costs, which reached one percent of the vessel’s value, add an extra financial burden on shippers and, by extension, agricultural exporters in the Southern U.S.

    In response to these unprecedented challenges, agricultural exporters in the Southern U.S. should explore alternative logistical strategies. These include diversifying port usage, considering air freight for urgent shipments, and re-evaluating supply chain routes to mitigate the impacts of delayed deliveries and increased costs. However, these adjustments come with their own financial and operational complexities.

    The Red Sea blockage by the Houthi terrorist organization represents a substantial disruptor in the global trade ecosystem, with potentially profound implications for U.S. agricultural exports to South and Southeast Asia. The escalation of freight costs, extended shipping durations, and the strain on alternative routes, such as the Panama Canal, paint a challenging picture for 2024 agricultural exports from the Southern U.S. As the situation evolves, agricultural stakeholders must remain agile, leveraging data-driven insights and innovative solutions to navigate these turbulent waters while also considering long-term strategies for resilience in an increasingly uncertain global market environment.

    Figure 1: Close to 500 cargo vessels diverted due to Houthi attacks on ships in the Red Sea.
    Note. Cargo vessel position data sourced from Flexport (2024). Out of 6,141 cargo vessels tracked, 448 had been redirected via the Cape of Good Hope as of January 6, 2024.
    Figure 2: Drewry World Container Index increased by 75 percent since December 2023.
    Note. The Drewry World Container Index is a composite index of the major shipping lines from Drewry (2024). The dataset covers January 18, 2023, to January 18, 2024.
    Figure 3: Daily freight capacity in the Red Sea falls by 66 percent below the expected level.
    Note. The daily freight rate capacity in the Red Sea until January 11, 2024, comes from Fleetmon (2024) and the expected freight capacity from the Kiel Institute of the World Economy (Hinz and Rauck, 2024).

    Learn More

    Hinz, Julian and Mathias Rauck (2024). Cargo volume in the Red Sea collapses. Kiel Institute for the World Economy, Press Release 01/2024.


    Goyal, Raghav, Sandro Steinbach, Yasin Yildirim, and Xiting Zhuang. “Southern U.S. Agriculture Faces Headwinds in Asia Amid Red Sea Shipping Disruptions.Southern Ag Today 4(4.4). January 25, 2024. Permalink

  • U.S. Agricultural Trade: Value vs. Volume

    U.S. Agricultural Trade: Value vs. Volume

    Historically, U.S. agricultural trade has experienced a trade surplus, where exports are higher than imports (Figure 1.). In fact, since 1989 which is as far back as USDA Foreign Agricultural Service (FAS) Global Agricultural Trade System (GATS) has available data on agricultural trade, there were only two years with agricultural trade deficit, imports higher than exports, 2019 and 2022.  USDA FAS expects that 2023 not only will show a trade deficit, but that the trade deficit will be increasing over time.  The trade deficit was $3.5 billion in 2022 and it is expected to be $16.7 billion and $30.5 billion in 2023 and 2024, respectively (official 2023 numbers will be reported in February 2024).  

    However, when U.S. agricultural trade is presented in volume as opposed to value, the story is very different (Figure 2).  The U.S. has never experienced a trade deficit and is very far from experiencing one where exports to imports ratio has been 3.2 over the last 10 years.  The main difference between value and volume in agricultural trade is the agricultural products that the U.S exports and imports.  The main U.S. agricultural products exported are soybeans, corn and wheat and they are sold for the most part in bulk.  On the other hand, the main agricultural products imported by the U.S. are more high value consumer-oriented products, mainly distilled spirits, wine & wine products, and beer, as well as high value fresh produce such as fresh fruits and vegetables.  These imported products are of much higher in value than the exported products and vice versa when volume is used as a measuring unit.

    Figure 1.  U.S. Agricultural Trade, Billion Dollars

    Figure 2. U.S. Agricultural Trade, Million Metric Tons