Blog

  • Humanely Processed Chicken May Bring a Premium Price

    Humanely Processed Chicken May Bring a Premium Price

    In 2023, food scientists from Auburn University’s Poultry Science Department conducted a survey to ascertain the perception of poultry processing, specifically stunning processes, among American chicken consumers (“Consumer Perception Survey of Animal Welfare in Broiler Stunning.”, Linda Barahona; Sungeun Cho, Ph.D.) The full survey data are currently being evaluated, but some preliminary findings are especially intriguing on the economic front. 

    The following two survey questions were of specific economic interest: A. “Humanely processed (chicken) are animal derived products from animals that have been treated ethically. Are you willing to pay more for humanely processed(chicken)?” – to which respondents could answer Yes, No or Maybe. The next question related to the previous by asking: B. “If the answer to the previous question was ‘Yes’ or ‘Maybe’, how much more are you willing to pay?” Respondents had six choices for B: Less than 10%, 10-50%, 51-100%, 101-200%, 201-300% and Greater than 300%.

    Of the 986 respondents, 699 of them (71%) answered Yes (358) or Maybe (341). Of those 699 Yes/Maybe’s, almost 85% were in the first two categories and willing to pay at least 10% more, with half of those willing to go up to 50% more in price for humanely processed chicken. To put the choice ranges in perspective, at the time of this writing, the average regular pack of boneless/skinless breast in the Southeast U.S. was $3.21 (USDA National Retail Report – Chicken, May 17, 2024.) Using the upper end of the ranges above, the respective increased prices someone might be willing to pay chicken would be: $3.50 (<10%), $4.81 (10-50%), $6.42 (51-100%), $9.63 (101-200%), $12.84 (201-300%), or $14.45 (>300%, estimated at 350% increase). Applying these prices to the results would suggest only 15% of those willing to pay more would accept more than an additional $1.60 ($4.81 compared to $3.21) per package of humanely processedchicken breasts. 

    While this survey seems to suggest that consumers are indeed willing to pay for chicken that was processed in a perceived more humane fashion, several questions remain. The above prices in dollars were not shared in the survey, those are extrapolations of this author. Further work is planned to evaluate consumer choices with products visually before them with the dollar prices clearly marked, and with one package clearly labeled and understood as “Humanely Processed”. Would the breaking point remain at 50% price increase, or would consumers make different choices with more information? Some of the current survey data suggests increased knowledge of poultry production in general leads to willingness to pay more. Would a clearer understanding of a specific “humane process” in question also impact willingness to pay? All of these are questions being considered for further expanded study.

    The results of this work will be important for poultry companies as they consider implementing processes that might be considered more humane, like controlled atmospheric stunning, but can be costly to implement and have increased management requirements. If consumers are willing to pay enough, it might be possible for poultry companies to work with their wholesale and retail customers, like grocery and fast-food businesses, to pass the increased cost of production directly to end consumers. 


    Brothers, Dennis. “Building Equity.Southern Ag Today 4(23.2). June 4, 2024. Permalink

  • Corn Yields and 2024 Projected Linear Trendline Yields in Southern States

    Corn Yields and 2024 Projected Linear Trendline Yields in Southern States

    Calculating trendline yields can be a useful tool for budgeting or developing a crop marketing plan. Using trendline yield estimates at the start of the production year can assist in determining potential profitability, at current market prices, and determine if additional sales or price risk management is warranted. Projected yields should be periodically revisited during the production year to make adjustments to management practices and marketing strategies to improve the likelihood of positive financial outcomes. This article examines differences in linear trendline yields for corn across Southern States.   

    There is tremendous variability in average USDA NASS corn yields across the Southern States (Figure 1).  Over the past five years (2019-2023), Arkansas had the highest average corn yield at 179.8 bu/ac followed by Kentucky (177.6 bu/ac) and Mississippi (176.2 bu/ac). The lowest five-year average yields occurred in Texas (121.2 bu/ac), North Carolina (129.2 bu/ac), and South Carolina (129.8 bu/ac). 

    Projected linear trendline yields in 2024 for corn, using USDA NASS data from 1980-2023, vary tremendously (Table 1). The slope coefficient, in Table 1, provides the annual average increase in yield for each state from 1980 to 2023. The constant in Table 1 is the initial yield at the start of the linear trend line. For example, on average from 1980-2023, corn yields in Mississippi increased 3.33 bu/ac per year from a starting trendline yield of 43.57 bu/ac. An easier way to think about this is that over a ten-year period, average yield in the state of Mississippi increased by 33.3 bu/ac. Increases can be a result of production practices (such as irrigation) or technology (genetic improvements). In the past ten years (2014-2023), the increase in annual yield improvement for most Southern states has slowed.  R2 is a measure of the proportion of variation in the dependent variable (yield) that can be explained by the independent variable (time). Across the Southern U.S., we see tremendous variation in the R2 for linear trendline yields, ranging from a high of 0.926 for Mississippi to a low of 0.285 for Texas. Low R2 values indicate that the independent variable (in this case time) does not explain the variation in yield, thus other variables need to be considered when projecting yield.  

    Ideally, projecting annual yield should be conducted at the farm or field level using producer data. Crop insurance records or yield monitor data can allow producers to analyze, and project, yield and production to guide management and marketing decisions.

    Figure 1. Corn Yields in Southern States, 1980-2023 

    References

    USDA NASS Quick Stats. Corn Yields, 1980-2023. Accessed at https://quickstats.nass.usda.gov/  


    Smith, Aaron. “Corn Yields and 2024 Projected Linear Trendline Yields in Southern States.Southern Ag Today 4(23.1). June 3, 2024. Permalink

  • HPAI in Dairy Cattle:  Is Pasteurization Dairy’s Only Reliable Protection? 

    HPAI in Dairy Cattle:  Is Pasteurization Dairy’s Only Reliable Protection? 

    It has been approximately eight weeks since the U.S. dairy industry became immersed in efforts to monitor and potentially control the outbreak of Highly Pathogenic Avian Influenza in dairy cattle confirmed in 63 locations across 9 nine states as of May 28, 2024, from Idaho to North Carolina.  FDA maintains a wealth of on-line data which is updated regularly and appears to be a model of government transparency. 

    On March 25, 2024, the first joint USDA/FDA/CDC public confirmation of  a HPAI outbreak in dairy cattle in Texas and Kansas, along with communication by most federal and state animal health and food safety authorities has contained this by-now familiar public health advisory:

    “The FDA and USDA have indicated that based on the information currently available, our commercial milk supply is safe because of these two reasons:

    1) the pasteurization process and

    2) the diversion or destruction of milk from sick cows.”

    These statements are based upon the standardized dairy production practices and safeguards mandated in the U.S. Department of Health and Human Services, United States Public Health Services’ Grade “A” Pasteurized Milk Ordinance, 2019 Revision (PMO). In its earliest forms, the PMO dates back to 1924 and acts as the comprehensive and uniform national regulation of milk production for human consumption, its pasteurization, and sales in interstate commerce. It is enforced in all 50 states by a system of milk regulatory officials employed in federal and state government and by private industry through cooperative agreements in some jurisdictions. Pasteurization and the destruction of milk from sick cows is required by the PMO.  

    However, these public health statements contain buried and fundamental assumptions about regulatory and disease control processes that should be unpacked for a clearer understanding of why the impact and nature of these HPAI detections are qualitatively different than detections in poultry. Many distinguishing points exist.  

    • Milk production, processing and sale for the vast majority of human consumption nationwide mandates pasteurization, a “kill step” which has proven to be a relatively foolproof regulatory requirement for the prevention of disease transmission through milk. Perhaps no commodity is better situated to deal with the potential of HPAI in its supply chain. 
    • The biological circumstances of both the disease and the host animal—a large mammal of significant monetary value—do not indicate euthanasia as a disease control measure. Widespread cow-to-cow transmission has not materialized. Hopefully, that does not change in the future, or the consequences will be unprecedented and catastrophic. 
    • A dairy herd, its housing, and the land occupied for dairy production is much more difficult to “lock down” from a bio-security standpoint than the precedent established for controlling this disease in poultry.  Dairy production involves a complex daily routine of feeding, multiple milkings, milk storage, and truck transport for processing no less frequent than every 72 hours (a requirement of the PMO). Through this daily process, in order to achieve the immediate and effective disease transmission prevention aspired to in the poultry context would likely require immediate removal from the herd and culling of cows testing positive. Current conditions and pasteurization support a determination that the removal of objectively sick cows from the milking herd is sufficient. The removal and quarantine of sick cows on an individual basis from milk production if detected (or for example those treated with antibiotics) is a common occurrence and required by the PMO.
    • However, if sick cow numbers increase drastically, the logistics of withdrawing from the herd and retaining sick cows under quarantine conditions on-site for ultimate return to production simply may not be within the capabilities of many dairy operations. 

    All of these circumstances mean that quarantine processes, procedures, and movement restrictions on and off the farm are vastly different and comparatively reduced, as compared to poultry. Most important is that thus far, beyond interstate movement testing and restrictions, USDA APHIS federal quarantine orders have been used sparingly in comparison to poultry. Individual states’ animal health officials are presently filling in any void they feel necessary by imposing their own quarantine orders to serve their own perceived needs. However, this 50-state patchwork is not likely sustainable on a long-term basis should this outbreak in this species become more virulent or protracted.  

    Only time will tell if the current approach to disease control is effective in this species and with this commodity’s production methods. The ability to sustain these practices will depend entirely upon the number of HPAI detections.  

    However, one development has thrown a monkey wrench in the second statement in the two-pronged public health advisory noted above (“. . . diversion or destruction of milk from sick cows.”)  The assumption that such a measure is being reliably taken depends upon every individual dairy herd operator’s 100% accurate determination of which cows may be “sick” with HPAI. We have learned in recent weeks that HPAI in this species is not necessarily able to be routinely or accurately diagnosed.  

    We learned on May 10, 2024, that FDA has engaged in testing of 297 retail dairy products for HPAI virus detection, ostensibly to confirm that the pasteurization “kill step” was 100% effective. 

    “While the FDA collected the 297 samples at retail locations in 17 states, these retail samples represent products produced at 132 processing locations in 38 states.”

    Pasteurization scored a perfect 100% – no active HPAI virus.  However, 59 of the 297 samples tested showed evidence of “dead” HPAI virus components (essentially “killed” by pasteurization). That means 20% of the retail dairy products tested showed evidence that milk from one or more cows carrying HPAI was not diverted from the milk supply. This finding evidences the problems with routinely and accurately diagnosing infected dairy cattle. This result may be through absolutely no shortcoming of dairy operators’ diligence and more likely is caused by the inability to detect this disease’s presence in this species in any way that should be relied upon. The PMO requirement to exclude “sick” cows from the milking herd remains an essential regulatory policy. However, in a crisis of this magnitude, the observational tools of dairy operators for individual cow illness in the herd have proven at least 20% ineffective. Without pasteurization as the tried-and-true backstop, that would be wholly unacceptable and is misplaced if cited as the second most important reason the U.S. milk supply remains safe. 

    These findings illustrate the need for a more robust testing regime of dairy cattle and on-farm milk storage (“bulk tank units”) during this outbreak. Ideally, this should occur at a stage where further contamination can be stopped at the farm gate and before transport for processing as co-mingled milk from multiple premises.  

    Lastly, to boost public confidence, more focus should be on coupling pasteurization with a concentration on the evidence, or lack thereof, that milk can be a transmission medium of HPAI from cows to humans.[1]

    The perceived safety of consumer dairy products[2] is equally a matter of public health as well as economic survival of many in the dairy industry.    


    [1] In terms of disease transmission in mammals by consuming milk containing the live virus, there has been a late-breaking development. On May 24, 2024, the New England Journal of Medicine published a report from research primarily conducted at the University of Wisconsin-Madison concluding that the HPAI virus can infect mice through consumption of milk containing the live virus. At press time, further expert, USDA, or FDA input on the impact of this research was not available. 


    [2] As written, this article is strictly limited to the impact of HPAI as a pathogen in milk. However, transmission through the consumption of beef has also been the subject of another very recent development. To date in this outbreak, no HPAI has been confirmed in beef cattle but culled dairy cattle and beef from dairy cattle species increasingly contribute to the U.S. consumer beef supply. On May 1, 2024, USDA-APHIS reported that retail ground beef samples collected in the same states as confirmed HPAI-positive dairy cattle all tested negative for the presence of HPAI. However, on May 24, 2024, USDA’s Food Safety and Inspection Service (FSIS) announced that testing of beef tissue from 96 culled dairy cows sent to FSIS-inspected meat processing plants (but diverted by FSIS staff due to signs of illness) confirmed  the presence of HPAI “viral particles” in beef tissue from one cow. Further information may be forthcoming on the broader implications of this one finding.  Nevertheless, like pasteurization, cooking beef tissue appears to be the reliable “kill step.” On May 16, 2024, USDA’s Agricultural Research Service (ARS) published test results from cooking ground beef heavily inoculated with the HPAI virus.  No active virus was detectable after cooking temperatures of 140 – 160° F.


    Duer, Brook, and Paul Goeringer. “HPAI in Dairy Cattle: Is Pasteurization Dairy’s Only Reliable Protection?” Southern Ag Today 4(22.5). May 31, 2024. Permalink

  • U.S. Fresh Fruit and Vegetable Supply

    U.S. Fresh Fruit and Vegetable Supply

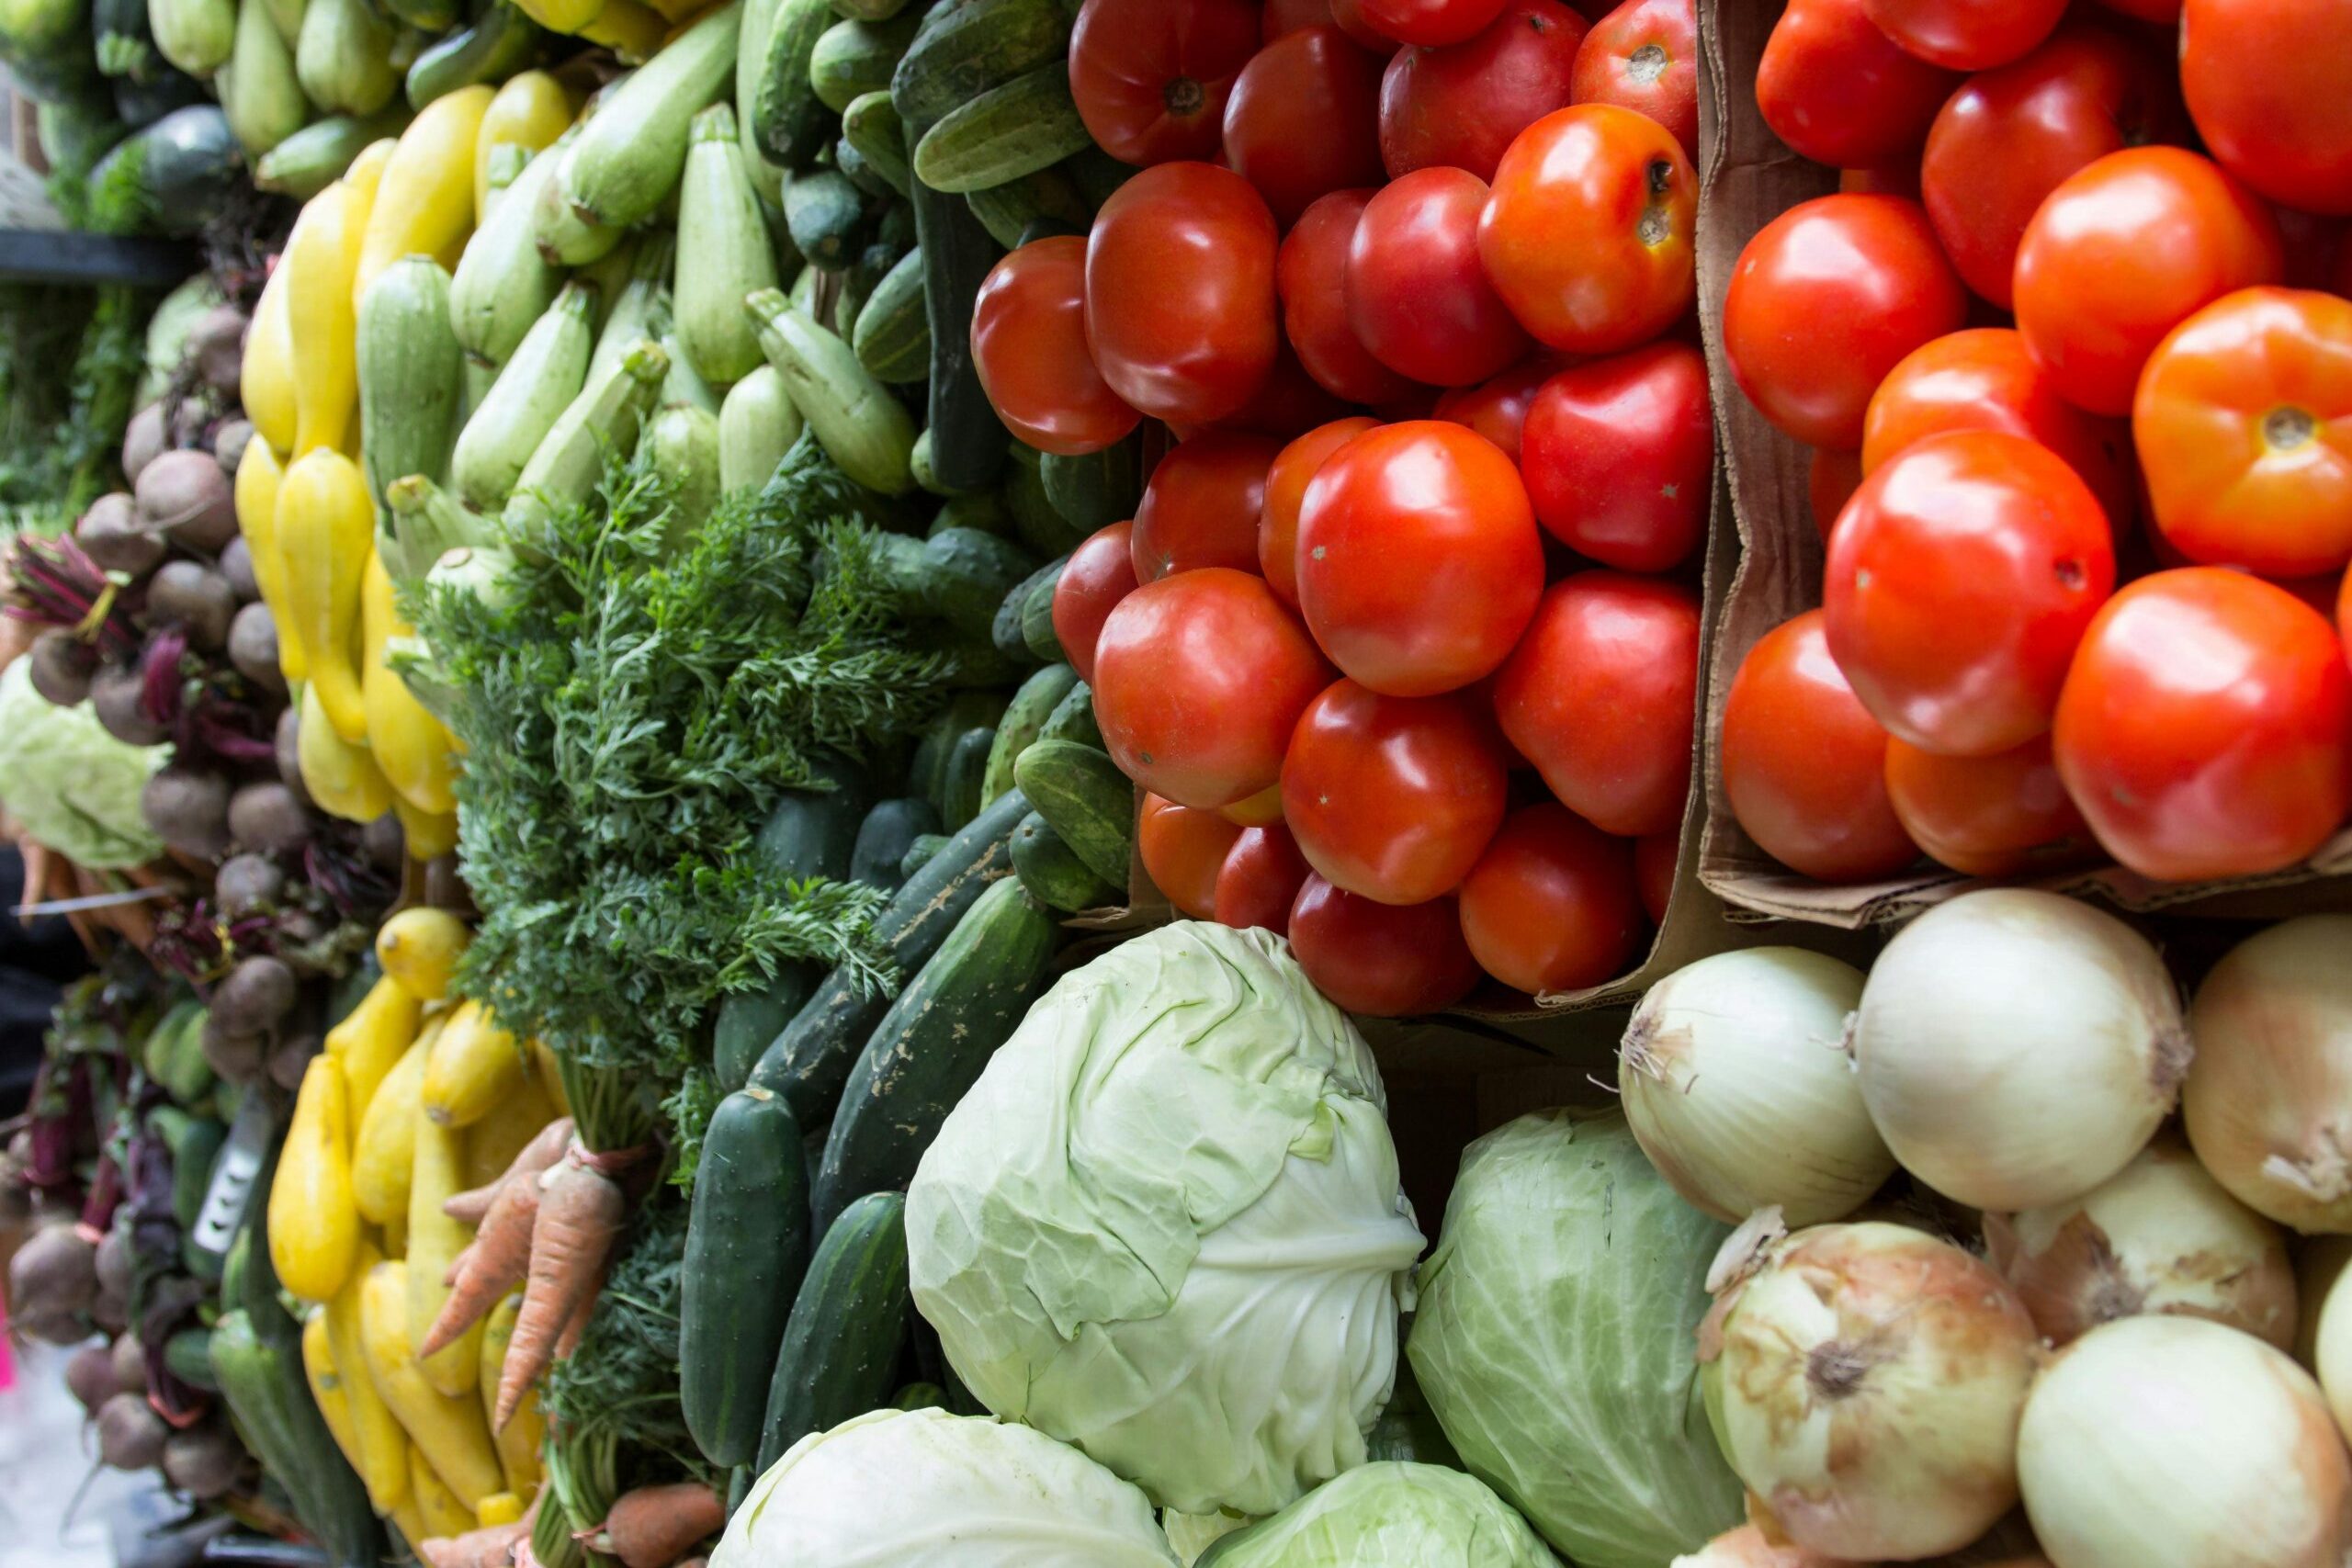
    In recent years, fresh fruit and vegetable production in the United States has been on the decline, U.S. production has decreased by 10 and 23.1 percent respectively since 2000. With declining domestic production, imports of fresh fruits and vegetables have grown substantially with some products only being available in the United States due to imports. Since 2020, a larger share of the total supply of fresh fruit in the United States was imported than grown domestically and has increased from 36.6 percent in 2000 to 54.8 percent in 2022 (Figure 1). Vegetable imports in 2022 were 29.3 percent of the total supply up from 9.5% in 2000. The value of imported fresh fruits and vegetables for 2022 was $18.23 billion. After including exports, the total volume of fresh fruits and vegetables available in the United States was 94.65 billion pounds, or 283.63 pounds per capita.

    The United States has gone from being a net exporter of fresh produce in 1980 with 3.25 billion pounds to a net importer starting in 1998 with 1.88 billion pounds (Figure 2). Net trade of fresh produce, excluding bananas, for the United States during 2022 totaled 24.4 billion pounds of trade deficit and has been over 10 billion pounds since 2013. The United States was a net exporter of fresh fruits, excluding bananas, from 1980 to 2002, since then the United States net imports have grown considerably. During 1980 the United States trade surplus of fresh fruits, excluding bananas, totaled 3.11 billion pounds of exports. In 2022, the trade deficit of fresh fruits, excluding bananas, totals 10.4 billion pounds of imports. As for fresh vegetables, the United States has not had exports exceed imports since 1992. During 2022, imports of fresh vegetables were 13.9 billion pounds higher than exports and continue to grow. 


    Young, Landyn, Luis Ribera. “U.S. Fresh Fruit and Vegetable Supply.Southern Ag Today 4(22.4). May 30, 2024. Permalink

  • Understand the Implications of a Price Slide When Buying and Selling Cattle

    Understand the Implications of a Price Slide When Buying and Selling Cattle

    Everyone who buys or sells feeder cattle regularly understands that in most markets, the price per pound decreases as cattle get heavier. This can create a challenge for pricing cattle in situations where weight is not known with certainty. Final weight is uncertain in forward contracts, internet sales, and when cattle are sold off the farm but hauled to another location to determine pay weight. In these situations, cattle are often sold with a base weight, and the price is adjusted downward as the weight of the cattle exceeds that base weight. As an illustration, let’s consider a backgrounder that sold cattle via an internet auction with an advertised base weight of 800 lbs. and a price slide of $8 per cwt. Let’s further assume that the cattle sell for $240 per cwt in the auction and will be hauled to a weigh station the following week to determine the pay weight.

    If those steers were to weigh exactly 800 lbs, no price adjustment is needed. The pay weight is 800 lbs. and the price is $240 per cwt for a total of $1,920 per head. However, if the cattle weighed 850 lbs., the price is adjusted downward because they are 50 lbs. above the base weight. With an $8 per cwt slide, the price would be adjusted downward by $4 per cwt (50 lbs. is half of a cwt). With a pay weight of 850 lbs. and an adjusted price of $236 per cwt, the per head total is $2,006. Price slides can get much more complicated than this, but this simple illustration captures the process well enough for this discussion. As long as the price slide is not so large as to actually result in a lower value per head, the seller is typically happy to have more lbs. to sell. In the previous example, the cattle sold for $86 more than they would have had they weighed right at the base weight.

    Now, I want to focus this discussion on the difference between the artificial price slide used to adjust the price for cattle weighing above the base weight and the actual market price discount as cattle get heavier. The table below illustrates this point in relatively simple terms. Suppose the market price for an 800 lb. steer is $240 per cwt and the market price for an 850 lb. steer of the same type and quality was $235 per cwt. This would imply that the actual price discount in the feeder cattle market was $10 per cwt and the market value of those 850 steers would be $1,997.50 per head (850 lbs. x $235 per cwt). If a seller advertised that group of steers with a base weight of 800 lbs. and a $10 per cwt price slide, the price slide and the market discount for weight would match perfectly. The final price would be the same even though the pay weight exceeded the base weight. This scenario is shown in the middle row of the table below, but this will not be the case when differences exist between the market discount for weight and the price slide.

    If the artificial price slide is less severe than the market discount as cattle get heavier, then the seller is actually better off if the pay weight exceeds base weight because the lower artificial price slide would result in a smaller price discount due to the additional lbs. This is illustrated below with the $8 per cwt price slide and note that the final price is higher for these steers. Previous research has found evidence that sellers tend to underestimate weights in these situations (Brorsen et al., 2001). Conversely, if the market discount is greater than the price slide, the seller would actually receive a lower final price than had they advertised the cattle with the higher base weight to begin with. Note that the $12 per cwt price slide below, which exceeds the market discount, results in a lower final price. In situations such as this, sellers have no incentive to overestimate weight (Burdine et al., 2014).

    In theory, price slides used for selling cattle with weight uncertainties should evolve with the market. But my experience has been that they are often slow to adjust, whereas market conditions change very quickly. The key point from this discussion is that a price slide is most efficient when it is roughly equal to the market discount as cattle get heavier. In those situations, there is no incentive for sellers to underestimate weight when selling cattle on a slide and there is little true penalty if they do. Buyers and sellers both need to understand the implications when prices slide and market weight discounts diverge, as this can have an impact on both parties.


    Base weight

    Sale Price

    Pay Weight

    Price Slide
    Final Price
    per cwt
    Final Value
    per head
    800$240850$8 per cwt$236$2,006.00
    800$240850$10 per cwt$235$1,997.50
    800$240850$12 per cwt$234$1,989.00

    References:

    Brorsen, B. W., N. Coulibaly, F. G. C. Richter, and D. Bailey. 2001. “Feeder Cattle Price Slides”. Journal of Agricultural and Resource Economics. 26: 291-308.

    Burdine, K.H., L. J. Maynard, G.S. Halich, and J. Lehmkuler. 2014. “Changing Market Dynamics and Value-added Premiums in Southeastern Feeder Cattle Markets”. The Professional Animal Scientist. 30:354-361.


    Burdine, Kenny. “Understand the Implications of a Price Slide When Buying and Selling Cattle.Southern Ag Today 4(21.3). May 22, 2024. Permalink