Blog

  • A Very (Very) Early Look at Post-Drought Herd Rebuilding

    A Very (Very) Early Look at Post-Drought Herd Rebuilding

    The average of various ENSO (El Niño and the Southern Oscillation) models suggest a trend out of La Niña conditions and toward neutral conditions through the spring and into El Niño territory by the May-June-July quarter. Where La Niña typically brings drought to the Southern Plains and other parts of the South, neutral to El Niño conditions are associated with average and above average rainfall. The combination of increasing calf values and the potential for improved rainfall through the summer has some ranchers considering restocking strategies from drought-induced culling. 

    We’re still very early in the decision-making process of whether to grow a herd and in some cases, there may not be replacement cows available that naturally fit your environment. However, it’s worth beginning to think about what cows are a financial fit for your operation so that you can take advantage of opportunities and avoid overpriced replacements when the market takes off. 

    Let’s take a look at various replacements offered around Texas in the month of December. Using Texas A&M AgriLife Extension’s Cow Bid Price estimator, forecast of price, and forecasts of expected cow costs for the area we’ve estimated Net Present Value (NPV) of the investment in these replacements and what a rough break-even bid would be. 

    We can see several trends in the data. First, the ratio of number of calves produced by the cow to price paid for the cow is a critical component. The Table below looks at 2 cows that differ by stage of pregnancy, weight, purchase price, and number of calves expected to produce over her remaining life.  The number of calves to produce in her expected life is key, but don’t forget her value as a cull cow.  Often the cull cow value is a major part of the cow’s income producing life.  It’s also important to note that though the last cow on the list is the cheapest, in this case, she represents a negative NPV. However, were she roughly $100 less expensive she would net a profit in the next year and likely generate additional cash flow as a cull. 

    There are thousands of combinations and considerations when making the decision to restock a herd. The key is to use your data to evaluate your own business. There is the potential that the $1,100 cow is a steal, but in other cases, she could steal from you, and if we return to the $3,000 replacement market the need to run the numbers will become all the more important. 

    Author: Justin Benavidez

    Assistant Professor and Extension Economist

    justin.benavidez@ag.tamu.edu


    Benavidez, Justin. “A Very (Very) Early Look at Post-Drought Herd Rebuilding.Southern Ag Today 3(2.2). January 10, 2023. Permalink

  • The Peanut-Cotton Price Relationship

    The Peanut-Cotton Price Relationship

    Peanut production in the U.S. can be described as having a symbiotic relationship with cotton production as the two crops are produced in rotation throughout the southeastern states.  This can create a competitive environment between these crops, with prices a key factor in determining the number of acres to plant in a given year.  Since the peanut quota system was eliminated with the Farm Security and Rural Investment Act of 2002, peanut prices have been determined through market transactions with the first buyers of farmer stock peanuts, in what can be described as a highly concentrated market.  Alternatively, there is more transparency and price data available for cotton with the existence of a futures market.

    Figure 1 shows the relationship between peanut and cotton marketing year average (MYA) prices from 2003 to 2021. The unusually high peanut prices in 2011 and 2012 are from weather-related supply issues.  While there is not a strong trend in the data due to some of the notable outliers, a visual inspection of Figure 1 highlights the positive relationship between these two commodity prices.  For example, when cotton prices have been above 75 cents per pound, peanut prices have been above $450 per ton.  

    Figure 1. Peanut and Cotton Price Relationship: 2003-2021 Marketing Year Averages

    A recent Southern Ag Today article, Navigating the “Winter” in Cotton Farming in 2023, projects an optimistic 2023 futures price for cotton to be 80-85 cents per pound.  Current December 2023 cotton futures prices have been hovering around 80 cents per pound.  At this futures price for cotton, history would suggest a peanut price between $450 and $500 per ton.  

    While this can give farmers a good first estimate of expected prices it must be acknowledged that there can be significant deviation from this range as other factors may affect the price of one commodity that do not move the other prices in the same fashion.  For example, within the range of $450 to $500 per ton for peanuts, the cotton price ranged from a low of $0.478/lb in 2008 to a high of $0.914/lb in 2021.eanut

    Author: Adam Rabinowitz

    Assistant Professor & Extension Specialist 

    adam.rabinowitz@auburn.edu


    Rabinowitz, Adam. “The Peanut-Cotton Price Relationship.” Southern Ag Today 3(2.1). January 9, 2023. Permalink

  • Hydroponic Agriculture and Insurance Coverage

    Hydroponic Agriculture and Insurance Coverage

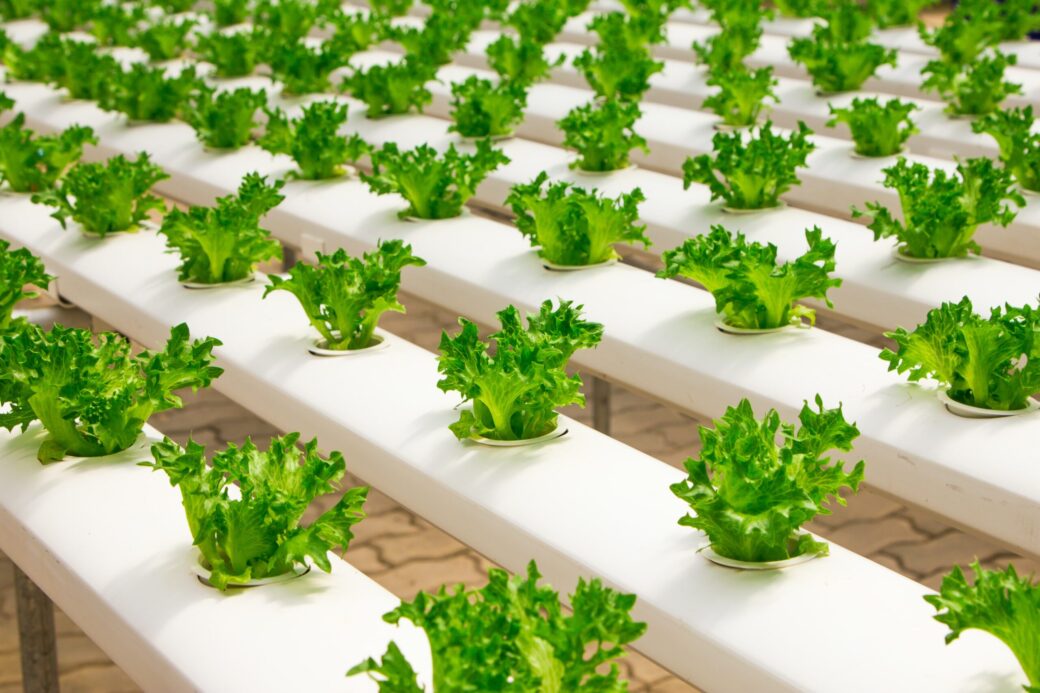
    When one thinks of crops, insurance, and risk, one may think of traditional crop insurance. The case of Three Rivers Hydroponics, LLC v. Florists’ Mutual Insurance Company,[1] decided by the United States District Court of the Western District of Pennsylvania in 2021, illustrates a “business package” insurance policy application to a fast-growing area of agriculture: hydroponic agriculture.[2]

                In the Three Rivers Hydroponics case, the insured was engaged in the business of growing organic basil through a hydroponic ozone system.[3] The ozone system treated and disinfected water utilized for crop production.[4] On June 30, 2014, the ozone system caught fire, and the crop soon failed thereafter.[5] Eventually, the insured lost its business.[6]

                The insured’s business package insurance policy in the case included an Equipment Breakdown Boiler and Machinery Coverage endorsement, in which the insurer agreed to pay for a loss caused by an “Accident” to “covered equipment.”[7] An “Accident” was defined in the policy as a “mechanical breakdown.”[8] Thus, the insured could only recover under the policy if the ozone system had a mechanical breakdown.

                The insured contended that the ozone system failed due to an issue with the ORP controller.[9] Two engineering experts of the Defendant concluded that only the ozone generator sustained damage in the fire and that complete replacement of the system was unnecessary.[10] The insurer issued a payment for replacement of the ozone generator but denied the claim for mechanical breakdown.[11]

                The insured filed a breach of contract claim as well as bad faith claim against the insurer.[12] In examining these claims, the Court noted that whether mechanical breakdown of the ozone system occurred is a “highly technical” matter.[13] However, the insured did not produce any expert testimony of an engineer who opined on whether a mechanical breakdown of the system occurred.[14] Thus, the Court found that the insured did not meet its burden to produce admissible evidence to establish a prima facie case that coverage existed and granted summary judgment to the insurer on the insured’s breach of contract claim.[15] In addition, the Court also granted summary judgment to the insurer on the insured’s bad faith claim as the Court found that the insurer “conducted a substantial, thorough, and timely investigation” as a matter of law.[16]

                The Three Rivers Hydroponics case exemplifies a sometimes overlooked area in agricultural law – the significance of expert testimony in cases involving more technical matters.

    Nothing in this article is intended to create an attorney-client relationship and does not constitute legal advice.


    [1] See Three Rivers Hydroponics, LLC v. Florists’ Mutual Insurance Company, No. 2:15-cv-00809, 2021 WL 6133304 (W.D. Pa. Dec. 29, 2021).

    [2] See Hydroponics, United States Department of Agriculture National Agriculture Library (2022), available at: https://www.nal.usda.gov/farms-and-agricultural-production-systems/hydroponics

    [3] See Three Rivers Hydroponics, LLC V. Florists’ Mutual Insurance Company, 2021 WL 6133304 at *1.

    [4] Id.

    [5] Id.

    [6] Id.

    [7] Id. at *2.

    [8] Id. at *2.

    [9] Id. at *3.

    [10] Id. at *3-7.

    [11] Id. at *7.

    [12] Id. at *1.

    [13] Id. at *10.

    [14] Id. at *10.

    [15] Id. at *15.

    [16] Id. at *16.


    Marzen, Chad. “Hydroponic Agriculture and Insurance Coverage.Southern Ag Today 3(1.5). January 6, 2023. Permalink

  • What If We Don’t Get a Farm Bill in 2023?

    What If We Don’t Get a Farm Bill in 2023?

    One of the questions we have been getting the most as agricultural policy economists is whether we are going to get a 2023 Farm Bill on time.  While there are dedicated teams of ag committee members and staff in the House of Representatives and Senate who are going to do their best to get a farm bill done on time, history is not on their side.  This article isn’t going to focus on the probability or odds of getting a bill in 2023 but rather – how much would it matter if it doesn’t get done? 

    Figure 1 contains our estimate of the mandatory spending associated with programs that will expire on September 30, 2023.  It may come as a surprise to many of our readers that only about 5% of the funding is actually facing the threat of expiration.  Why?  The Supplemental Nutrition Assistance Program (SNAP) is what’s known as an appropriated entitlement.  In other words, if the farm bill expires, the appropriators will continue to fund SNAP.  Beyond that, crop insurance is permanently authorized by legislation outside of the farm bill.  In addition, the Inflation Reduction Act (IRA) recently reauthorized spending for the major conservation programs.  Further, annual appropriations bills have provided significant funding for ad hoc disaster programs over the past four years for programs such as WHIP, WHIP+, and ERP.

    So – what does this information mean?  It means that the impending expiration of the 2018 Farm Bill means very little for the vast majority (i.e., 95%) of the mandatory spending in the farm bill.  It also means that unless policymakers are able to significantly enhance Title I commodity programs, this is little reason to go through the process that invariably will include damaging amendments to farm policy.  While this still leaves a number of programs in limbo (particularly those without mandatory baseline spending),  a simple extension of the 2018 Farm Bill would maintain the status quo.

    Figure 1.  Estimated mandatory spending in the 2018 Farm Bill that will expire on September 30, 2023.


    Outlaw, Joe, and Bart Fischer. “What If We Don’t Get a Farm Bill in 2023?” Southern Ag Today 3(1.4). January 5, 2023. Permalink

    Photograph by Mark Stebnicki

  • Summary of High Avian Influenza in 2022

    Summary of High Avian Influenza in 2022

    As we begin 2023, high path avian influenza (HPAI) continues to devastate the poultry industry across the U.S.  While many experts anticipated a summer lull in outbreaks and maybe even a disappearance like the 2014/15 HPAI outbreak, that was not the case. Since the first case back in February 2022, there has been at least one case of HPAI in a commercial poultry operation in each month in 2022. The total number of birds affected by HPAI in 2022 totaled 57.82 million, with 206 commercial flocks and 409 backyard flocks impacted. To put that into perspective, the HPAI outbreak of 2014/15 had 232 confirmed cases, with over 50 million birds affected. However, most of the 2014/15 outbreak was concentrated to egg layers and turkeys grown for meat in Iowa and Minnesota. The map below illustrates that in 2022, HPAI affected all but three states across the U.S. Most birds affected by HPAI in 2022 were commercial table egg layers, accounting for 75% of the total bird loss (43 million birds). While the southern region is known for broiler production, four of the top ten egg-producing states are in the southern region (Texas, Georgia, Arkansas, and North Carolina). For 2022, a total of 2.7 million birds were impacted by HPAI in the southern region, the largest case being a commercial table egg layer operation.  

    It is anticipated that we will have continued cases of HPAI across the region. The most recent outbreak was in Tennessee on December 28th in a commercial broiler breeder operation. Therefore, you must continue to enforce strict biosecurity measures to manage and protect your flocks. While the federal government provides financial assistance for depopulation, cleaning, and indemnity payments for the birds directly impacted, there are currently no insurance products or federal support from a loss of revenue due to delayed placements and loss of future flocks while houses are cleared of HPAI. Therefore, you should have a management plan in place in for an HPAI outbreak.  

    Source: USDA-APHIS 

    Resources:

    USDA-APHIS. “2022 Confirmations of High Pathogenic Avian Influenza in Commercial and Backyard Flocks”. Available online: https://www.aphis.usda.gov/aphis/ourfocus/animalhealth/animal-disease-information/avian/avian-influenza/hpai-2022/2022-hpai-commercial-backyard-flocks

    Shockley, J.M., T. Mark, K. Burdine, and L. Russell.  “Financial Implications from Contracting Avian Influenza in a U.S. Broiler Operation”. Journal of Applied Farm Economics 3, no. 1 (Spring 2020). Available Online: https://docs.lib.purdue.edu/cgi/viewcontent.cgi?article=1034&context=jafe

    University of Kentucky Ag Logo
    University of Kentucky Ag Logo

    Author: Jordan Shockley

    Associate Extension Professor

    jordan.shockley@uky.edu


    Shockley, Jordan. “Summary of High Pathogenic Avian Influenza in 2022.” Southern Ag Today 3(1.3). January 4, 2023. Permalink