Blog

  • Retail Meat Prices Finally Decline

    Retail Meat Prices Finally Decline

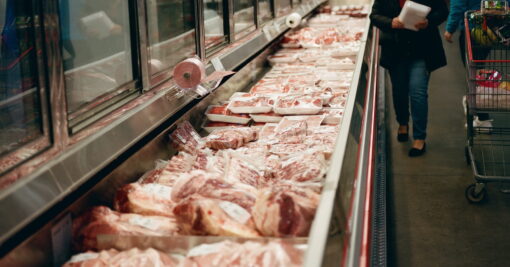
    Retail meat prices have increased to record high levels over the last year and a half, like many other items.  But, unlike other goods, beef, pork, and chicken prices have some unique market characteristics affecting their prices.  This SAT article examines retail beef, pork, and chicken prices that are part of the monthly Consumer Price Index (CPI).  

    Retail pork prices really began to increase in March 2021.  Since then pork prices have increased from $4.17 per pound to $5.05 in October 2022.  The latest CPI report, issued last week, reported retail pork prices in November at $4.95 per pound.  For the first time this year, the retail price was below the prior month.  The average pork price remains above last year, however.  High feed costs, disease issues, and a lack of hog producer profits have kept pork production below a year ago.  Wholesale prices, as measured by the pork cutout value have, generally, been below 2021 most of the year.    

    Retail chicken prices have declined for the last 2 months since hitting a high of $1.89 in September. November’s average price was $1.84 per pound well above the $1.58 of last November and the 5-year average November price of $1.50.  High wholesale chicken cut prices led to increased production earlier this year and now wholesale prices are at or below the five-year average.  

    Like pork prices, retail average Choice beef prices began to increase in March 2021.  They increased from $6.48 in March to a record $7.90 in October 2021.  Since then, retail Choice beef prices have been flat to slowly declining, falling to $7.37 in November.  In contrast to pork and chicken, beef prices have been lower than last year since August.  Drought has forced herd culling which has kept beef production higher than in 2021.  The Choice boxed beef cutout has been lower than in 2021 most of the year.  

    Monthly average retail meat prices have been slow to respond to lower wholesale prices this year.  Several months of declining beef prices have made beef relatively less expensive than other meats.  Falling wholesale prices will allow some room for retail prices to decline further in 2023.  The effect of higher interest rates and tightening budgets for many consumers may change consumer purchasing patterns and allow for further retail price declines in the new year.  

    Merry Christmas from all of us livestock economists at Southern Ag Today! 

    Author: David Anderson

    Professor and Extension Economist Livestock and Food Products Marketing, Dairy, Policy

    danderson@tamu.edu


    Anderson, David . “Retail Meat Prices Finally Decline.” Southern Ag Today 2(52.2). December 20, 2022. Permalink

  • What to Expect from Brazil’s Soybean Crop?

    What to Expect from Brazil’s Soybean Crop?

    As the soybean harvest ends in the United States, it is time for the markets to look to the Southern Hemisphere. Brazil is currently the top soybean producer and exporter in the world and, thus, a significant competitor of the United States in the global export market. Since Brazil is in the Southern Hemisphere, the soybean growing season is opposite that of the United States. In general, soybean planting occurs from October to December, followed by a growth stage in January and February, and harvest in March through June. The timing of production will vary by region. The four largest contributors to soybean production in Brazil are Mato Grosso (28%), Parana (19%), Rio Grande do Sul (14%), and Goias (10%). The development of the Brazilian soybean crop over the coming months will influence any potential spring price rallies.

    Brazil is projected to produce a record 5.58 billion bushels of soybeans (Figure 1), which is 9% higher than their current record from 2020/21. Last year’s soybean crop was initially expected to result in record production, but dry conditions ultimately dampened production to 4.67 billion bushels. Planting was able to start earlier than normal this year, and Brazil is projected to plant 105.8 million acres. Growing conditions currently appear better than last year, with most major growing areas in Brazil receiving adequate rainfall. There is some concern about dry and hot weather in the south of Brazil that could impact production if it continues. Brazilian yield is projected at 52.6 bushels per acre compared to the U.S. yield of 50.2 bushels per acre.

    Since 2012, Brazil has consistently been the largest soybean exporter overtaking the United States. Brazil has, on average, accounted for 51% of world soybean exports over the last five years, and the U.S. averaged 35% of world exports over the same period. In 2022/23, Brazil is projected to export a record 3.29 billion bushels. This projection is based on a sizeable available supply and a favorable exchange rate for the Brazilian real. Brazil is also projected to have a record-high domestic crush of 1.90 billion bushels driven by ample supplies and high demand for soybean products. 

    Weather over the coming months will be critical to Brazil meeting these record production and export projections. As seen last spring, soybean markets responded to production difficulties in Brazil with a price rally through January and February. World soybean ending stocks were at a six-year low coming out of the 2021/22 crop year. With strong global soybean demand, the development of dry conditions in Brazil could lead to a strong rally this spring. On the other hand, if record production is achieved U.S. prices are likely to fall. U.S. producers must keep an eye on Brazil and be prepared to take advantage of marketing opportunities. 

    Figure 1. Brazil Soybean Production, Exports, Crush, and Ending Stocks: 2000-2022

    Source: USDA Foreign Agricultural Service 
    * 2022/23 Projections
    Mississippi state university logo

    Author: William E. Maples

    Assistant Professor and Extension Economist 

    Department of Agricultural Economics 

    Mississippi State University 

    will.maples@msstate.edu


    Maples, William E.. “What to Expect from Brazil’s Soybean Crop?Southern Ag Today 2(52.1). December 19, 2022. Permalink

  • How to Create a Marketing Plan in the Digital Era

    How to Create a Marketing Plan in the Digital Era

    Marketing can feel like a mystery to farmers who are focused on growing their products, responding to changes in weather, and the day-to-day demands of managing a farm. Even more challenging is the fact that marketing has changed dramatically over the last decade. Previously, farmers had two primary marketing channels, packing houses or roadside stands. There are now new sales venues from community supported agriculture, farmers’ markets, direct contracts with the hospitality and retail industries, and online sales platforms. With changing consumer preferences for sustainably and locally grown foods, new avenues to advertise and make sales in the digital age, and the disruption to regional, national, and international food supply chains caused by the COVID-19 pandemic, farmers are finding themselves in a new paradigm. With so many innovative marketing opportunities, they are unsure of which ones to pursue.

    The United States Department of Agriculture Economic Research Service estimated the number of farmers’ markets increased by 180% between 2007 and 2014 and the number of regional food hubs increased by more than 288% (Low et al. 2015). In addition to these structural changes, consumers’ demand for food products has been evolving with a growing demand for locally, sustainably produced goods, organic or otherwise, that are of the highest quality (Roper & Rumble 2018). In 2020, US farmers made $9 billion in direct food sales, and increase of 3% from 2015 (USDA NASS 2022b). Direct food sales in the Southeast accounted for just 7% of these sales, $609 million (USDA NASS 2022a). Florida was the only state in the Southeast that made it to the top ten of direct food sales with $247 million, 41% of the regions total (USDA NASS 2022b). Please refer to https://southernagtoday.org/2022/06/local-food-sales-practices/ for more detailed information on local food sales in the Southeast.

    This proliferation of niche and specialty markets are most accessible to small-scale farmers who are focused on quality and diversity and whose small size makes them nimbler to meet a particular buyer’s requirements and obtain the premiums for meeting them. The ability to participate in a variety of markets allows agribusinesses to have multiple revenue streams to diversify their risk so they can still earn an income when there is a disruption in one market. Farmers in the Southeast, in particular, may have more opportunities to take advantage of direct-to-consumer marketing schemes to be on par with the use of these markets by farmers in other regions of the US (USDA NASS 2022b).

    While creating a marketing plan may seem daunting, it is a straightforward process when broken down into nine easy steps: 

    If you are interested in learning more about creating your own marketing plan and utilizing social media to market your agricultural services and products, you can find workbooks and step by instructional videos in English and Spanish at https://ruralengagement.org/digital-marketing-toolkit/


    References

    Low, Sarah A., Aaron Adalja, Elizabeth Beaulieu, Nigel Key, Steve Martinez, Alex Melton, Agnes Perez, Katherine Ralston, Hayden Stewart, Shellye Suttles, Stephen Vogel, and Becca B.R. Jablonski. (2015). Trends in U.S. Local and Regional Food Systems, AP-068, U.S. Department of Agriculture, Economic Research Service, January 2015. Available at https://www.ers.usda.gov/webdocs/publications/42805/51173_ap068.pdf?v=6801

    Roper, C & Rumble, J. (2018) Talking local: Florida consumers’ reasons for purchasing local food. Available at  https://edis.ifas.ufl.edu/publication/WC176

    United States Department of Agriculture National Agricultural Statistics Service (USDA NASS). (2022a). Census of Agriculture: 2020 Local Food Marketing Practice Survey. 

    United States Department of Agriculture National Agricultural Statistics Service (USDA NASS). (2022b). Direct Farm Sales of Food: Results from the 2020 Local Food Marketing Practices Survey. Available at https://www.nass.usda.gov/Publications/Highlights/2022/local-foods.pdf


    Authors:

    Trent Blare

    Assistant Professor in Food and Resource Economics at the Tropical Research and Education Center, Homestead Florida

    Lauri Baker

    Associate Professor in Agricultural Education and Communication at the Center for Public Issues Education, Gainesville, Florida

    Fredy Ballen

    Data Management Analyst II at the Tropical Research and Education Center, Homestead Florida


    Blare, Trent, Lauri Baker, and Fredy Ballen. “How to Create a Marketing Plan in the Digital Era.” Southern Ag Today 2(51.5). December 16, 2022. Permalink

  • The U.S. and Brazil in International Beef Markets

    The U.S. and Brazil in International Beef Markets

    The United States and Brazil are the leading beef exporters (Figure 1). However, they focus on different markets. Figure 2 illustrates the world trade flow value in 2020. Accordingly, China is the leading destination for Brazilian beef ($4.1bn), while Japan is the primary consumer of American meat ($2bn). Nevertheless, the U.S. has a more diversified client portfolio, with relevant exports to Japan (27%[1]), Korea (24%), Mexico (10%), Hong Kong (8.5%), and Canada (7.5%). As for Brazil, most exports are destined for China (50%), Hong Kong (14%), and Egypt (8.7%). 

    Figure 1 – 2020 Beef Trade: Top, Growing, and Declining Exporters (Value) 

    Source: CHRTD, 2022

    The two countries compete in the Hong Kong market more directly, which imported 42% (309k tons) of its beef from Brazil and 11% (81.3k tons) from the U.S. in 2020. However, when we compare the values of meat imports from Hong Kong, Brazil’s share drops to 39% ($1.1bn), and the U.S. rises to 22% ($635m). Boneless beef cuts (frozen) show America’s superior ability to market its product. Worldwide, American frozen beef had an average premium of 24% over Brazilian meat in 2020. In the case of Hong Kong, that year, Brazil exported 182k tons ($771m) and the U.S. 56.9k tons ($462m) of frozen beef, a 92% premium for the American product. Furthermore, the 2020 Phase One Trade Agreement opened the Chinese market to the U.S., bringing competition from the two largest exporters to the most prominent and growing consumer market.

    Figure 2 – 2020 World Beef Trade (Value) 

    Source: CHRTD, 2022

    Unlike Brazil, the U.S. is a significant beef importer (Figure 3), mainly from Canada ($1.8bn), Australia ($1.5bn), and Mexico ($1.5bn). Australia competes for the Korean and Japanese markets with the U.S. and the Chinese markets with Brazil. Beef trade between the U.S. and Brazil is timid, as the U.S. exported $33m to Brazil and imported $154m from the country between 2015 and 2020 (CHRTD, 2022).

    Figure 3 – 2020 Beef Trade: Top, Growing, and Declining Importers (Value) 

    Source: CHRTD, 2022

    [1] The percentages correspond to the total value exported in 2020.

    Reference

    CHRTD – Chatham House Resource Trade Earth. Trade Data. 2022. Available online: https://resourcetrade.earth/


    Author: Yuri Clements Daglia Calil 

    Assistant Professor and Extension Specialist

    Texas A&M University

    yuri.calil@ag.tamu.edu


    Clemets Daglia Calil, Yuri . “The U.S. and Brazil in International Beef Markets.Southern Ag Today 2(51.4). December 15, 2022. Permalink

  • Prevented Planting

    Prevented Planting

    In the mid-south, the prevented planting provision of crop insurance is of particular importance. Prevented planting claims have grown 500% since 2012 in the Mid-South. The table below illustrates prevented planting indemnities averaged roughly 10% of all crop insurance claims before 2012, growing to an average of 51% of all claims since that time. In contrast, prevented planting claims in the Midwest comprised only 8% of all claims since 2012, highlighting the importance of the provision to Mid-South row crop production. The use of prevented planting in the Mid-South can partially be attributed to a rise in early-season precipitation in the region (over 90% of all prevented planting claims nationally are due to excess moisture-related issues). Row crop acres located in high moisture areas of the delta also contribute. It is critical to understand the important aspects of prevented planting and how to incorporate crop insurance into farm operating plans and financial risk management strategies.

    1) If a prevented planting claim is made and a second harvested crop is not planted, the prevented planting claim will not affect the producer’s APH. 2) If a second crop is planted, the second crop must be insured. The producer will receive 60% of their APH for that year for the first crop and the actual yield for the second crop. The producer will only receive 35% of the indemnity but only pay 35% of the premium owed on the first crop. If there is no claim on the second crop, the producer is eligible to receive the remaining 65% of the prevented planting indemnity for the first crop. Note the producer must also pay the remaining premium on the first crop as well. 3) It is worth being aware that while prevented planting claims do not affect rates through APH, they will typically affect rates through a load factor. Load factors are added to premium rates to help cover administrative costs and to ensure sufficient reserves exist to handle non-yield or extreme claims. Prevented planting adjustments are added through such load factors, and the size of the load will depend on the total amount of prevented planting indemnities made across the state. 4) Before making a prevented planting claim, producers should ensure that they have sufficient eligible acres for the number of prevented planting acres they need to make. A producer is not allowed to claim more prevented planting acres than they have planted in the past. However, a producer can “roll” prevented planting acres into other eligible acres they may have of a different crop. Producers should be sure they have sufficient roll acres of the second crop and that the prevented planting indemnity calculated for the second crop would be sufficient to cover the necessary costs associated with the first crop. 5) Be sure that any land with an intended prevented planting claim satisfies the “1 in 4 rule”. For land to be eligible for prevented planting, it must have been planted, insured, and harvested in one of the last four years. Otherwise, the land must have been adjusted for claims other than excess moisture, flood, or drought in one of the last four years. Land that failed the 1 in 4 rule must meet the mentioned requirement for two consecutive years before becoming eligible again for prevented planting.

    Keeping the above points in mind, producers can reap risk protection from prevented planting without unwanted surprises and/or adversely affecting their crop insurance rates.

    Author: Lawson Connor

    Assistant Professor

    lconnor@uark.edu


    Connor, Lawson. “Prevented Planting.Southern Ag Today 2(51.3). December 14, 2022. Permalink