Blog

  • Fed Cattle Prices Jump Higher

    Fed Cattle Prices Jump Higher

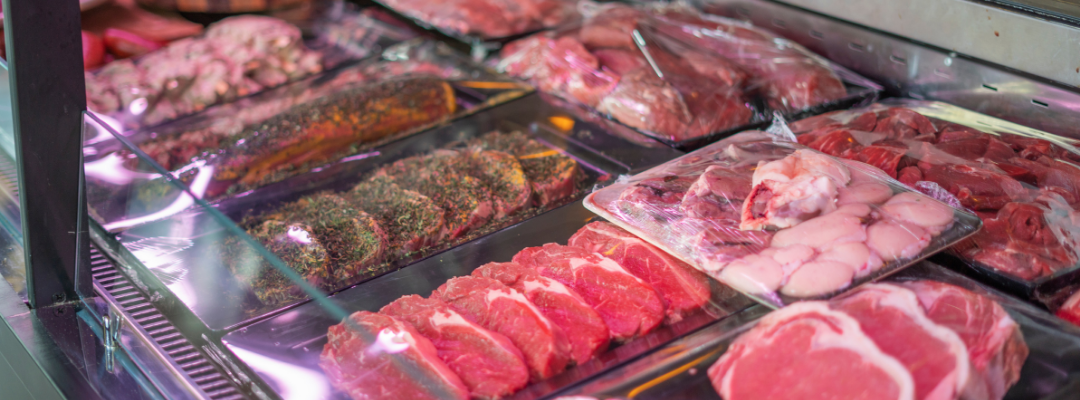
    Fed cattle prices in the Southern Plains jumped a few more dollars per cwt last week to get to $154.71 per cwt.  That was almost $20 per cwt higher than the summer low.  Prices were also the highest since Spring 2015 and the highest for the first week of December since 2014.

    Fed cattle prices typically increase, seasonally, from summer through the end of the year.  This year, there was not much of a summer low with prices trading between $135 and $140 most of the year.  

    Several factors are contributing to rising fed cattle prices.  It appears that slaughter numbers are beginning to decline compared to earlier in the year.  Slightly fewer numbers have packers bidding more for available supplies.  It appears that beef demand continues to support the market.  

    Throughout this year, fewer fed cattle graded Prime than during the corresponding week of the prior year.  That has led to rising premiums for Prime beef.  The national weekly direct slaughter cattle premium for Prime has averaged $23.59 per cwt this year compared to $18.19 in 2021.  The premium was $30.03 per cwt last week marking 11 straight weeks over $30 per cwt.  It surpassed $30 per cwt in only 6 weeks of November and December 2021.  Prior to 2021 the average weekly premium had never surpassed $30 per cwt.

    Higher fed cattle prices are pulling calf and feeder prices along for the ride.  Feed costs drifting lower are helping boost calf and feeder prices.  Georgia 5-600 pound steers have climbed from $160 to $170 per cwt over the last few weeks.  Southern Plains 5-600 pound steers have reached $190 over the same period.  Prices for these calves typically climb through the new year and into March.  

    Author: David Anderson

    Professor and Extension Economist Livestock and Food Products Marketing, Dairy, Policy

    danderson@tamu.edu


    Anderson, David . “Fed Cattle Prices Jump Higher.Southern Ag Today 2(50.2). December 6, 2022. Permalink

  • Looking Ahead to the 2023 Cotton Market

    Looking Ahead to the 2023 Cotton Market

    For planning purposes, it is never too early to think about next season’s opportunities and risks.  To start with, we’re still not settled on the size of the 2022 cotton crop. USDA forecasted the latter back in May at over 16 million bales, and their November forecast is two million fewer.  Many in the southern plains expect more downward revision.  If the old crop carry-out is the currently-forecasted three million bales or fewer, this will be the first contribution to what is shaping up as a tight new crop situation for the 2023/24 marketing year. 

    The second consideration is new crop planting.  Relative prices of competing crops like feedgrains and wheat may induce fewer cotton acres being planted in 2023.  For example, if you take Dec’23 corn futures trading over $6 per bushel and Dec’23 cotton under 80 cents per pound, the result is a historically high ratio of corn futures prices to cotton futures prices.  History suggests that when pre-plant corn futures prices are this high in relation to cotton futures (presently around 8.0), we could expect cotton planted acres around nine million acres, all other things being equal (see Figure 1 below).  

    Obviously, there are other competing crop prices to consider such as soybeans, peanuts, and wheat.  However, the corn:cotton model reflected in Figure 1 does a decent job incorporating the influences of those other competing crops. 

    The third consideration is the lingering drought impact of the fading La Niña.  A relatively dry looking drought map implies at least average, if not above average, abandonment of cotton acreage in the southern plains for the 2023 crop, which will increase U.S. average cotton abandonment.  Nine million planted acres of cotton with average abandonment implies potentially very tight supplies for the 2023/24 marketing year.  It might imply an in-season weather market, with market volatility in anticipation of (or reaction to) milestone supply reports from USDA. 

    In short, there may be stronger new crop prices, but they may gyrate sharply between planting and harvest, which is typically volatile weather market behavior.  

    Figure 1. U.S. All Cotton Planted Acreage and Ratio of New Crop Corn:Cotton Futures Ratio.

    Author: John Robinson

    Professor and Extension Economist

    jrcr@tamu.edu


    Robinson, John. “Looking Ahead to the 2023 Cotton Market.” Southern Ag Today 2(50.1). December 5, 2022. Permalink

  • The Potential Implications of Large-Scale Solar Development: A Case Study on Maryland’s Agricultural Industry

    The Potential Implications of Large-Scale Solar Development: A Case Study on Maryland’s Agricultural Industry

    Maryland has the most significant solar, specific carve-out of any state at 14.5% energy generation sales by 2028 (1) – the majority of which will be produced through utility-scale solar operations. Utility-scale solar is a solar energy generating system that sells electricity through power purchase agreements or into the wholesale electricity market (2). Utility-scale solar facilities are usually owned by a generation company and require a Certificate of Public Convenience and Necessity (CPCN) to be developed and connected to the grid (2). 

    Although there are mandatory considerations and research-based claims to prioritize solar development on non-farmland, that has not been the case in Maryland and other states. In Maryland, only one of the currently built utility-scale solar projects is not on “Prime Farmland” or “Farmland of Statewide Importance,” as defined by the Natural Resources Conservation Service (NRCS). More specifically, 44% of utility-scale solar acres developed are on “Prime farmland,” 48% on “Farmland of statewide importance,” and 8% on “Not prime farmland.”

    Producers who own land are acting as rational economic agents, given the estimated additional gross revenue utility-scale solar can generate for the landowner compared to traditional crop rotation gross annual farm profits. In the lefthand column of the following table is the range of annual gross rental rates, less the land payment or land cost[1], a commercial corn-soybean field rotation receives per acre in Maryland[2]. The first row shows the range of utility-scale solar rental payments collected from focus groups and leases. The most likely outcome amongst the ranges of annual gross revenues for a farmer who transitions land from farmland to solar generation in Maryland would be a ~350% increase in gross revenue per acre. 


    The ambitious renewable energy generation goals of Maryland, paired with the financially attractive offers landowners are receiving, have and look to continue to result in the development of utility-scale solar generation facilities on farmland. The continuing increase in renewable energy generation, like large-scale solar generation, will likely result in the loss of farmland nationwide. It would be advantageous for the Southern region to conduct outreach and research to determine the impacts of farmland loss on renewable energy generation.  

    This work is supported by the Agriculture and Food Research Initiative (AFRI) program, grant no. 2020-68006-31182/project accession no. 1022637, from the U.S. Department of Agriculture, National Institute of Food and Agriculture.

    Any opinions, findings, conclusions, or recommendations expressed in this publication are those of the author(s) and should not be construed to represent any official USDA or U.S. Government determination or policy.

    1. Renewable Energy Development and Siting, (2020, August 14). Governor’s Task Force on REDS –Final Report. Retrieved November 18, 2022, from https://docs.google.com/presentation/d/1F4wXH9XD9Tbozab6gpuhLg4tmuGJSw52/edit#slide=id.p13
    2. Maryland Public Service Commission. (2022, October 7). Solar in Maryland – Maryland Policies. Electricity – Renewable Energy. Retrieved November 18, 2022, from https://www.psc.state.md.us/electricity/renewable-energy/solar-in-maryland/ 

    [1] The land payment or cost is assumed to be the same per acre between farmland and land developed into solar fields

    [2] Derived from University of Maryland Extension Enterprise Budgets (https://extension.umd.edu/programs/agriculture-food-systems/program-areas/farm-and-agribusiness-management/grain-marketing/crop-budgets)


    Thilmany, Elizabeth. “The Potential Implications of Large-Scale Solar Development: A Case Study on Maryland’s Agricultural Industry.” Southern Ag Today 2(49.5). December 2, 2022. Permalink

  • China Emerges as a Leading Destination for U.S. Beef Exports

    China Emerges as a Leading Destination for U.S. Beef Exports

    China’s demand for beef is breaking records and imports have increased to unprecedented levels in recent years. Since 2010, Chinese beef imports (carcasses and muscle cuts) increased from less than $100 million to nearly $12.5 billion by 2021 (14,000% increase), making China the world’s largest beef importing country (UN Comtrade, 2022). In years past, beef was not a major protein source in China, but economic growth and exposer to western diets has increased beef awareness. Due to several factors (higher incomes, health awareness, protein shortages due to African swine fever), Chinese consumers have diversified their diets away from pork, the traditional animal protein (Muhammad et al. 2022). Beef demand is outstripping supply in China, resulting in rising imports. Consequently, U.S. beef exports to China have increased to record levels.

    It was not that long ago that the Chinese government banned U.S. beef after the discovery of bovine spongiform encephalopathy (BSE) in 2003. Almost 14 years later (May 2017), the China government reopened its market to U.S. beef, but not without restrictions. In January 2020, however, the United States and China signed the Phase One Trade Agreement, where China expanded the scope of beef products imported, eliminated age restrictions on slaughtered cattle, and recognized the U.S. beef traceability system. As a result, U.S. beef exports to China significantly grew. Since 2017, U.S. beef exports to China grew from $31 million to $1.6 billion in 2021, an increase of 4,800% increase (Hanzel 2021; USDA, FAS 2022).

    Figure 1 shows the volume in metric tons (MT) of U.S. beef and beef product exports to major destination markets: Japan, Mexico, South Korea, Hong Kong, Canada, Taiwan, and China. In 2017, when the Chinese market was reopened to U.S. beef, sales to China were less than 3,000 MT and a fraction of sales to other major markets. In 2021, however, China became the 4th largest destination for U.S. beef and beef product exports (191 thousand MT), behind Japan (318 thousand MT), South Korea (277 thousand), and Mexico (201 thousand). Year-to-date exports in 2022 suggest that China will be the 3rd leading destination, and possibly the 2nd leading destination if this trend continues. Note that exports in 2022 to all major destinations except China have either decreased (Japan, Mexico, and Hong Kong) or remained relatively the same when compared to last year. Exports to China, however, increased to 192 thousand MT as of September 2022, a 39% increase when compared to the previous year. At this rate, U.S. beef exports to China will be on par with South Korea and Japan.

    Figure 1. U.S. beef and beef product exports by major destination country: 2017-2022

    Source: USDA, Foreign Agricultural Service, Global Agricultural Trade System (GATS) (2022)

    References

    Hanzel, M. (2021). Beef – New to China Market Product Report. 2021. Report Number: CH2021-0016. U.S. Department of Agriculture, Foreign Agricultural Service.

    Muhammad, A., C. Valdes, K. DeLong, and C. Grebitus (2022) “The Rise of Beef Demand in China: How Competitive is U.S. Beef when compared to Brazil and Other Major Exporters?” Arizona Food Industry Journal, Dec. 2022 (forthcoming)

    U.S. Department of Agriculture, Foreign Agricultural Service (2022). Global Agricultural Trade System (GATS)https://apps.fas.usda.gov/GATS/default.aspx

    Author: Andrew Muhammad

    Professor and Blasingame Chair of Excellence

    amuhamm4@utk.edu


    Muhammad, Andrew . “China Emerges as a Leading Destination for U.S. Beef Exports.Southern Ag Today 2(49.4). December 1, 2022. Permalink

  • Current Non-Real Estate Farm Debt

    Current Non-Real Estate Farm Debt

    Through 2022, the ag sector in the Southern Ag Today (SAT) states has sustained periods of drought, volatile prices in respective markets, and interest rate hikes. As mentioned in a previous article (Martinez and Ferguson 2022), it is crucial to know where agriculture debt is in our SAT states during these unusual times. This article covers the latest commercial bank reports from the U.S. commercial quarterly performance reports. As a refresher, these reports highlight agricultural loans and the loans’ status (on time or late). Figure 1 displays the total loan volume (yellow line) and total loan volume for all three late type volumes (30-89 days late, 90+ days late, Non-Accrual) for the last seven quarters. The totals are for all the Southern Ag Today States. 

    Through the third quarter of 2022, non-accrual loans and 90+ days late have continued downward trends. Non-accrual loan volume continued to decrease and is down 65% from a year ago. While 90+ days late loans stayed relatively steady. A real positive sign is seen in the total debt volume for loans that are 30-89 days late. The total volume of debt in this category is down $4 billion compared to a year ago. These are positive signals that bad loan debt load hasn’t increased during this turbulent year. All three late and bad loan types continue to show signs of good debt health for the SAT states, and this is reinforced by the total loan volume being approximately unchanged from a year ago.   

    As producers navigate through this environment, the current status of commercial ag debt appears healthy and even improving. In the coming months, it is essential that producers are mindful of their working capital, and they should continue the positive strategies that they have implemented thus far. 

    References

    Martinez, Charley, and Haylee Ferguson. “Current Non-Real Estate Farm Debt.” Southern Ag Today 2(30.3). July 20, 2022. Permalink


    Martinez, Charley, and Haylee Ferguson. “Current Non-Real Estate Farm Debt.” Southern Ag Today 2(49.3). November 30, 2022. Permalink