Blog

  • Farming to Breakeven in 2024

    Farming to Breakeven in 2024

    With an entire month of the new year behind us, meeting season is in full swing. This season is a time when many agricultural economists get the opportunity to provide market outlooks for the upcoming year for the commodities producers grow and the inputs used to grow them. Last week, a producer approached me at the end of one meeting and commented that it appears like they may be “farming to breakeven in 2024.”That comment gave me an idea for a teachable moment on planting decisions and variable costs. 

    Producers’ decisions on what they plant are based on a variety of factors including crop rotation, yield history, expected market prices, estimated input costs, weather expectations, and availability of credit. Planting decisions are a short-run decision (i.e. decisions that impact the current crop year). On the other hand, long-run decisions impact multiple years (i.e. investing in irrigation equipment). When making decisions in the short-run, it is important to cover total variable costs. Total variable costs for a crop are what it costs to plant, grow, harvest, and market the crop. Producers should calculate their cost of production to help them calculate the market prices and/or yields they need to achieve to cover their variable costs.

    Given a producer is able to estimate their cost of production, there are two ways to calculate breakeven. The first is through calculating the price needed to breakeven. Breakeven price can be calculated through the following formula:

    Breakeven Price per Unit of Yield = Total Variable Cost per Acre/Expected Yield per Acre

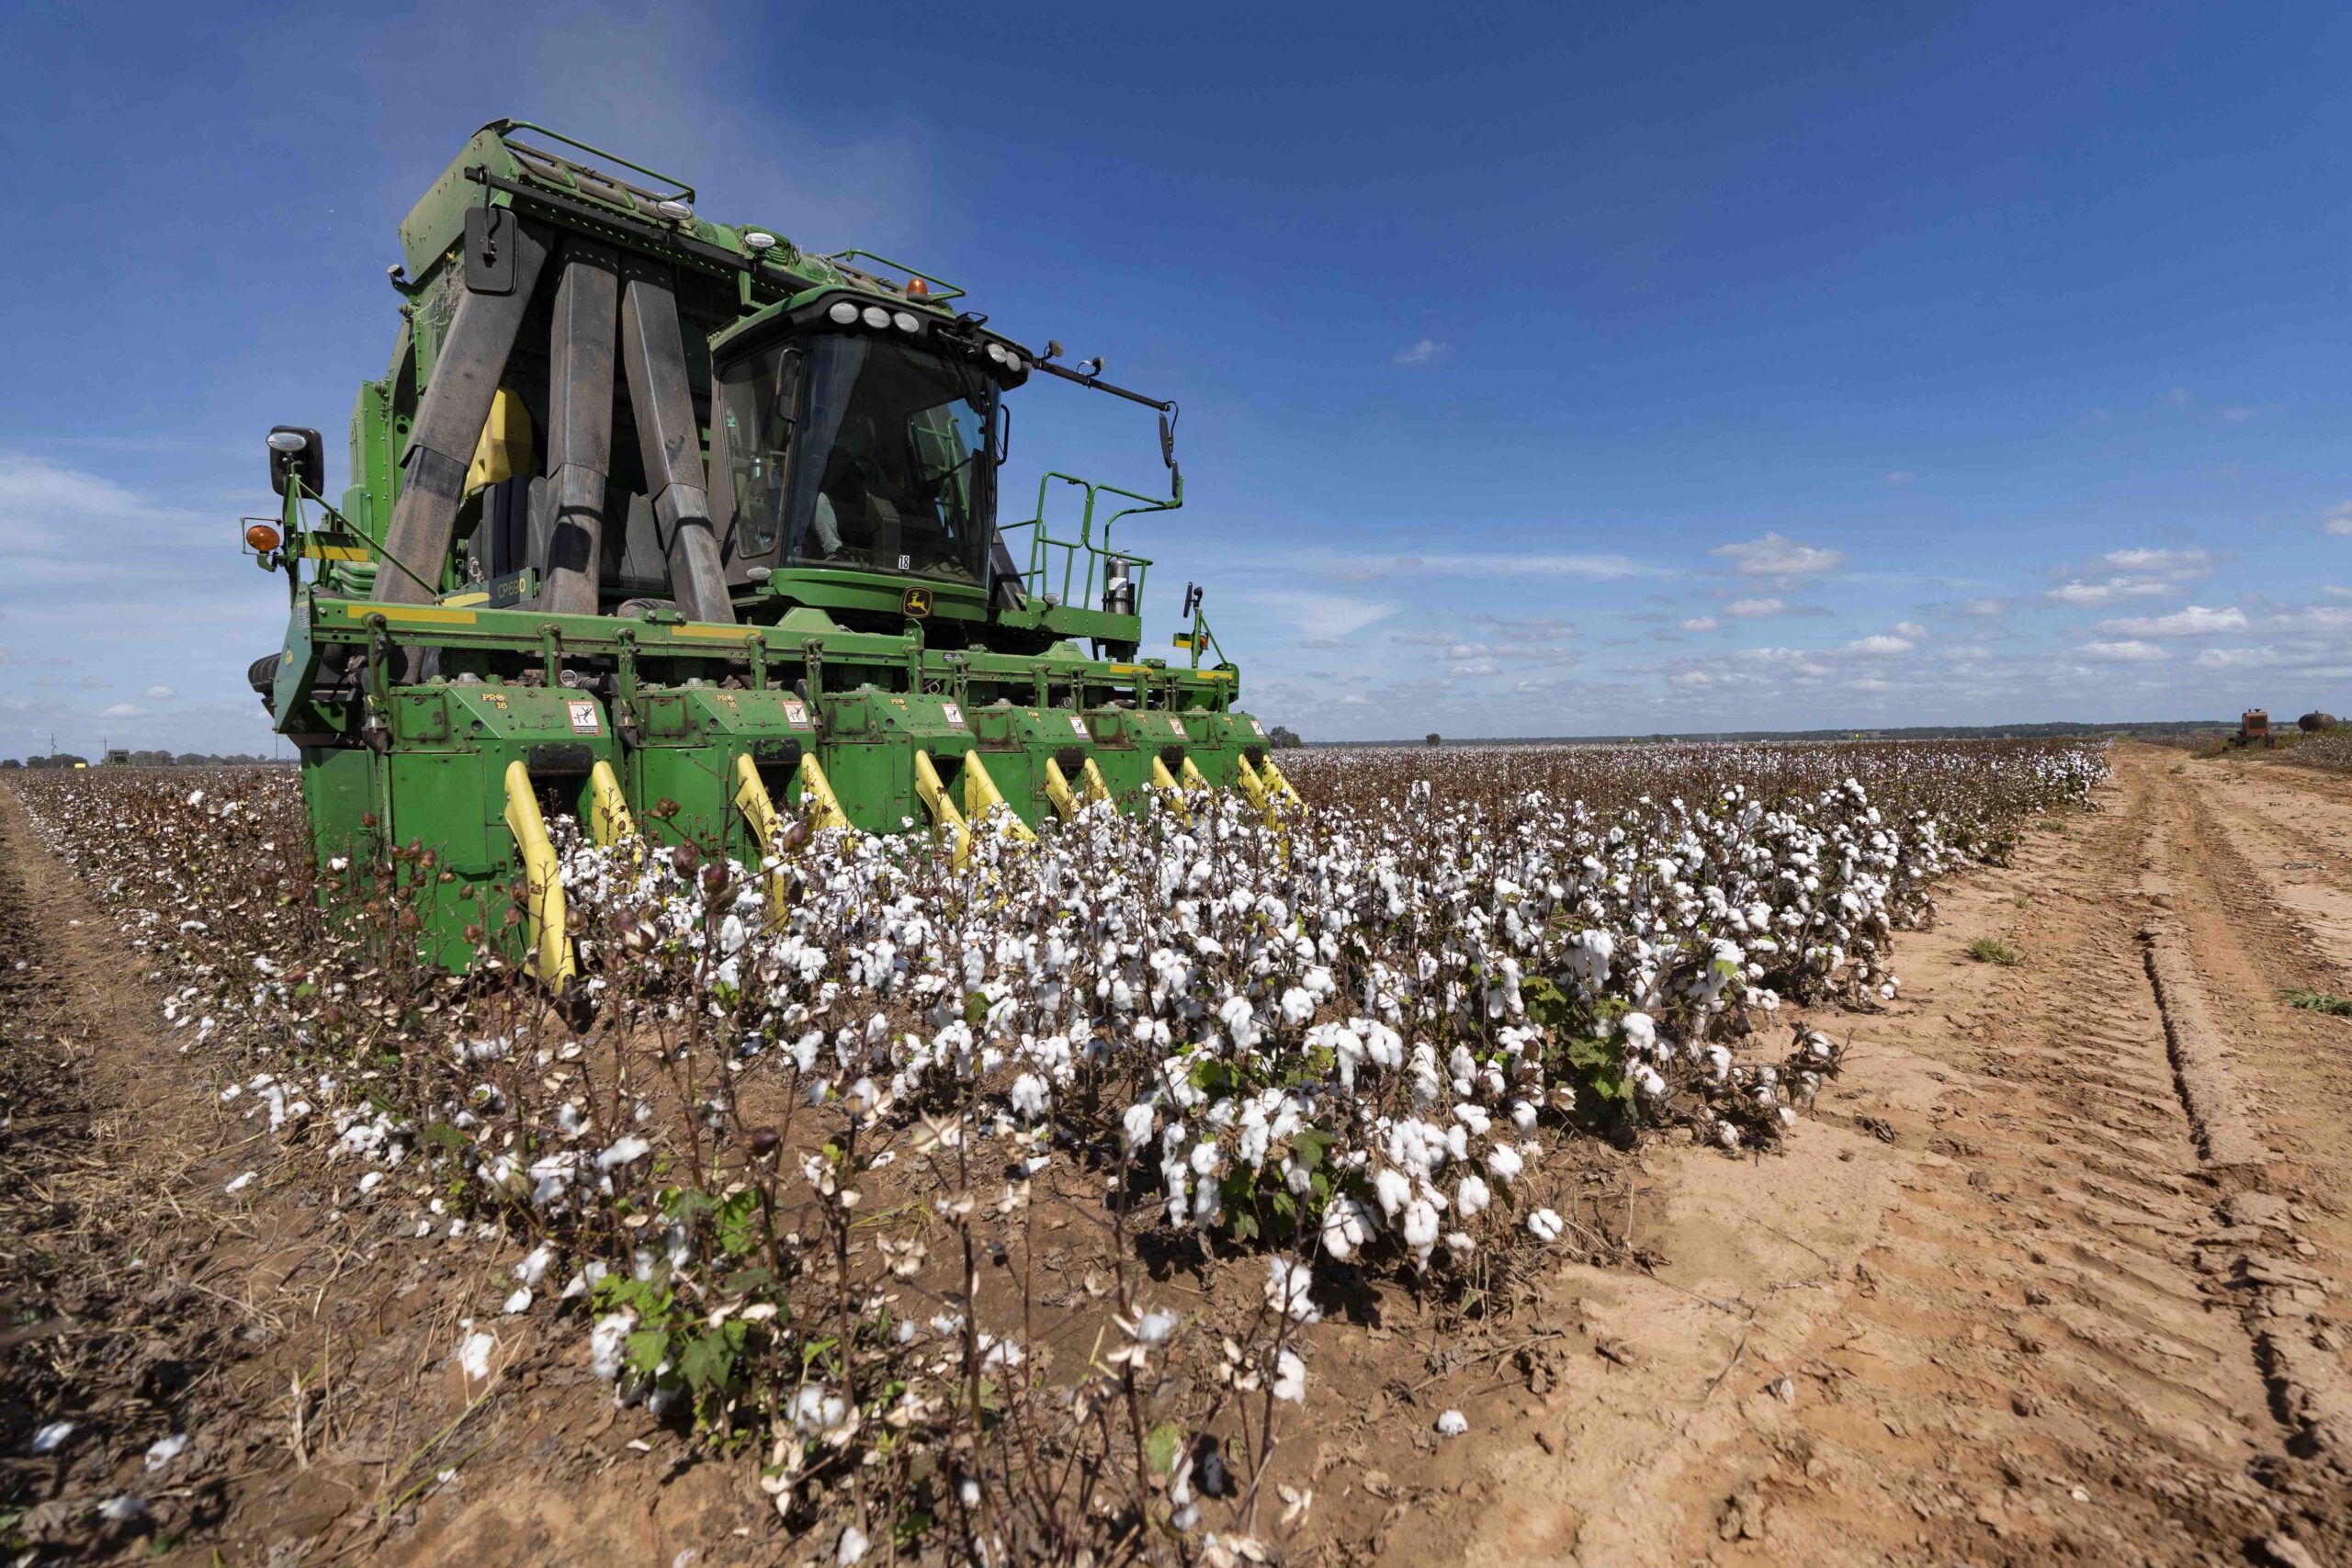
    Imagine a producer in Georgia who plans to rent irrigated cropland and grow cotton on that rented land. The producer downloaded the 2024 Irrigated Cotton enterprise budget from the University of Georgia Extension web page to help them estimate the total variable cost at $679 per acre. They are also aware that the Georgia state average cash land rent for irrigated cropland was $234 per acre last year, according to the USDA National Agricultural Statistics Service. With the land rent added, total variable costs are estimated to be $913 per acre. Based on historical production on this land, the producer expects an irrigated cotton yield of 1,200 pounds per acre. The calculation for the breakeven price follows:

    $913 per acre / 1,200 pounds per acre = $0.76 per pound

    The producer will need to average of $0.76 per pound to breakeven on a projected yield of 1,200 pounds per acre on the rented irrigated land.

    The second way to calculate breakeven is through yield. Breakeven yield can be calculated through the following formula:

    Breakeven Yield per Acre = Total Variable Cost per Acre/Expected Price per Unit of Yield

    The same producer decides to plug in the harvest time futures price for cotton, adjusted for basis, for the expected price. As of the writing of this article, Dec24 cotton was trading around $0.805 per pound.  The producer decides to use $0.775 per pound (Dec24 adjusted lower for local basis). The calculation for the breakeven yield follows:

    $913 per acre / $0.775 per pound = 1,178 pounds per acre

    The producer will need an average yield of 1,178 pounds per acre to breakeven at a price of $0.775 per pound on the cotton grown on that rented land.

    Individual producers should keep in mind that their variable costs and cash land rents may differ. Producers are encouraged to utilitze tools like enterprise budgets to help them estimate their cost of production, breakeven prices, and breakeven yields. Understanding breakeven prices and yields can aid producers in management and marketing for the upcoming production season.

    Sources/Resources:

    Liu, Y., A.R. Smith, & G.A. Hancock. 2024 Irrigated Cotton Row Crop Enterprise Budget. https://agecon.uga.edu/extension/budgets.html

    USDA National Agricultural Statistics Service, US and States Cash Land Rents Survey Results. https://quickstats.nass.usda.gov/results/58B27A06-F574-315B-A854-9BF568F17652#7878272B-A9F3-3BC2-960D-5F03B7DF4826


    Smith, Amanda R. “Farming to Breakeven in 2024.Southern Ag Today 4(6.3). February 7, 2024. Permalink

  • Thoughts on the Cattle Inventory Report

    Thoughts on the Cattle Inventory Report

    USDA released the annual Cattle inventory report on January 31st.  Here are some thoughts and reactions to the report from our SAT livestock economists.

    Kenny Burdine – University of Kentucky

    The decrease in beef cow numbers during 2023 was very much in line with expectations – cattle supplies will remain tight. The percent decrease in heifer retention was smaller than what was estimated from 2022 to 2023, but the numbers retained was still lower. Unless there is a major drop in cow culling during 2024, it is hard to imagine the cowherd being larger in 2025. Put simply, the supply picture remains very bullish and futures markets responded positively on the day after the report.

    Consistent with monthly estimates, January 1 on-feed inventory above (+1.6%) year-ago levels due to timing of placements, live cattle imports, heifers on feed, and increases in the number of days on feed in the latter part of 2023. This will likely change over the course of 2024.

    I was surprised by the small increase in beef cow numbers in Kentucky. Based on cows moving through auction yards and impressions from my Extension travel, I fully expected another decrease in beef cow inventory. In fact, Kentucky was the only top 10 beef cow state that saw a year-over-year increase. Over the last few years, I have sensed a bit of a transition away from cow-calf interest and more towards backgrounding and stocker cattle. We have also lost a good deal of pasture ground to row-crops (and some to development) over the last several years, which is also relevant to the discussion.

    Will Secor – University of Georgia
    Georgia’s all cattle and calves inventory followed the national trend, dropping by 2% year-over-year. The number of beef replacement heifers stood out as they are down by about 5.5%, much more than the aggregate number. This is also a bigger drop than the number of beef cows that have calved (down 4%). These not only point to a lack of a turnaround, but that herd expansion may be slower as we start from an even smaller base when the rebuild does start.

    Max Runge and Ken Kelley – Auburn University

    Alabama’s Cattle and Calves January 1, 2024, inventory was 6.4 percent lower than January 2023. This is the fewest number of cattle in the state since 1943 and the largest percentage decrease in 20 years.  Dry weather, lower hay availability, and poor winter grazing growing conditions (record low temperatures at the end of 2022 and a dry fall in 2023) have contributed to fewer cattle on farms.  Beef cow replacement heifers were 10 percent fewer than the year before.   Alabama dairy cattle inventory remained the same as the previous year.

    Hannah Baker – University of Florida

    Florida numbers for beef cattle declined by 3% from 888,000 to 862,000, but we are still ranked number 9 in beef cow production as decline in the top 8 states ranged from 2%-6%, with the exception of KY. The number of replacement heifers also declined by 4% in Florida, indicating that most producers are not rebuilding yet. The start of expansion in Florida will depend on the current and future management of forage and the timing of La Niña’s appearance. With the majority of Florida producers being in cow-calf sector, the focal point will be on feeder calf prices, and they certainly have not peaked and are not expected to peak at least over the next couple of years. Additionally, the value of female cattle will continue to rise once expansion becomes reality. The open-ended question: is the national cattle herd still declining or will we start seeing stabilization in 2024? Will producers continue taking advantage of high prices instead of rebuilding? 

    David Anderson – Texas A&M AgriLife Extension Service

    Texas’ beef cow herd declined by 4.3 percent, to 4.115 million head.  While the national cow herd eclipsed the lows following the drought of 2010-2012 there are more cows in Texas than following that drought (4.1 million in 2024 compared to 3.9 million in 2014).  More beef heifers were held back for herd expansion than the prior year.  

    Anderson, David, Kenny Burdine, William Secor, Max Runge, Ken Kelley, and Hannah Baker. “Thoughts on the Cattle Inventory Report.” Southern Ag Today 4(6.2). February 6, 2024. Permalink

  • Cotton Acreage and Relative Prices

    Cotton Acreage and Relative Prices

    The first step to forecasting new crop supply and demand involves focusing on planted acreage. Economists emphasize the influence of price, i.e., that of cotton as well as the prices of competing spring-planted crops.  For example, the average new crop corn:cotton price ratio in the first quarter of the year (currently 6.1)  suggests between 10.5 and 11.0 million acres of U.S. all cotton planted in 2024.

    We can be a little more quantitatively precise than just eyeballing Figure 1.  A simple regression of cotton acreage as a function of the new crop corn:cotton ratio would predict 10.8 million acres of cotton planted.  This is based on more observations, going back through the Fall.

    But even with a presumably accurate point estimate, there are reasons to believe that number might be too high. First, general inflation has created a new threshold for input prices. While the cotton price is higher than the long-term average, the cost of inputs has accelerated faster than the output price, meaning that even at 80 cents with typical yields, many producers will be at or below their total cost of production. Even though 80 cents will often cover variable costs, that level of potential loss is unattractive. Who would have thought that 80-cent cotton would not be profitable? Not many. But the elevation of costs of production has brought us to a point where historical relationships are probably not nearly as accurate for predicting future behavior.

    Additionally, the insurance price for contracts this year are currently in the 80-cent range, which means that the revenue floor provided by insurance will not cover costs of production either (assuming 65-75% coverage levels). This fact will likely cause financers to demure on providing high levels of production loans. For those that self-finance, this locks in modest losses should a crop failure happen. Again, this makes planting less attractive. 

    Taken together, these facts suggest that simple models of planted acres are likely overstating intentions. It could be that cotton “loses least” in many producer portfolios, and they go ahead and plant cotton. But, producers with other alternatives may find cotton is not the best alternative.  


    Hudson, Darren, and John Robinson. “Cotton Acreage and Relative Prices.” Southern Ag Today 4(6.1). February 5, 2024. Permalink

  • WOTUS Update

    WOTUS Update

    2023 was a landmark year for Clean Water Act (“CWA”) regulation with a new definition of the key term “waters of the United States” (“WOTUS”) issued by the Environmental Protection Agency (“EPA”) at the start of the year, a Supreme Court decision released in May, and an updated WOTUS definition from EPA in August. While 2024 is unlikely to be as dynamic as the previous year, on-going lawsuits challenging EPA’s updated WOTUS definition will continue to impact how the CWA is implemented throughout the country.

    By the end of 2023, the current WOTUS definition that EPA released last August was enjoined in twenty-seven states. These states initially filed three separate lawsuits against EPA to challenge the WOTUS definition the agency released in early 2023. They have since updated those lawsuits to address the updated WOTUS rule EPA released following the Supreme Court’s ruling in Sackett v. EPA to conform the definition to the Court’s decision. 

    The arguments raised by the plaintiff states in all three lawsuits are largely similar. In their initial filings challenging the first of EPA’s 2023 WOTUS definitions, plaintiffs in State of Texas v. EPA, No. 3:23-cv-00017 (S.D. Tex.), State of West Virginia v. EPA, No. 3:23-cv-00032 (D. N.D.), and Commonwealth of Kentucky v. EPA, No. 23-5343 (6th Cir.) raised three primary claims. First, that the 2023 WOTUS definition exceeded the authority granted to EPA by the CWA. Second, that the definition violates the Tenth Amendment of the United States Constitution which delegates the power to regulate land and water resources to the states. Finally, the definition violates the Major Questions Doctrine because Congress did not give EPA clear authorization to adopt the 2023 WOTUS rule.

    After the Supreme Court issued its decision in Sackett v. EPA, all three of the lawsuits challenging EPA’s WOTUS rule were stayed while EPA revised the definition to bring it in line with the Court’s ruling. EPA released its updated WOTUS definition in August, removing references to wetlands that did not share a continuous surface connection with jurisdictional waters, and references to any waters that were not “relatively permanent.” Shortly afterwards, the plaintiff states revived their lawsuits, pivoting to challenge EPA’s updated WOTUS rule.

    The amended lawsuits make largely the same arguments against the updated 2023 WOTUS rule as they did against the initial 2023 WOTUS rule. Once again, the states argue that the WOTUS definition exceeds the authority granted under the CWA, claiming that the updated definition incorporates waters that are outside of the relatively permanent test the Supreme Court articulated in the Sackett ruling. Similarly, the states claim that updated definition continues to violate both the Tenth Amendment and the Major Questions Doctrine by regulating an area of vast economic importance without clear Congressional authorization. Additionally, the states claim that the updated WOTUS definition was issued without an opportunity for public comment in violation of federal law.

    The National Agricultural Law Center will continue to provide updates as these cases progress. For more information on WOTUS, check out the resources available on our website.

    Rollins, Brigit. “WOTUS Update.Southern Ag Today 4(5.5). February 2, 2024. Permalink

  • Proposed Safety Net Choice Could Add Risk to Farmers

    Proposed Safety Net Choice Could Add Risk to Farmers

    In a January 17th Dear Colleague letter, Senator Debbie Stabenow (D-MI), Chairwoman of the Senate Committee on Agriculture, Nutrition, and Forestry, outlined her proposal for strengthening the farm safety net in the 2024 Farm Bill (found here). The proposal centered around five key principles:

    • programs must be targeted to active farmers;
    • we need to provide farmers choices and flexibility;
    • assistance should be timely;
    • we need to expand the reach of programs to help more farmers; and
    • we need to address the emerging risks farmers face.

    Since the letter was released, considerable attention has been paid to the comments she offered about crop insurance and providing producers expanded safety net choices.  Part of the proposal reads as follows: 

    “The 2018 Farm Bill provided cotton farmers with a choice between the traditional base acre programs and a highly-subsidized and streamlined area-based crop insurance policy. The next Farm Bill should give a similar option to all commodities.”

    There is a considerable amount of detail about the evolution of the cotton program – from removing lint as a covered commodity to adding seed cotton as a covered commodity – that is not contained in the letter.  In this article, I walk through the history to provide more context.  

    First, to resolve the decade-long WTO Brazil cotton dispute (which involved, among other things, the U.S. Government having to pay the Brazilians $147 million per year in cash to fend off retaliation), cotton industry leadership suggested removing cotton as a covered commodity for Title I commodity programs (PLC and ARC) and modifying the marketing assistance loan.  Second, in lieu of ARC/PLC, the 2014 Farm Bill provided cotton producers an industry-proposed area-wide insurance program, the Stacked Income Protection Plan (STAX).  The premium subsidy for STAX was 80%, higher than the 65% subsidy authorized for the Supplemental Coverage Option (SCO) that is available for all crops. Third, upland cotton producers were provided Cotton Transition Assistance Payments (CTAP) for 2014 to aid in the transition to STAX.  

    STAX protection was deemed insufficient to protect cotton producers from collapsing prices, so cotton ginning cost share (CGCS) payments were provided for the 2015 and 2016 crop years. Ultimately, the Bipartisan Budget Act of 2018 restored ARC and PLC protection to cotton producers by adding seed cotton as a covered commodity.  While STAX was still available to seed cotton producers, they could not enroll their seed cotton base in ARC/PLC and still purchase STAX on the farm in the same year – they were required to decide between the two options.  

    Requiring producers to make the choice between ARC/PLC and STAX was a political compromise required at the time to get cotton added back to the farm bill.  While there is certainly merit to expanding STAX to other crops – or simply improving SCO and the Enhanced Coverage Option (ECO) that are already available to all crops – I would argue that now is the time to eliminate the requirement altogether (rather than expanding it to other crops).  While there has long been a prohibition between the purchase of SCO and ARC – because both offer area-wide coverage and they are very similar in design – there is little justification for requiring producers to choose between PLC and area-wide coverage, both of which serve vastly different safety net functions.

    To illustrate the challenges presented by such a choice, consider the following for cotton.  Figure 1 indicates the share of annual upland cotton insurance liability covered by STAX and the share of policies sold.  Producers initially utilized STAX; however, after a few years of unsatisfactory results, the share of liability covered and policies sold declined.  In 2019, when producers actually began a crop year with a choice of ARC/PLC or STAX, the percent of liability covered by STAX, as well as the share of upland cotton policies sold, was relatively low as marketing year average prices (MYAP) were low (Figure 2).  After that, due to Reference Prices not keeping up with input costs (and due to a relatively higher initial insurance price), seed cotton producers moved back to STAX in 2021, 2022 and 2023, with STAX still accounting for just 20% of the policies sold. 

    As for the 2024 growing season – with futures prices currently below the cost of production for most growers – growers must now choose between (1) an ineffective ARC/PLC with Reference Prices that have not kept up with inflation or (2) STAX, which can certainly help, but at most will partially offset significant losses they are almost guaranteed to face (absent well-above-expected prices or yields). In other words, growers are faced with two poor options.

    After nearly 40 years of working on farm policy, it seems clear to me that there is a need for both (1) improving Reference Prices in Title 1 and (2) improving area-wide coverage in crop insurance, particularly since the two were designed to work in tandem.  It certainly isn’t clear that expanding the choice that was forced on cotton producers to everyone else without higher reference prices is much of a choice.

    Figure 1.  STAX Share of Cotton Crop Insurance Liability and Policies Sold.

    Figure 2.  Historic Cotton Prices.


    Outlaw, Joe L. “Proposed Safety Net Choice Could Add Risk to Farmers.Southern Ag Today 4(5.4). February 1, 2024. Permalink