Blog

  • June Acreage Report Shows Larger Acreage Decline for Peanuts and Rice

    June Acreage Report Shows Larger Acreage Decline for Peanuts and Rice

    The United States Department of Agriculture (USDA) released the annual Acreage report on June 30, 2026. Estimates of acreage planted are largely based on surveys completed between May 28 and June 19, from a sample of approximately 90,300 farm operators. This is the first release of 2026 acreage estimates since the March Prospective Plantings. The total planted acreage for all principal crops is estimated at 309.6 million acres, down 0.1% from the 310 million acres estimated in March.  This also represents a 0.6% decrease from the 311.5 million acres planted in 2025.  The principal crop acreage for southern states is estimated at 69.4 million acres, down from the 69.6 million acres planted in 2025 and estimated in March for 2026.

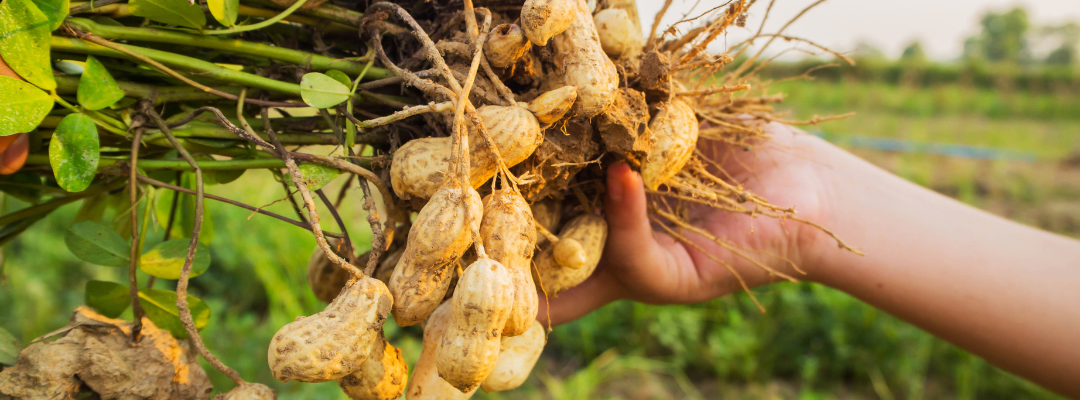
    While the overall acreage estimates for all principal crops are essentially flat, there are some individual crop specific differences.  Table 1 shows the June 2026 Acreage report estimates for corn, wheat, long-grain rice, soybeans, peanuts, and upland cotton in the southern states.  Comparisons to the March 2026 Prospective Plantings report and 2025 actual acreage are presented, with percent changes calculated for each.  The largest percent deviation from the March intentions was for long-grain rice (down 16%) and peanuts (down 8.6%).  Both of those crops also represent large decreases in acreage compared to actual 2025 plantings, with long-grain rice down 35% and peanuts down 21.8%. Decreases in acreage of long-grain rice and peanuts compared to 2025 are estimated across all producing states in the region, with the exception of peanut production in Oklahoma, which is flat. 

    Upland cotton and soybean acreage in southern states are the two crops presented in Table 1 that are estimated to increase in acreage. Compared to 2025, cotton is up 6.8%, and soybeans are up 10.1%. These acreage estimates are also higher than the reported March planting intentions for these crops. All southern states reported an increase in acreage for cotton compared to 2025, except Arkansas (-9.6%) and Virginia (-17.8%), while only Virginia (-6.7%) has an estimated decrease in soybean acreage. Corn acreage is also expected to be down across the southern states, both compared to 2025 actual acreage and March intentions. Florida and Arkansas are the two southern state exceptions, with corn acreage estimated to be higher by 17.6% and 2.5%, respectively, compared to 2025.

    The comparison between reported acreage follows a similar trend nationally, as shown in Table 2. However, percent changes from 2025 actuals show a larger overall percent decrease in corn acreage in southern states compared to the total United States. There is also a larger overall percent increase in soybean acreage in southern states compared to the total United States.

    One question in anticipation of this report was how planting estimates would compare to March intentions.  In particular, the pre-season survey occurred prior to the conflict in the Middle East and the transportation constraints through the Strait of Hormuz. These issues have raised concerns about higher fertilizer and fuel costs with the potential for farmers to alter planting strategies in response. The June Acreage report is the first acreage check to give an indication of the effects of these global pressures. While individual farmers may have made changes, it appears that, on aggregate, there has been little to no impact on 2026 plantings.  The increase in cotton futures market prices and lack of peanut contracts would more likely explain the respective increase in cotton acres and decrease in peanut acres between the March and June reports. Weather is going to be the next big market mover through the summer as refined estimates of acreage are published by the USDA.

    Table 1. Southern States Crop Acreage Reported by USDA: June 2026 with Comparison to March 2026 and 2025 Actuals

    CropJune 2026 Acreage ReportMarch 2026 Prospective Plantings2025 Actual AcreagePercent Change from 2025 ActualPercent Change from March 2026
    Corn10,20010,29010,815-5.7%-0.9%
    Wheat11,16511,78011,495-2.9%-5.2%
    Rice (Long-grain)1,2351,4701,900-35.0%-16.0%
    Soybeans13,27513,22512,06010.1%0.4%
    Peanuts1,5071,6491,926-21.8%-8.6%
    Cotton (Upland)9,1308,9158,5496.8%2.4%
    All Principal Crops69,44869,58669,592-0.2%-0.2%
    Source: USDA Crop Acreage Report, June 30, 2026.
    Southern states is the sum of acreage reported for Alabama, Arkansas, Florida, Georgia, Kentucky, Louisiana, Mississippi, North Carolina, Oklahoma, South Carolina, Tennessee, Texas, and Virginia.

    Table 2. United States Crop Acreage Reported by USDA: June 2026 with Comparison to March 2026 and 2025 Actuals

    CropJune 2026 Acreage ReportMarch 2026 Prospective Plantings2025 Actual AcreagePercent Change from 2025 ActualPercent Change from March 2026
    Corn              95,343               95,338               98,788 -3.5%0.0%
    Wheat              42,740               43,775               45,328 -5.7%-2.4%
    Rice (Long-grain)                 1,395                  1,648                  2,118 -34.1%-15.4%
    Soybeans              85,365               84,700               81,215 5.1%0.8%
    Peanuts                 1,528                  1,674                  1,953 -21.8%-8.7%
    Cotton (Upland)                 9,700                  9,510                  9,141 6.1%2.0%
    All Principal Crops           309,639            309,951            311,543 -0.6%-0.1%
    Source: USDA Crop Acreage Report, June 30, 2026.
    Acreage in thousands.
     

    Recommended citation format: Rabinowitz, Adam. “June Acreage Report Shows Larger Acreage Decline for Peanuts and Rice.” Southern Ag Today 6(27.3). July 1, 2026. Permalink
  • Little Growth in Pork Production Ahead

    Little Growth in Pork Production Ahead

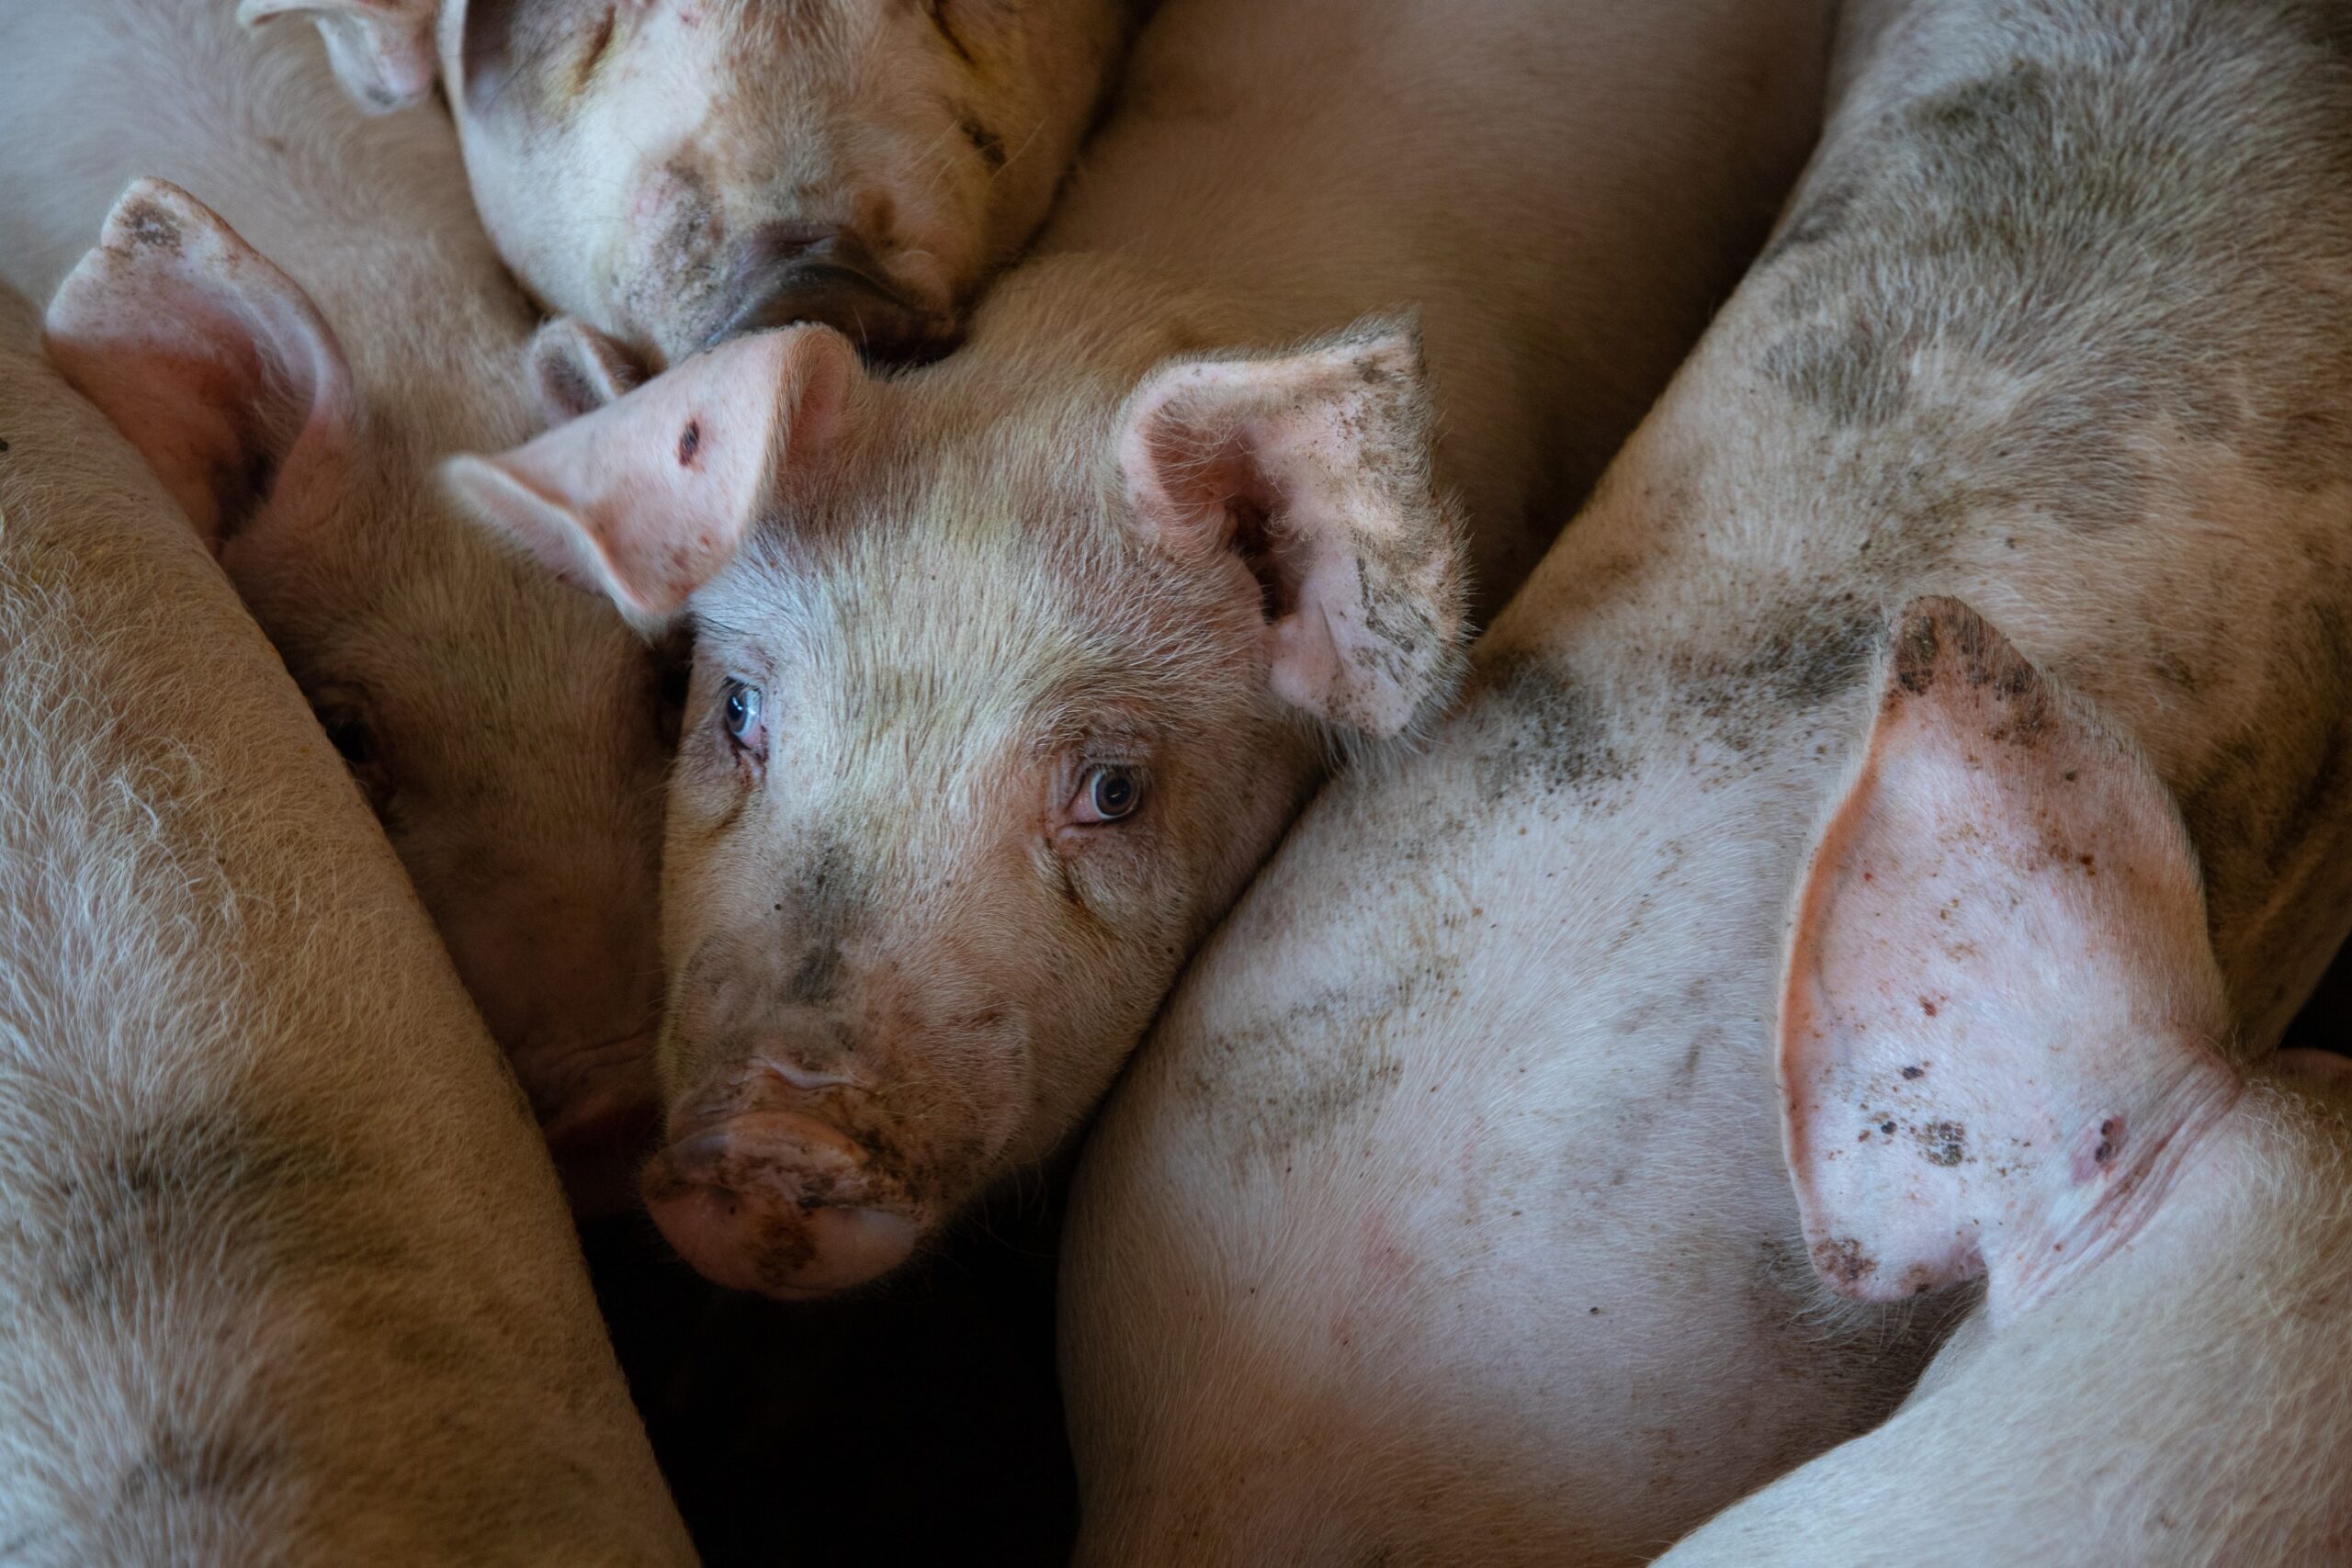
    The hog market has a number of interesting contradictions.  Amid the factors of profitable production, live and cutout values well below last year, and little growth in production, USDA released its June 1 Hogs and Pigs report last week, and it continued to show a smaller breeding herd.

    The breeding herd was estimated to be 5.88 million head, down 1.2 percent compared to last year.  That is the smallest herd since 2014 and the 6th consecutive year of declines in the June 1 breeding herd.  The number of market hogs was even with last year.  The number of pigs per litter over the December 2025-May 2026 time period hit a record high of 11.88.  Market hog production has been boosted by pigs per litter, which has offset the decline in the number of sows farrowing.  

    The lack of growth in the sow herd is interesting given the Iowa State University estimate of farrow to finish hog profits.  The April 2026 data was the 24th consecutive month of estimated profits.  Normally profits jump start expansion, yet that has not occurred due to a number of headwinds.  Expansion often requires new barns, and rising construction costs have likely offset estimated future profits.  Animal health and sow mortality have likely constrained expansion.  Falling feed costs have been a big reason for profits.  High prices boosted profits dramatically in the middle of 2025, but prices have seen little increase in 2026.

    Hog prices, as reported by the national weighted average carcass price, peaked last July at $108.79 per cwt.   Prices entering July this year were $92 per cwt.  The pork cutout value is about 20 percent lower than last year and is also below the 5-year average value.  Wholesale prices for hams, bellies, loins, and trimmings are all lower than last year.  Only spareribs are higher than last year.  The futures market is not indicating higher prices for the rest of the year.  Neither pork nor hog prices indicate much potential for herd growth in the coming months.  

    Happy 250th 4th of July to all of you from us livestock economists at SAT!  We hope you find something great to put on the grill or smoker and celebrate, looking forward to the next 250.  


    Recommended citation format: Anderson, David. “Little Growth in Pork Production Ahead.” Southern Ag Today 6(27.2). June 30, 2026. Permalink

  • The Current Cattle Market Offers Opportunity to Build Working Capital

    The Current Cattle Market Offers Opportunity to Build Working Capital

    Authors: Kenny Burdine and Jonathan Shepherd

    Strong cattle prices are giving cow-calf producers a rare window to strengthen their financial position. While every operation will respond differently, producers should aim to look back on this period and feel confident about the decisions they make.

    In an article last summer, investments in genetics, facilities, and grazing systems were discussed, as well as paying down debt and improving liquidity. Here, we dive deeper into improving liquidity by focusing specifically on one often-overlooked opportunity: building working capital.

    The financial formula for working capital is current assets minus current liabilities. In simple terms, it refers to the amount of readily available assets beyond what is needed for short-term obligations. Current assets include cash and marketable commodities (livestock, grain, etc.) that can be converted to cash quickly. A farm business should always have at least enough current assets to cover current liabilities, and depending on the type of business as much as 2-3 times the current liabilities may be recommended. When the opportunity presents itself, there are substantial benefits to growing working capital beyond just meeting typical current liability needs. A few of these benefits are discussed briefly below.

    Self-finance short-term expenses

    With stronger working capital, producers can pay cash for expenses instead of relying on operating loans. This reduces interest costs, a valuable advantage in today’s higher-rate environment. The current environment also offers more attractive returns on working capital kept in liquid investments such as money markets and high-yield savings accounts.

    Stronger finances improve borrowing power

    Building increased working capital can also have financial benefits by improving the financial position of the operation. As working capital increases, the farm’s current ratio (current assets divided by current liabilities) improves. Holding all else constant, this makes the farm more attractive to lenders. An improved financial position can lead to increased borrowing opportunities and more attractive borrowing terms.

    A cushion for tough times

    Working capital also acts as a built-in risk management tool. By stockpiling some cash reserves during good times, the operation will be in a better position to weather the downtimes. When markets turn or costs rise, a financial cushion allows producers to ride out the downturn without taking on more debt. Just as importantly, it buys time to make thoughtful decisions instead of rushed ones. Time to process and evaluate options can be very important when dealing with financial stress.

    Be ready when opportunities appear

    Working capital can also improve an operation’s ability to be opportunistic, which can be a key to growth over time. There will be times when ground comes up for sale that has always been wanted, a set of heifers is a good buy, or a piece of equipment is priced below what it is worth. The operations best positioned to take advantage of these opportunities are often those with strong liquidity, as they either have the cash to make the purchase or can quickly secure attractive financing.

    Fuel future growth

    Working capital also serves as a baseline for long-run investment. A growing cow-calf operation typically sees lower income levels because they are selling fewer females or expanding through the purchase of cows or heifers. Working capital can be a source of funds to offset the reduction in heifer sales or the purchase of additional breeding stock. The same can be said of land acquisition and other investments in facilities and infrastructure. Having a pool of funds to draw from and / or leverage makes long-term investments much easier to approach.

    The current cattle market offers opportunities, and how an individual operation chooses to capitalize on them will depend on that operation’s goals. Some may choose to retire, while others may choose to expand. Some may make long-term investments, while others pay down debt. The purpose of this article was simply to focus on the benefits of increased working capital as a financial strategy. By building working capital today, the operation can be more prepared for the uncertainty of tomorrow. 


    Recommended citation format: Burdine, Kenny, and Jonathan Shepherd. “The Current Cattle Market Offers Opportunity to Build Working Capital.” Southern Ag Today 6(27.1). June 29, 2026. Permalink

  • Exploring Human and Social Capital: Capacity Building through Grant Writing

    Exploring Human and Social Capital: Capacity Building through Grant Writing

    The Community Capitals Framework (CCF), developed by Jan L. Flora and Cornelia B. Flora (2004), provides a framework and tool for understanding community development initiatives through a systems lens. “The CCF offers a way to analyze community and economic development efforts from a systems perspective by identifying the assets in each capital (stock), the types of capital invested (flow), the interaction among the capitals, and the resulting impacts across capitals” (Emery and Flora, 2020). The CCF draws on seven areas of existing stock (assets) in communities: human, social, political, financial, built, natural, and cultural capital (Graphic 1).

    Additionally, Asset Based Community Development (ABCD), grounded in the work of Dr. John McMcKnight and Dr. Jody Kretzman as well as global practitioners, sees communities and individuals as having assets and capacities that grow and strengthen their communities. ABCD focuses on what is strong and not what is wrong in the community as a place to foster and build local leadership for positive, collective change. The Asset Based Community Development Instituteutilizes six core assets: individuals and skills, local associations, institutions, economic resources, physical (natural plus built assets), and culture, traditions, and stories.

    Using the CCF as a framework and tool for measurement and ABCD as an applied tool for community members, the University of Arkansas Division of Agriculture (UADA) teaches a  Capacity Building through Grant Writing course for communities, hosted by the county Extension office in partnership with the local Community Foundation as well as the planning and economic development district. Since 2022, 793 workshops have been held in 48 counties throughout Arkansas. The data herein focuses on a specific time period of October 2024-September 2025 (Graphic 2). 

    The Capacity Building through Grant Writing course delivers content focused on the fundamentals of grant writing practice. However, at the heart of the course is an investment in human and social capital. The course begins with a focus on the individual as the best storyteller for their institution or organization. While grant writing is about successfully receiving funds, it is about effective story telling combined with following all guidelines and priorities for the funder. The curriculum also emphasizes an investment in social capital by exploring, understanding, and defining partnerships that currently exist as well as those that should exist through a win-win approach of both organizations gaining from the project and relationship. 

    Using the Spiraling of Community Assets model (Emery & Flora, 2020, see Graphic 3), the Capacity Building through Grant Writing course invests in human capital through the training. Short-term and medium-term results show a strong result in knowledge gained by participants. With a focus on partnership cultivation, relationship building, and social capital investment, the course is designed to increase the ability for a county to spiral up its assets for collective investment. Through an applied ABCD lens, participants explore how putting people in the center of local investment and decision making creates a shared plan for action and investment. 

    As identified in the Spiraling of Community Assets model (Emery & Flora, 2020), the course bridges social capital by connecting outside knowledge of Extension professionals with the internal wisdom of community. The course is open to all members of the community regardless of experience level or community position. Participants range from youth, church leaders, parents, and nonprofit organizations to mayors and county officials, fire departments and local. As Emery and Flora (2020) notes, the building of social capital with the engagement of youth to entrepreneurs leads to greater cultural capital and understanding of how local connections strengthen connected investments across sectors. Participants explore a clearer, more interconnected plan of how their requests for funding are tied to philanthropic and federal investment. The spiraling up model of investment in people and their relationship leads to potential investment rather than disinvestment in the community. 

    Utilizing a grant writing curriculum developed in partnership with the Southern Rural Development Center (SRDC) and adapted for an Arkansas context, institutions and individuals came together for a six-hour workshop. Participants gain an understanding of mission and focus relative to their funding goals, develop a SMART goal (Heathfield, S.M. (2011) outlining the proposed grant-funded project, define win-win partnerships and relationship development, navigate ways to finding a grant opportunity, explore components of writing the narrative, create a logic model for the proposed project, and understand budget development and financial management. From the beginning of the course, participants outline funding goals that are Specific, Measurable, Attainable, Relevant, and Time-framed (SMART). This outline of setting a clear goal for funding carries through the course to include measurable outcomes using a logic model framework. For new grant writers, it can be tempting to focus on the need for funds first. However, participants need to focus on the purpose of the funding relative to their organization’s mission. 

    Grant writing is not a solo endeavor. With a clear sense of direction (SMART goal and logic model) and understanding of existing assets, particularly through the lens of human and social capital, participants determine the gap that can be improved through external funding. Using an ABCD lens, the curriculum explores grant writing as building the capacity of human capacity through opportunities and connections that exist amongst all six assets. While grant writing can be seen through a needs-based perspective, looking at the problem to be addressed, the ABCD lens looks at funds, partnerships, and goals as investment in the community. 

    While the Community Capitals model emphasizes the existing stock in a community that can grow with investments in its assets, the ABCD lens on community development places people at the center through the lens of its community’s strengths. Through connecting the assets and strengths in the community of individuals, associations, institutions, physical assets, marketplace, and culture, stories and traditions, we empower people to create local change. Both the Community Capitals model and ABCD lens allow us to fully understand and explore the impacts of a program invested in the human passion and social, interconnected systems operating locally. 

    Graphic 1: Community Capitals Framework

    Source: Microsoft Co-Pilot (2026)

    Graphic 2: University of Arkansas Division of Agriculture Capacity Building through Grant Writing Workshop Results 2024-2025. 

    Source: Microsoft Co-Pilot (2026)

    Graphic 3: The Spiraling of Capital Assets.

    Source: Emery, M., & Flora, C. (2020)

    References

    Doran, G. T. (1981). There’s a SMART way to write management’s goals and objectives. Journal of Management Review, 70, 35–36.

    Beaulieu, L.J. (2006). Promoting community vitality and sustainability: The community capitals framework. Fact Sheet: Purdue University Extension. https://cdextlibrary.org/wp-content/uploads/resource-media/2020/12/Promoting_Community_VitalitySustainability_ADA2026.pdf

    Emery, M., & Flora, C. (2020). Spiraling-up: Mapping community transformation with community capitals framework. In 50 Years of Community Development Vol I (pp. 163-179). Routledge.

    Flora, C. B., & Flora, J.L. (2008). A paradigm for community development: The Floras’ community capitals. Department of Agricultural and Applied Economics, University of Wisconsin–Madison.

    Flora, C.B. and J.L. Flora. 2013. Rural Communities: Legacy and Change, 4th Edition. Boulder, CO: Westview Press.

    Heathfield, S. M. (2011). Beyond smart goals. About.com Human Resources. Retrieved from http://humanresources.about.com/cs/performancemanage/a/goalsetting.htm 

    Kretzmann, J. P., & McKnight, J. L. (1993). Building communities from the inside out: A path toward finding and mobilizing a community’s assets. Asset-Based Community Development Institute, Institute for Policy Research, Northwestern University.

    Microsoft Co-Pilot (2026). A graphic image of University of Arkansas Division of Agriculture Capacity Building through Grant Writing workshop results 2024-2025. 

    Microsoft Co-Pilot (2026). A graphic image of the Community Capitals Framework. 


    Recommended citation format: Goodman, Hunter P. “Exploring Human and Social Capital: Capacity Building through Grant Writing“. Southern Ag Today 6(26.5). June 26, 2026. Permalink

  • FarmDoc Continues to Sow Regional Discord

    FarmDoc Continues to Sow Regional Discord

    Authors: Bart L. Fischer and Joe Outlaw

    While you will never find us using this platform to attack other regions of the country—as it turns out, we want farmers and ranchers across the entire country to be successful—our colleagues at FarmDoc seemingly never miss a chance to take swipes at Southern agriculture. Typically, their arguments center on some narrow way that federal policy is supposedly disproportionately benefiting producers in the South. We won’t re-plow that ground here, as you can find several other articles where we have taken them to task in response. 

    But, in one of the latest FarmDoc articles (The Evolving US Southern Crop Problem), they take a new approach. Carl Zulauf from Ohio State University argues that Southern harvested acres are declining…and suggests that is proof that Southern agriculture is actually being harmed by the farm safety net. Before we go any further, we can’t help but offer a quick lesson on spurious correlation—the idea that two variables can move together mathematically but not be causally connected. A quick Google search will yield all manner of outstanding examples.[1]  One of our favorites: the popularity of the first name Brooklyn is highly correlated with UFO sightings in Kentucky. Are they correlated? Yes. Are they causally related? Umm….no.

    To prove his point, he highlights changing acreage in the South, using cotton, peanuts, and rice as his evidence.  Oops…peanut and rice acreage are actually fairly stable (just look at Zulauf’s Figure 2).  But, not cotton!  He notes that cotton harvested acreage has declined significantly if you look at his random groupings of 1927-1929, 1978-1980, and 2023-2025. Then, if you close your eyes and disengage your brain—and just take at face value his oft-repeated argument that Southern crops have disproportionately benefited from the farm safety net—for him that prompts a “rarely asked question” of whether the support for these crops have hurt Southern crop agriculture in total. We tell our students all the time that there’s no such thing as a dumb question. We may have finally found the exception.  

    While we could spill gallons of ink addressing this nonsense, we will simply offer three key observations. In the article, he argues that changes in planted acres are the “ultimate” indicator of crop competitiveness…yet he uses harvested acres in his analysis (alongside his arbitrary grouping of years).  The problem: he fails to acknowledge significant abandonment in cotton acres (i.e., a large divergence between planted and harvested acres) due to prolonged drought over the last few years in the cotton belt that have nothing to do with competitiveness.  

    While cotton acres have declined in the group of Southern states used by Zulauf (Alabama, Arkansas, Florida, Georgia, Louisiana, Mississippi, North Carolina, South Carolina, Tennessee, Texas, and Virginia)—with cotton planted acres reaching their low in 1967—they have averaged 9.97 million acres over the 58 years since then (and 10.47 million acres over the last 10 years) as reflected in Figure 1.  So, while Zulauf makes considerable noise over the decline in harvested cotton acres since 1927 (and you can find a number of academic articles that describe the reasons behind that decline through 1967 that are beyond the scope of this article), the reality is that cotton planted acres have been relatively stable for the last 60 years.

    Figure 1: Planted Acres of Select Crops in the Southern United States, 1909-1925.

    Source: NASS-QuickStats

    Perhaps more importantly, his article completely ignores the fact that payment acres for Title 1 of the farm safety net have been completely decoupled from production since 1996.  While he and some of his colleagues write incessantly about the amount of support for cotton, peanuts, and rice, the reality is that since Freedom to Farm was implemented in 1996, farmers could plant whatever they want (with some restrictions—largely to prevent overplanting of specialty crops) and remain eligible for the farm safety net.  You see that dynamic playing out as intended in Figure 2.  Over those last 30 years (1996 to 2025), cotton and soybeans have jockeyed for top billing in terms of planted acres in the South.  In fact, in 14 of the last 30 years (or 46% of the time), soybean acreage exceeded cotton acreage.  While corn and wheat have generally jockeyed for the 3rd and 4th spots, corn overtook cotton in 2025. In other words, farmers have the freedom to plant what commodity markets are indicating will be their most profitable alternative—and the data indicates they do. Profitability is one of many factors that farmers have to consider when making planting decisions, many of which were discussed in a previous article.

    Figure 2: Planted Acres of Select Crops in the Southern United States, 1996-1925.

    Source: NASS-QuickStats

    While we agree that overall planted acres have gone down in the South, we would argue that this has had absolutely nothing to do with the decoupled support provided in Title 1 of the farm bill.  Since the 1970s, we’ve seen a considerable amount of land go into grasslands for conservation (e.g., Conservation Reserve Program) or in support of the cow-calf sector.  We’ve also seen land being used for forestry.  The point: landowners have the freedom to decide how they want to use their land, and they have done so accordingly.  

    We save what is perhaps the most egregious point for last.  Zulauf argues that part of the harm being done is that it is “inhibiting diversification.” This seems to be a strange statement from someone who comes from a region that predominantly plants two crops. As noted in Figure 1, at one point in history the South planted 30 million acres of corn. Is that the sort of diversification he’s after…the South should plant more corn? As for other crops that have lost acres, there are a litany of reasons why and none of them have anything to do with ARC and PLC either. As we noted above and as reinforced in Figure 2, Southern growers take a number of factors into consideration when deciding what to plant—none of which are ARC or PLC since they are decoupled from production.


    [1] https://www.tylervigen.com/spurious-correlations


    Recommended citation format: Fischer, Bart L., and Joe Outlaw. “FarmDoc Continues to Sow Regional Discord.” Southern Ag Today 6(26.4). June 25, 2026. Permalink