Blog

  • More Volatile Cotton Prices

    More Volatile Cotton Prices

    Since mid-May, ICE cotton futures have witnessed an historic short-term collapse (see this article https://southernagtoday.org/2022/07/what-is-behind-the-recent-cotton-futures-market-plunge/ ).  In the two-month period between May 16 and July 14, the December ’22 contract fell over 49 cents.  In the last 40 years, there have only been six December cotton contracts with more than that total level of change, measuring from the contract high to the contract low.  The reason for the price decline has been attributed in the farm press and industry newsletters as “demand destruction” which is probably intended to mean both 1) a lower quantity demanded at the formerly high prices, and 2) an inward shift in demand in response to recessionary expectations.

    Besides the major downward trend of this price movement, it is also associated with high volatility.  By volatility, I mean that prices are gyrating more variably and more quickly.  Historical volatility is a measure of the spread or risk of price movements over a defined period.  Figure 1 shows historical volatility in ICE December cotton futures during the period March through Mid-May.  The underlying measure of dispersion used in Figure 1 is the standard deviation of December futures settlements.

    Contributing to the high volatility of the December ’22 contract were the strong price moves higher and lower, including many limit up and limit down moves.  Figure 1 indicates that the volatility of the December ’22 prices is approaching that of the notable price rally of 2010-11, which then reverted to more normal prices, a pattern that economists call “mean reversion”.  Like 2010-11, the current price movements will likely become smoother and less volatile, but perhaps not until the post-harvest season.  (Note: the 2010-11 price spike was triggered by a global supply shortage that was several years in the making.  In contrast, the 2021-22 price spike appears more demand driven.) 

    The plunge in cotton futures represents a lost opportunity for growers with unsold or unhedged production this year.  The contribution of high volatility also increases the costs of marketing since more variable price moves increase the costs of hedging for growers or merchants.  The experience of high volatility in 2022 should serve as a reminder to growers about the riskiness of cotton price movements.  

    Source:  Historical ICE Cotton futures price settlement data obtained from www.barchart.com

    Robinson, John. “More Volatile Cotton Prices“. Southern Ag Today 2(32.1). August 1, 2022. Permalink

  • Sysco Becomes Latest Beef Packer Antitrust Claimant

    Sysco Becomes Latest Beef Packer Antitrust Claimant

    In 2019, a series of class-action lawsuits were filed against JBS, National Beef Packing, Tyson, and Cargill, commonly known as “The Big Four” packers on behalf of direct purchasers, producers, and indirect purchasers as separate classes seeking class certification. These suits allege that The Big Four violated the Sherman Act, the main federal law protecting free market competition and prohibiting restraint on interstate commerce. In addition, these suits alleged violations of 25 different states’ antitrust laws and 21 states’ consumer protection laws totaling 48 claims in a single suit. The suits alleged that The Big Four have a tight oligarchy for both slaughter capacity and processed beef sales and that The Big Four conspired to artificially deflate the beef supply and drive up the cost of boxed beef. The suits also name a market forecasting service, Agri Stats, as a defendant. In 2021, JBS settled with the direct purchaser class only, for $52.5M, agreeing to provide “extensive cooperation” to plaintiffs in proving their claims against the other defendants. 

    In June and July of 2022, Sysco Corporation, along with other grocers and food distributors, filed similar lawsuits against The Big Four, alleging violations of the Sherman Act and conspiracy to artificially deflate cattle market prices while simultaneously causing boxed beef prices to soar. Sysco’s complaints quote a former employee witness who purported to have first-hand knowledge of the alleged conspiracies. 

    A search of public access court records shows 11 associated cases to Sysco’s suit against The Big Four. Two of the cases have already consolidated multiple suits with similar claims. As the U.S. Department of Justice continues its investigation of these allegations quietly, the litigation is heating up. The Defendants publicly and vigorously deny the allegations, and all testified before Congress in April of 2022, unequivocally denying any conspiracy as alleged between them. There’s a lot of smoke around this issue, and time will tell if it’s a smoke screen or an inferno. For now, the larger agriculture community is following closely as the poultry and swine industries wait in the wings. 

    Friedel, Jennifer. “Sysco Becomes Latest Beef Packer Antitrust Claimant“. Southern Ag Today 2(31.5). July 29, 2022. Permalink

  • Difference Between Inflation and Changes in Commodity Prices

    Difference Between Inflation and Changes in Commodity Prices

    The term inflation is commonly used to describe a general increase of prices.  However, back in the mid-1800s where the term started to emerge in the literature, it was not in reference to something that happens to prices, but as something that happens to a paper currency.  Back in those days “bank notes,” a private paper currency redeemable for a specific amount of metal, were becoming widely used. At times, banks did not have enough gold or silver to satisfy all of their claims, therefore, they “inflated” the number of bank notes in relation to the amount of metal they had.  Therefore, inflation was the fall in value of paper currency or money due to an excessive issuance of paper currency or money.  From March 2020 to February of 2022 the money supply in the US increased by 41.2 percent, or 20.6 percent per year, while average GDP growth over the same period of time was 3.7 percent (FRED, 2022).  As a reference point, money supply over the last decade had increased an average 8.2 percent per year.

    On the other hand, rapid changes in commodity prices are very common in agriculture and usually is due to supply shifts.  Good weather, improved technology and political stability are some variables that shift supply to the right causing an increase in supply and a decrease in prices (Graph 1).  On the other hand, bad weather, increase in input prices and political instability or war are variables that shift supply to the left causing a decrease in supply and an increase in prices (Graph 2).  The Russia and Ukraine war has caused a supply shift to the left in many commodities such as wheat, corn, fertilizer, and oil, given that these two countries are major producers.  Therefore, as quantity supplied of those commodities decreased, prices increased.  However, these increased prices caused producers of those commodities around the world to react and produce more and now prices are on a downward trend.  Also, demand for those commodities decreased contributing to the decrease in prices.  These supply shifts happen very often in agricultural commodities without causing inflation to spike.  In fact, Asian economies are experiencing normal levels of inflation as seen in the chart by The Economist.

    Dr. Milton Friedman, winner of the 1976 Nobel Prize in Economic Sciences, stated back in 1963 that “Inflation is always and everywhere a monetary phenomenon in the sense that it is and can be produced only by a more rapid increase in the quantity of money than in output.”  Dr. Friedman was right then and still is now.

    Bryan, Michael F., 1997. “On the Origin and Evolution of the Word Inflation,” Federal Reserve Bank of Cleveland, Economic Commentary, 10.15.1997.

    Federal Reserve Economic Data.  https://fred.stlouisfed.org. Accessed July 23, 2022.

    Ribera, Luis. “Difference Between Inflation and Changes in Commodity Prices“. Southern Ag Today 2(31.4). July 28, 2022. Permalink

  • Estimating the Cost of a Grain Bagging System

    Estimating the Cost of a Grain Bagging System

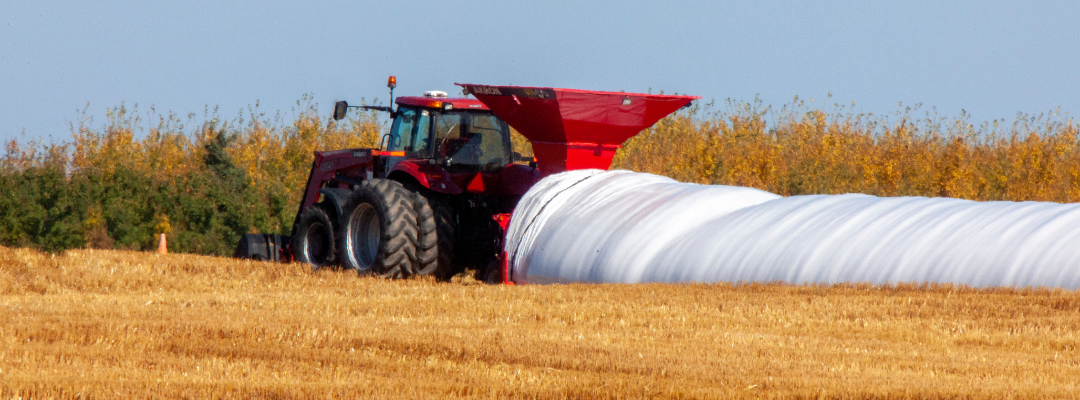
    Storage can be a valuable risk management and marketing tool for Southern corn producers. Storage allows producers to reduce harvest delays, avoid seasonal price lows, expand the marketing window, and harvest grain at higher moisture – if drying or aeration is available. There are two main options to store grain: grain bins or grain bags. This article provides an overview of the benefits, ownership costs, and operating costs for a grain bagging system.

    Benefits

    Labor continues to be a major challenge for agricultural producers. One of the primary benefits to using a bag system is the ability to reduce harvest labor requirements, particularly trucking. Storing corn at the edge of the field reduces the number of trucks required to keep combines running, avoids long lines at elevators and barge points, and distributes hauling to terminal markets during times of the year when labor is more readily available. Additionally, the ability to harvest a crop quickly reduces the risk of losses due to adverse weather. Extending the marketing interval allows producers to benefit from post-harvest price rallies. For example, in Memphis Tennessee, the ten-year average corn price was 70 cents higher in March/April compared to the harvest low. Mid-south producers that have cotton in their crop rotation can use bagging systems to modify annual storage availability, thus avoiding capital investment in permanent grain storage infrastructure when planted acreage varies year-to-year.

    Ownership Costs

    A bagging system requires capital investment in a loader, unloader, and tractor. This equipment is in addition to grain carts/trucks to transport grain from the combine to bagger. Purchase prices vary however many loaders can be obtained for less than $50,000. Bag unloaders will also cost around $50,000. Most operations will have access to a tractor that can be utilized in a bagging system, however this cost should also be included. Cost of ownership will vary for each operation; however, cost estimates should include capital recovery (depreciation + interest), taxes, insurance, and housing (TIH). For example, assuming an interest rate of 6.5% and TIH of 2.0% of the equipment value, estimated ownership costs for 100,000 bushels of storage is approximately 14 cents/bushel. Storing more bushels will distribute fixed costs lowering the ownership cost per bushel. 

    Operating Costs

    Operating costs vary by system; however, producers should consider site preparation, purchase price of storage bags, labor (loading, unloading, and monitoring), insecticides, sensors, bag disposal, and machinery expenses (fuel, repair and maintenance). Additionally, producers should account for potential storage loss/risk. Wildlife damage, insect and rodent infestation, weather, and damage from humans present a risk for storage losses. Estimated operating costs based on the assumptions below in Table 1 are 17-22 cents per bushel. Costs are highly variable so producers are encouraged to estimate costs based on operation specific variables and assumptions.

    Bagging systems may be a cost-effective method to store grain for Mid-south producers. Producers are encouraged to weigh the advantages and disadvantages of permanent storage (bin) and temporary storage (bag) systems to determine which system is best for their operation. Additionally, comparing ownership and operating costs with seasonal corn prices in your area will assist in determining if investment in storage is financially beneficial for your operation.

    Table 1. Example: Operating Cost Assumptions

    ValueUnit
    Bag Size16,000bu
    Bag Price$1,100$/bag
    Labor Rate$22,000$/hr
    Diesel Price$6.00$/gallon
    Interest Rate (Operating)6.5%%
    Repair and Maintenance5.0%% of purchase price

    Resources:

    Estimating Costs for Grain Storage: Bags and Bins- https://extension.tennessee.edu/publications/Documents/W1060.pdf

    Spreadsheet: https://arec.tennessee.edu/grain-bag-and-bin-storage/


    Duncan, Hence, and S. Aaron Smith. “Estimating the Cost of a Grain Bagging System.” Southern Ag Today 2(31.3). July 27, 2022. Permalink

  • Cattle and COF Reports

    Cattle and COF Reports

    USDA released two cattle reports on Friday July 22nd – the Cattle on Feed and Cattle Inventory reports. Taken together, these reports paint a picture of a smaller cowherd and some future opportunities as supplies continue to tighten.

    Cattle on Feed

    Placements, marketings, and total cattle on feed were reported at 97.6, 102.0, and 100.4 percent of a year ago, respectively.  For the fourth month in a row, placements were below a year ago.  For the year, placements are ahead of last year, but the increase was all in February.  

    Placements were higher than a year ago by 15,000 and 10,000 head, in the two lightest weight categories, under 600 pounds and 600-699 pounds.  All of the increase in light weight placements was reported in Texas. Based on anecdotal evidence of large runs of cattle after the 4th of July, placements in July may be larger than last year, at least in light-weight cattle.

    In only two years, 2019 and 2001 (4.470 and 4.446 million head), were more heifers reported on feed on July 1 than this year (4.445 million head).  The quarterly number of heifers on feed dovetails with the inventory report of fewer beef cows and replacement heifers held back.

    Cattle Inventory

    Beef cow numbers were reported 2.4 percent below July 1, 2021 in the mid-year Cattle inventory report.  The most interesting number in the report, though, was the number of heifers held for beef cow replacement.  Only 4.15 million heifers were held back which was the fewest since the data series began in 1973.  The 4.15 million heifers equals 13.7 percent of the cowherd.  As a percent of the cowherd, only the years of herd contraction 2001-2003, the 2011 drought year, and herd contraction in 2019 were smaller than this year.  It’s worth noting that over the last 50 years, heifers held back as a percent of the cowherd has been declining.  In general, we have fewer beef cows than in the early to mid-1970s requiring fewer replacements, but it also suggests more efficient beef cattle production.  

    Anderson, David. “Cattle and COF Reports“. Southern Ag Today 2(31.2). July 26, 2022. Permalink