As the process to develop the 2023 Farm Bill is underway, it is interesting to look at the make-up of the House and Senate from the South. The South typically includes Alabama, Arkansas, Georgia, Florida, Kentucky, Louisiana, Mississippi, North Carolina, Oklahoma, South Carolina, Tennessee, Texas, and Virginia. Southern Ag Today also includes Maryland in our grouping of Southern states.
Currently, 161 (or 37 percent) of the members of the House of Representatives are from the South (Table 1). In terms of agriculture committee make-up, 17 of the 54 members (31 percent) of the House Agriculture Committee are from the South. Mr. David Scott, the ranking member of the committee is also from the South (Georgia). In the 118th Congress, 29 of the 75 freshmen members (39 percent) are from the South.
In the Senate, obviously each state has two senators, so the South would have 28 of the 100. Five of the 23 members of the Senate Committee on Agriculture, Nutrition and Forestry are from the South (Table 2), with Mr. John Boozman of Arkansas serving as ranking member.
While the South has a significant amount of representation in Congress – and especially on the agricultural committees – there is a considerable amount of work to do in educating new members who have never taken a vote on a farm bill.
Table 1. States with Members on the House Agriculture Committee.
Table 2. States with Senators on the Senate Committee on Agriculture, Nutrition, and Forestry.
Baling wheat straw following harvest is seen as a way of utilizing a bi-product, with the only cost being baling and removal from the field. The straw could then be sold as bedding for livestock, mulch, or other uses that provide value. However, the cost may be larger than you think.
The cost of fertilizer and increased focus on soil health makes it essential that we know what nutrients we are removing from the field when we take away the wheat straw. Research has shown that removing 6,000 pounds of wheat straw per acre removes valuable nutrients (6,000 pounds is the approximate amount of straw associated with an 80 bushel per acre wheat yield.) Removing this quantity of wheat straw removes 60 pounds of Nitrogen (N), 10 pounds of phosphorus (P2O5), and 135 pounds of Potash (K2O), per acre1. This is in addition to the nutrients removed when the wheat grain is harvested. Putting a monetary value to the pounds of N, P, and K taken away by baling the straw shows that the straw does have significant value. A price of $.86 per pound of nitrogen, $0.70 per pound of phosphorus, and $0.61 per pound of potash2 were used to reflect the approximate cost of the nutrients. The table below shows the value of the N, P, and K removed on a per acre basis when the wheat straw is removed. The value of the wheat straw needs to be greater than $125.47 per acre or $25.09 per 1200-pound round bale. Adding the cost of baling (1200 lbs. round bale) of $14.503 per bale and moving3 the bales out of the field at $4.35 per bale. The total of these costs is $43.94 per bale or $219.72 per acre. It should be noted that this is just the value of N, P, and K. There are some micronutrients as well as the organic matter that wasn’t considered in this analysis that have value if left in the field.
There are caveats. The amount of straw could be different depending on numerous factors, including limited yield, variety of wheat, the efficiency of the baler, and soil type. The value of N, P, and K will vary depending on your location as well. Check local resources in your area to estimate the value/cost of the removal of wheat straw.
Information for the values included in this article can be found in the following resources.
Spring weather in the southeast can indeed be a mixed bag. Environmental control systems are strained as poultry growers in the southeastern United States can easily see temperature swings approaching 60 degrees Fahrenheit over 48 hours. While most modern houses today are capable of successfully handling such temperature swings and keeping the birds inside comfortable, the growers themselves feel the strain in the form of utility costs. Historically, the two largest variable costs contract growers must contend with are heating fuel used to keep birds warm and electricity used to keep birds cool. Luckily, falling propane and natural gas prices accompanied the latest cold snap. A relatively mild winter across the US and Europe facilitated this, leading to decreased usage. The results are increasing stocks of propane in the US starting in November ’22 up to the beginning of March ’23 (Fig 1). Increased supply has led to falling prices for propane. Comparing the previous year’s weak supply numbers to the current strong supply situation could indicate that the upcoming winter may also be met with lower heating fuel prices. This is good news for growers heating chicken houses in the U.S. this spring. This could of course change quickly if the winter of ’23 shapes up to be harsh, or if the crude oil prices again rise to higher levels (as propane is closely tied to crude oil production and price.) Even so, going into next winter with a strong supply of propane is a good sign for poultry growers. Natural gas supplies are also predicted to be higher and long-term prices NG are predicted to be down accordingly.
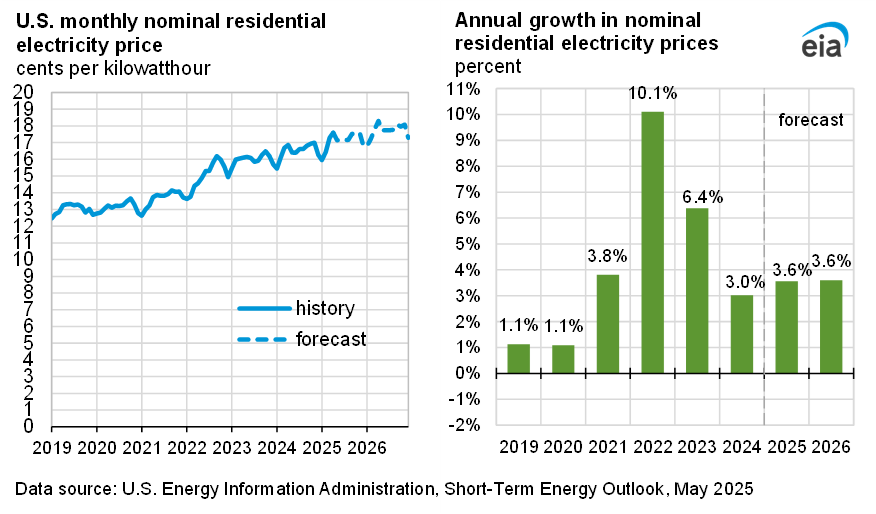
Alternatively, electricity costs are not looking as promising going into the summer when most electricity is used on poultry farms. As poultry houses have become better insulated and better managed to control heating costs, electricity has become the most prevalent cost factor for many growers. Electricity prices saw a significant 10% increase in 2022. While the projection for 2023 is lower at 2.5%, the long-term pricing trend is upward (Fig 2). The causes of this continued increase are varied, from general inflationary forces, increasing demand for electricity met with the increased cost of new generation facilities, to the increased cost for utility companies to implement carbon neutral generation goals. This makes it imperative for growers not only to focus on housing and equipment for heating purposes but also focus on electrical energy usage efficiency. While any money spent on energy efficient upgrades to equipment must be analyzed closely looking at initial cost versus payback over time, electrical efficiency upgrades look to be becoming more and more important going forward.
At the Agricultural Outlook Forum in late February, the USDA released its first supply and demand projections for the 2023 crop year. In the March 20th issue of Southern Ag Today, we looked at how changes in corn exports could change the stocks-to-use (STU) ratio and, thus, price. In this article, we perform a similar analysis for soybeans. Specifically, we find that the soybean STU is much more sensitive to changes in demand than corn. Results indicate that a miss-projection of domestic crush levels could significantly affect soybean STU and price. Although we focus on soybean crush in this article, results would be the same for other increases in demand, such as exports or other domestic products.
As mentioned in our previous article, STU is a fundamental indicator in commodity marketing, as it compares commodity ending stocks to commodity demand. The impact of missed projections on STU provides insight into each commodity’s supply and demand dynamics (Gardner and Smith, 2023). Plot A of Figure 1 shows the year and soybean marketing year average price at various levels of STU. Generally, we would expect a larger STU to indicate more supply than demand which would cause a lower price and vice versa. From 2011 to 2013, supply was short due to below trend line yields or lower harvested acres, thus causing a shortage relative to demand that resulted in higher prices. Lower STUs and prices occurred in 2014 and 2015 due to increased acres (5 million acres more were harvested in 2014 and 2015 than in 2013) and a return to trend line yields. Since 2016, domestic crush capacity has increased substantially (CME Group).
Figure 1. Stocks-to-Use (STU) Ratio and Price by Year and Impact of Missed Soybean Crush Projections on STU
Plot B of Figure 1 displays the potential impact of an under-projection of soybean crush on STU, holding other factors constant. The American Soybean Association projects U.S. soybean crush capacity in 2023 to increase by close to 64 million bushels in 2023 (460 million bushels of increased capacity by 2025); however, the EPA is only assuming an increase in crush demand of close to 45 million bushels (Gerlt, 2023). This difference between increased crush capacity and crush demand could result in an underestimation of projected soybean crush in 2023. If soybean crush is underestimated, an increase in crush numbers of 5 million bushels lowers soybean STU by 0.12%, indicating that soybean STU is more sensitive to demand shocks than corn. If crush expansion and demand are met, soybean STU could quickly move lower than 6%, indicative of 2022, in which the soybean price was $14.30.
Changes in projected supply and demand will impact soybean STU and, consequently, the marketing year average price. The USDA current marketing year average soybean price for 2023 is projected to be $12.90, but if biodiesel capacity expansion increases soybean demand, the marketing year average price could be higher in 2023. Soybean prices could also increase with a rise in export demand or a supply shortage. Producers and traders should be mindful of projected changes in STU and use this information as one factor that could influence price expectations for the upcoming crop.
Gardner, Grant, and Aaron Smith. “Sensitivity of USDA’s Agricultural Outlook Forum Projections to Changes in Soybean Crush Demand.” Southern Ag Today 3(13.1). March 27, 2023. Permalink
The U.S. Court of Appeals for the Fourth Circuit (“4th Circuit”) recently decided InterProfession Du Gruyere vs. U.S. Dairy Export Council, which considered whether a geographic indication was essential to the use of the label “gruyère.” The 4th Circuit decided that it was not, finding that using that term on labels in the United States does not depend on where the cheese was produced (often referred to as a geographical indication), but merely on whether it meets Food and Drug Administration’s (FDA) standard of identity.
FDA is responsible for the labeling of dairy products, among other things. It partially regulates labels by creating “standards of identity,” outlining how specific words may be used. FDA has created a standard of identity for gruyère cheese, defining it by the process needed to create the cheese, not by the location where the cheese is made.
In Europe, however, the label can only be used on cheese produced in the Alps region, near the Swiss/French border. As a result, a group of Swiss and French cheese producers brought the lawsuit at issue today. Ultimately, the court decided that FDA- and ultimately American consumers- saw gruyère as a type of cheese (similar to a label of “mozzarella” or “cheddar”) rather than one produced in a specific place.
Geographical indications are used worldwide, helping protect producers’ market share in specific regions. Whether you’re interested in “Idaho Potatoes” or “Parmigiano-Reggiano,” a part of the label’s meaning includes an indication of the area where the product originated. This case illustrates a trend that international food and beverage manufacturers are becoming more proactive in protecting names with a regional geographical significance. This is an important international trade issue because we expect similar litigation from other affected producers. On a larger scale, the European Union focuses on including geographical indicators as a critical part of trade deals and we expect this trend to continue. To learn more about geographical indications and international trade, clickhere for a National Agricultural Law Center webinar.