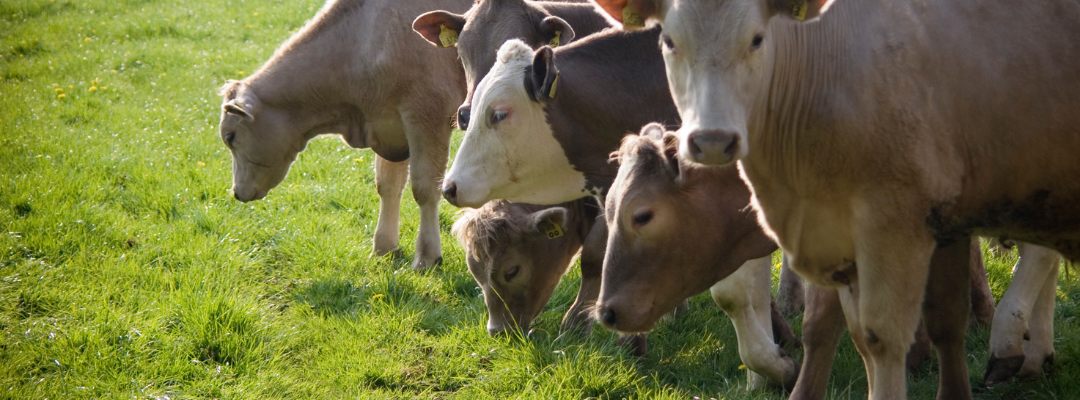
Beef cow culling has been an important story this year and SAT has discussed it a couple of times, but last week beef cow slaughter topped 80 thousand head for the first time since 2012, making it worth looking at again. So far in 2022, beef cow slaughter is 15 percent higher than the same period in 2021. This is equal to approximately 200 thousand more head of beef cows processed this year. Beef cow slaughter averaged about 65 thousand head per week in 2021, but is averaging about 75 thousand head per week in 2022.
Drought, higher feed and other input costs, and stronger cull cow prices continue to be the likely reasons behind the increase. Looking at the regional slaughter data, it appears that beef cow slaughter has increased more in areas with drought. Beef cow slaughter in Region 6 (AR, LA, NM, OK, and TX) is up 30 percent over 2021 and region 7 (IA, KS, MO, & NE) is up 29 percent. However, beef slaughter is also about 20 percent higher in Region 4 (AL, FL, GA, KY, MS, NC, SC & TN) where drought has not been an issue. Beef cow slaughter continues to indicate contraction of the U.S. beef cow herd in 2022.
Lightweight calf prices have dropped dramatically in recent weeks, responding to high feed costs and lower fed cattle futures prices. In the Southern Plains, calf prices have fallen by more than the normal early summer seasonal decline and may reflect some more drought forced sales. Heavy weight steers in the South have declined more than those in the Southern Plains, likely impacted by increased hauling costs as diesel fuel prices hit record highs.
In 2022, soybean planted acreage is estimated to increase 9% in the southern United States (U.S.) with a total planted acreage of 14.76 million acres. Southern states are estimated to account for about 16% of the total soybean acreage planted in the U.S. in 2022. Table 1 shows the past five-year history of soybean acreage by state. In 2022, Arkansas is expected to lead leads the southern states at 3.25 million acres, followed by Mississippi at 2.35 million acres. All southern states, except for Oklahoma and South Carolina, are expected to increase acreage in 2022, when compared to 2021. Soybean acreage in the south has substantially rebounded since 2019, when acreage was reduced due to low prices influenced by the US-China trade war. Soybean acreage across the south in 2022 is up 26 percent compared to 2019.
The observed increase in soybean acreage is influenced by a positive price outlook. On May 12th, USDA released their monthly World Agricultural Supply and Demand Estimate (WASDE) report. The May WASDE provided the first USDA projections for the 2022/23 marketing year for soybeans (and other crops). In this report, USDA projects the national average farm price for soybeans in 2022/23 to be $14.40/bushel. If realized, this price would match the record high achieved in 2012. The positive price outlook is supported by higher exports and domestic crushing on the demand side, compared to 2021. The supply side calls for higher production due to increased acreage, which increases estimated ending stocks to 310 million bushels. However, with a stocks-to-use ratio of 6.76 percent, the overall market environment is supportive of higher soybean prices.
Even with the positive price outlook, it’s important for producers to have a marketing plan in place to take advantage of the current high prices in the market. The new crop soybean Nov’22 futures has been trending higher since January 12th, with a closing price of $15.12/bushel as of May 25th. While prices are currently high, we continue to see considerable price volatility and producers should familiarize themselves with available tools to mitigate price risk. Available tools for price risk mitigation include forward cash sells on portions of expected production or hedging using the futures market. Another tool to consider is forward pricing with options which was covered in a recent Southern Ag Today article by Dr. John Robinson with an application to cotton markets (Forward Pricing with Options on ICE Cotton Futures – Southern Ag Today).
Table 1. Soybean Planted Acreage in U.S. Southern States, 2018-2022 (1,000 acres)
State
2018
2019
2020
2021
2022*
Alabama
345
265
280
310
350
Arkansas
3,270
2,650
2,820
3,040
3,250
Georgia
145
100
100
140
170
Kentucky
1,950
1,700
1,850
1,850
2,000
Louisiana
1,340
890
1,050
1,080
1,200
Mississippi
2,230
1,660
2,090
2,220
2,350
North Carolina
1,650
1,540
1,600
1,650
1,800
Oklahoma
640
465
560
580
560
South Carolina
390
335
310
395
390
Tennessee
1,700
1,400
1,650
1,550
1,850
Texas
175
80
120
110
160
Virginia
600
570
570
600
680
Total
14,435
11,655
13,000
13,525
14,760
* Estimate as of March 31, 2022 Prospective Plantings report. Source: USDA-NASS
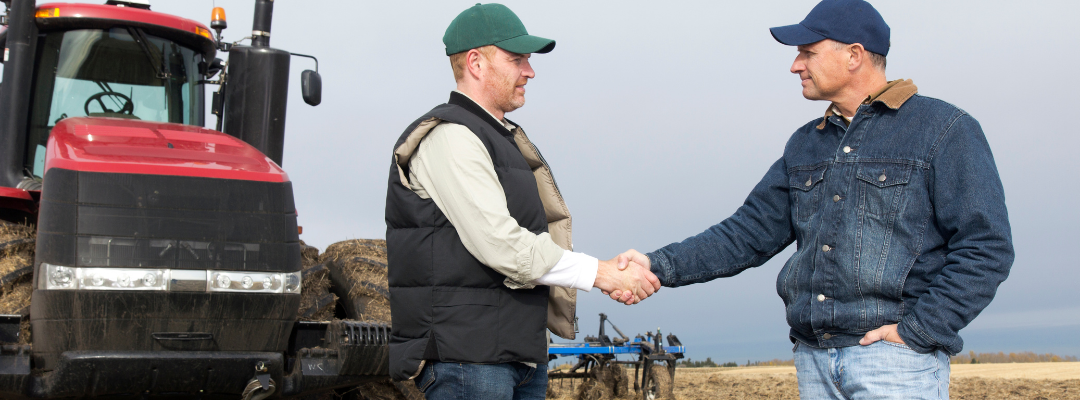
When one inherits or purchases an interest in open farmland – particularly between March and November in the South – chances are someone is growing crops or pasturing livestock on it. Often, there is no written agreement between landowner and farmer. Statistically we know that the majority of farm tenancies renew annually (ERS, 2016), which may support anecdotal observations that verbal farm tenancies are common. Such “handshake” agreements provide no written record of the bargain struck between landowner and farmer as to rent and term. For farmers working multiple parcels with different owners, keeping the bargains straight may pose a challenge. As land changes hands between owners due to inheritance or sale, questions emerge including the farmer’s rights to crops and fixtures, the apportionment of rent between successive owners, and circumstances of renewal.
Given the relative vulnerability of the farmer in this equation, states’ landlord-tenant policies have evolved to provide farmer access rights through the harvesting and sale of their crop and its profits – known as emblements – in the event a landowner or successor tries to move them off and bar access. All southern states have some form of farm tenancy laws, varying in their specificity and determination of tenant rights. Such statutes may supply length of term (e.g. South Carolina) and prescribe termination notice periods required to prevent automatic renewals, often of one month or greater (e.g. Mississippi). Some laws allow a landowner to terminate a tenancy before planting, as in Alabama. The status of improvements – called trade fixtures – placed by the farmer can also come into question, and Georgiaprovides that any items on the parcel at the close of term become property of the landowner. Most such laws ensure payment of rent with a priority lien on crops in favor of the landowner. At the moment, there is no comprehensive source locating and describing farm tenancy laws for the southern states, however, this article serves as a summary of issues such laws might address, using North Carolina as an example. To locate your state’s farm tenancy law, try the search terms “farm” or “agriculture”, “tenant” or “tenancy”, and “[state] Code.”
Regardless of statutory protections, farm tenancy disputes require verbal sworn testimony in court to resolve, and otherwise require judicial interpretation of vague statutory language, so resolving disputes can be costly. Better practice dictates some form of writing to clarify the issues described above. Though farm leases can be a lengthy treatment of rights and responsibilities, or very short statement of place, rent and term, they serve as the clarifying record of the bargain which likely reduces disputes and expense to both landlords and farm tenants.
Animal disease outbreaks have severe economic consequences, especially for international trade. A recent example was the identification of two atypical cases of bovine spongiform encephalopathy (BSE) in Brazil in early September 2021. Although Brazil’s BSE status did not change within the World Organization for Animal Health, severe sanitary restrictions interrupted Brazilian beef trade. Egypt and Saudi Arabia halted beef imports from Brazil for two weeks. China and Hong Kong, which account for about 60% of Brazil’s beef exports, suspended beef imports from Brazil for more than three months. In the month following the notification of the BSE cases, international shipments of Brazilian beef were 49% lower compared to the same period in 2020. Consequently, domestic prices of live animals decreased by 8% in September, and 11.8% in October 2021, leading to the most unfavorable cattle market conditions in Brazil since 2000.
As in the case of Brazil, identification of animal disease is an imminent risk for the U.S., simply because diseases can be difficult to control and have widespread consequences. This risk is demonstrated by the current outbreak of avian influenza in the U.S., which has affected 24 states so far and led to restrictions on American poultry products imported by Canada, Mexico, and China. The extent of the economic damage from this current outbreak is still unknown.
Countries that are major exporters of animal products, such as the U.S., are substantially impaired by sanitary barriers when animal disease outbreaks occur. Trade diversion to other suppliers can cause significant export market losses, as observed during the 2000’s after the BSE outbreak in the U.S. Animal disease events in Brazil and the U.S. highlight the importance of understanding risks within agricultural systems in terms of the direct impact of disease on animal health and food safety, as well as the amplified international trade impacts.
Figure 1. Monthly Beef Exports and Cattle Price Index in Brazil in 2021
While inflation is an immediate challenge to all economic stakeholders, the kind of broad-based inflation currently affecting the economy also raises the prospect of higher interest rates. Rising interest rates are a significant risk for anyone regularly using short & intermediate term and/or variable rate financing, which includes a large portion of agricultural operations.
Although rates remain low from a historic perspective, the U.S. weekly average 30-year fixed mortgage rate hit 5.25% in mid-May for the first time since 2009 (St. Louis Federal Reserve Bank). The US bank prime loan rate is averaging 4.0%, rising from 3.25% in step with the Federal Reserve Board’s recent increases in the federal discount rate. The discount rate is the rate commercial banks pay on short term loans from their regional Federal Reserve Bank. As a monetary policy tool, the Federal Reserve Board of Governors raises the discount rate as a means of curbing inflationary pressure in the economy. See Southern Ag Today – April 5, 2022 for a brief discussion of Fed policy tools. Figure 1 compares a measure of inflation (year over year percentage change in monthly consumer price index) to the federal discount rate, clearly illustrating the relationship between the two series.
Figure 1. Inflation (Year-Over-Year Percentage Change in Monthly CPI) versus Federal Discount Rate
When the pandemic broke out in March 2020, the Fed dropped the discount rate from 2.25% to 0.25% to bolster an economy that hit an abrupt wall. In the next year, inflation began to climb but remained acceptably under 2% until early 2021. Throughout 2021, the rapid rise in prices was thought (hoped) to be transitory, meaning prices would settle back to normal as temporary market and supply chain disruptions eased. Now clearly not transitory, the Fed is engaging interest rates to tap the brakes on inflation. In March, the Fed increased the discount rate by a quarter of a percent from 0.25% to 0.50% and followed that with a half point increase in May, moving the discount rate to 1.0%. Looking ahead, the Fed has projected an intention to use half point rate hikes at consecutive meetings over the next year, presumably until they begin to see an impact on inflation.
What level of interest rates are necessary and how long will it take to tame inflation? Can the Fed manage inflation and avoid pushing the economy into deep recession? What is the economic and political tolerance for higher interest rates?
The last time inflation was at levels comparable to today, interest rates were exceptionally high. The bank prime rate exceeded 20% in 1981. It is difficult to imagine similarly high rates today. The federal budget implications of higher rates are far different now than forty years ago. In 1982, federal government outlays for interest totaled $85 billion against a total debt obligation of $1,120 billion. That implies an average interest rate on federal debt of 7.59%, the highest at any time in the last fifty years. Those 1982 federal interest payments amounted to about 2.5% of nominal gross domestic product (GDP). In comparison, 2020 federal interest payments were $344 billion against total debt of $26,098 billion, an implied average interest rate of just 1.32%, and only 1.6% of nominal GDP. Historically low interest rates over the last decade have clearly softened the impact of high federal debt levels on the federal budget. For context, consider what federal interest payments would be on current debt levels at 1982 interest rates. At an average interest rate of 7.59%, 2020 federal outlays for interest would have been $1,981 billion, equivalent to an unsustainable 9.5% of total GDP. In the post-WWII era, federal outlays for interest have only rarely exceeded 3% of GDP, hitting a high of 3.15% in 1991. The current level of federal debt suggests far less policy room to maneuver in response to rising inflation compared to the early 1980s. The aggressive interest rate hikes that ultimately tamed inflation then would be far more expensive now for both the federal government as well as individual households. Effectively, economic policy makers are caught between the rock of inflation and the hard place of higher interest rates.
Economic uncertainty, inflation, and high interest rates present serious challenges for managers. On a positive note, the financial situation in agriculture is better and should be more resilient to potential shocks compared 40+ years ago, and the likelihood of a 1980s-style farm sector implosion remains remote. However, it is no time to get complacent. In changing financial markets, shop for your best interest rates and terms. Ruthlessly control costs (to the extent you have control), take profits when (if) they appear, jealously guard equity, and build your individual financial resilience.