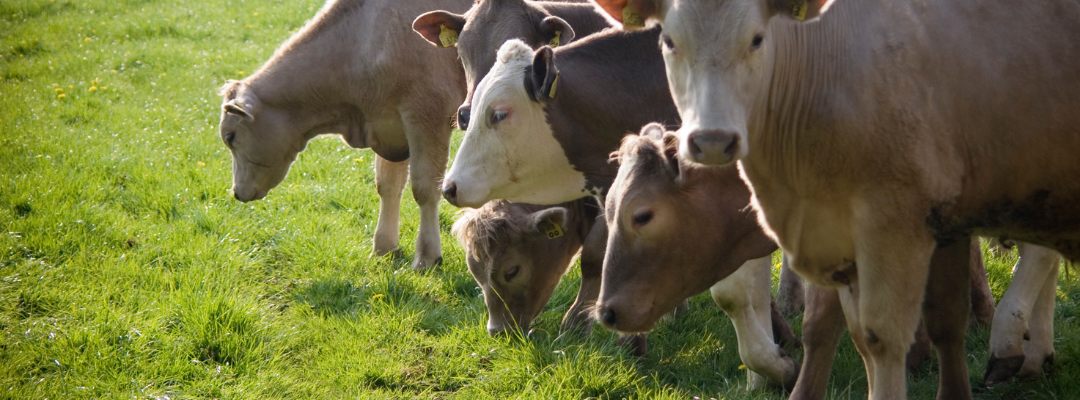
Questions regarding fence disputes are a regular inquiry at the National Agricultural Law Center. For such a common issue, one would assume that this area of the law is relatively straightforward, but that is not always the case! All fifty states have passed laws relating to fences and livestock running at large, but there are significant differences between the states and sometimes even within the same state. For example, Texas is an “open range” state which means that livestock owners are not required to fence in their livestock; however, counties can, and have, adopted local stock laws that effectively close the range in those counties. It can be very difficult to determine whether a Texas county has adopted a local stock law closing the open range in that county because older records are often hard to find and may not be found online.
The confusing nature of fence laws causes numerous problems across the country, but a few general rules apply to most of the southern states. If you have livestock, you typically have a duty to keep them on your property (except for some counties in Texas.) What constitutes a legal fence is typically found in your state law, but the fence must be sufficient to keep your livestock on your own property. The last area where significant questions arise covers maintaining and paying for the boundary fences between neighbors. Once again, this area of the law is highly dependent on where your property is located. It is dependent on the state, but some states have antiquated fence laws which further complicates the problem. To read your state fence law, click here.
If you do have a fence issue with your neighbor, the cheapest way for both parties to resolve the dispute is to come to an agreement that everyone can accept. Fences are not cheap, but lawsuits will typically cost more in the long run.
This morning I testified before the U.S. House Agriculture Committee Subcommittee on General Farm Commodities and Risk Management at a hearing titled “A 2022 Review of the Farm Bill: Economic Perspectives in Title I Commodities and Title XI Crop Insurance”.
At the Agricultural and Food Policy Center (AFPC) at Texas A&M University, our work with 675 commercial producers located across the United States has provided our group with a unique perspective on agricultural policy. Currently, we maintain the information to describe and simulate 94 representative crop and livestock operations in 30 states.
In order to provide perspective on Titles I and XI, I wanted to briefly summarize a recent AFPC report that looks at farm profitability in 2022 relative to 2021 for our 64 representative crop farms in the face of higher input and output prices[1]. For this report, we asked our panel members to provide their costs per acre for 2022 versus 2021 for the major input categories. The average for each category across all respondents is presented in Table 1. Updated commodity prices for the 2021/22 and 2022/23 marketing years and policy variables were obtained from the FAPRI-MU Bulletin #01-22 entitled U.S. Agricultural Market Snapshot, April 2022 (Table 2). While some producers were able to benefit by locking in input prices early in 2021 for this year’s crop, most indicated very little ability to lock in these prices even when using their normal tax management strategy of prepaying inputs. Simply, the input suppliers would not lock in a price until the producers agreed to take delivery. Almost every respondent stated they were going to do their best to reduce input usage in the face of the highest costs of production they had ever experienced.
Table 1. Average Percentage Change in Representative Farm Input Costs/Acre from 2021 to 2022.
Seed
Nitrogen Fertilizer
Phosphorus & Potassium Fertilizer
Herbicide
Insecticide
Fungicide
Fuel & Lube
Percentage Change 2021 to 2022
16.58%
133.62%
92.75%
64.23%
40.25%
36.02%
86.63%
Table 2. Projected Commodity Prices Reported in FAPRI April 2022 Update, Marketing Years 2021/22 and 2022/23.
2021/22
2022/23
Percentage Change
Corn ($/bu)
$5.78
$6.06
4.84%
Wheat ($/bu)
$7.60
$8.08
6.32%
Soybean ($/bu)
$13.27
$14.22
7.16%
Grain Sorghum ($/bu)
$5.87
$6.14
4.60%
Barley ($/bu)
$5.27
$5.60
6.26%
Oats ($/bu)
$4.30
$4.00
-6.98%
Upland Cotton ($/lb)
$0.910
$0.871
-4.29%
Seed Cotton ($/lb)
$0.464
$0.443
-4.53%
Peanuts ($/lb)
$0.238
$0.240
0.84%
Sunflower Seed ($/lb)
$0.318
$0.324
1.89%
Canola ($/lb)
$0.318
$0.295
-7.23%
All Rice ($/cwt)
$15.80
$15.84
0.25%
Long Grain Rice ($/cwt)
$13.75
$14.03
2.04%
The news is full of stories about inflation that is averaging 8.5 percent so far this year for the average American. The lowest year-over-year inflation farmers are seeing is twice that on seed with most categories many times higher. Commodity prices, while generally higher in 2022, are up less than 8 percent. If not for the incredible productivity of the U.S. farmer, there would be a major financial crisis in agriculture. Following are the key highlights of our report:
Net cash farm income in 2021 included a significant amount of ad hoc assistance. Absent another infusion of assistance in 2022, we estimate that significant increases in input prices will result in a huge decline in net cash farm income in 2022 (compared to 2021).
Despite the significant reduction from 2021, higher commodity prices for most crops will likely still result in positive net cash farm income for most of AFPC’s representative crop farms. The noticeable outlier is rice – two-thirds of the rice farms are facing losses in 2022.
The analysis hinges on producers receiving the higher commodity prices forecasted by FAPRI with average yields. With drought being experienced across a significant portion of the country and many other areas facing excess moisture, this assumption may be overly optimistic.
Having worked with farmers located across the U.S over the last 30 years, I want to make sure you understand we are talking about historic amounts of capital that farmers are putting at risk
Throughout my career, I have referred to the programs in Title I and Title XI as the three-legged stool that serves as the safety net for U.S. producers. The current programs, agriculture risk coverage (ARC) and price loss coverage (PLC) and the nonrecourse commodity loan program, serve as two of the legs while the federal crop insurance program serves as the third leg. The following are what I believe to be the most significant shortcomings of all three legs of the stool. Most of my suggestions require additional resources that may be difficult to secure but are necessary.
Price loss coverage (PLC) reference prices worked fine while inflation was fairly low; however, the reference prices set in the 2014 Farm Bill and continued in the 2018 Farm Bill are in dire need of increases to remain relevant. Producers’ costs have increased substantially, and the current reference prices are not providing a relevant amount of protection.
Agriculture risk coverage (ARC) was also established in the 2014 Farm Bill as a second attempt at providing producers a revenue-based safety net program to replace the overly complicated and not widely used average crop revenue election (ACRE) program first used in the 2008 Farm Bill. While good when coming off of relatively high prices, ARC proved worthless when prices declined and remained relatively flat, providing little protection to producers. This is why that while widely chosen over PLC early in the 2014 Farm Bill, ARC was largely abandoned as a choice of safety net program in recent years. Since ARC has the reference price embedded in the calculations, raising reference prices will make ARC more attractive as a revenue protection safety net alternative.
Assuming these two alternatives are used going forward, instead of forcing producers to pick the tool (ARC or PLC) they want, I would suggest allowing them to receive the benefits of whichever is higher in a given year. This would cost nothing more than if the producers have chosen wisely and selected the appropriate tool and would take a major decision away that only serves as a major distraction to their work in trying to grow a crop.
The nonrecourse marketing loan program works as it was designed more than four decades ago; however, despite modest increases for some commodities in the 2018 Farm Bill, the rates have largely remained unchanged over the past 30 years, losing ground to inflation. Providing producers the ability to take out a storage loan or receive a loan deficiency payment on a crop is a very useful marketing tool. The rates need to be raised to increase the amount of the crop that is being protected which will cost money but is significantly less expensive to do at current price levels.
Federal crop insurance is an enormously successful public-private partnership that today stands as the primary safety net tool for U.S. producers. This is due to the program largely using futures prices to annually adjust the amount of protection producers can select. While crop insurance is popular with producers, the little-known secret in the farming community is that bankers “encourage” producers to purchase buy-up levels of crop insurance as a means of protecting the producer and the operating loan banks make to producers. As I have said many times in front of Congress… do no harm to crop insurance and stop outside interest groups from tying provisions of their pet projects to crop insurance – for example, linking climate change practice adoption to insurance program subsidy levels. This runs the risk of creating an unlevel playing field for producers by distorting protection levels and leaving some producers with less protection due to their lack of feasible climate change mitigation alternatives.
While this morning’s hearing focused on Title 1 and crop insurance, I believe the upcoming farm bill provides a clear opportunity to help address some of the shortcomings ad hoc assistance was designed to address as well. In the case of WHIP, WHIP+, and ERP, they all essentially are designed to help cover the large deductibles producers face in their crop insurance policies. While the ad hoc assistance over the last 5 years has been vital, it comes LONG after the disaster has come and gone and has been limited to specific causes of loss. Perhaps most important, ad hoc assistance is, by definition, not guaranteed. Farmers already face enough risks and uncertainty – ideally, they wouldn’t have to guess at what the safety net might look like as they struggle to put a crop in the ground.
Rainfall distribution throughout the growing season is of particular importance to rainfed farming systems. For instance, significant variations in forage yields are associated with changes in annual precipitation patterns. To protect against uncertain precipitation levels, livestock and forage producers have adopted climate risk management strategies that include short- and long-term adjustments in forage supply and demand, and the adoption of weather-related crop insurance programs.
The Pasture, Rangeland, Forage (PRF) is a pilot insurance program created in 2007 as a tool to mitigate the risk of forage loss associated with the lack of precipitation. Compared to traditional crop insurance options, the PRF program is an index-based insurance, in which indemnity payments are not based on actual precipitation or forage production, but on projected deviations from historical precipitation levels. Currently, the PRF insurance program is available in 48 states, and is one of the top crop insurance programs in the country in terms of the number of acres enrolled (Figure 1). Since its launch, the number of participating acres in the PRF program has increased by 771% from 24.5M acres in 2007 to 247.8M acres in 2022. This rapid growth could be attributed to the reduced number of insurance options for forage producers, changes in program provisions, and severe drought conditions observed during this period. In contrast, 10.8M cotton acres, 36.6M wheat acres, 78.9M soybeans acres, and 83.0M corn acres were enrolled in different crop insurance programs in 2021.
Figure 1. Insured Acres by Selected Crops
Source: USDA RMA
Texas, Arizona, Nevada, New Mexico, and Utah are the top participating states in the PRF insurance program (Figure 2). In 2022, these five states represent about two-thirds or 63.7% of all participating acres in the country. Namely, 34.7M acres are enrolled in Texas, 36.5M acres in Arizona, 37.9M acres in Nevada, 27.0M acres in New Mexico, and 21.8M acres in Utah. As rainfall uncertainty intensifies, participating in the PRF program could be an effective strategy for livestock and forage producers to mitigate production risk and to increase farm income.
Beef cow culling has been an important story this year and SAT has discussed it a couple of times, but last week beef cow slaughter topped 80 thousand head for the first time since 2012, making it worth looking at again. So far in 2022, beef cow slaughter is 15 percent higher than the same period in 2021. This is equal to approximately 200 thousand more head of beef cows processed this year. Beef cow slaughter averaged about 65 thousand head per week in 2021, but is averaging about 75 thousand head per week in 2022.
Drought, higher feed and other input costs, and stronger cull cow prices continue to be the likely reasons behind the increase. Looking at the regional slaughter data, it appears that beef cow slaughter has increased more in areas with drought. Beef cow slaughter in Region 6 (AR, LA, NM, OK, and TX) is up 30 percent over 2021 and region 7 (IA, KS, MO, & NE) is up 29 percent. However, beef slaughter is also about 20 percent higher in Region 4 (AL, FL, GA, KY, MS, NC, SC & TN) where drought has not been an issue. Beef cow slaughter continues to indicate contraction of the U.S. beef cow herd in 2022.
Lightweight calf prices have dropped dramatically in recent weeks, responding to high feed costs and lower fed cattle futures prices. In the Southern Plains, calf prices have fallen by more than the normal early summer seasonal decline and may reflect some more drought forced sales. Heavy weight steers in the South have declined more than those in the Southern Plains, likely impacted by increased hauling costs as diesel fuel prices hit record highs.
In 2022, soybean planted acreage is estimated to increase 9% in the southern United States (U.S.) with a total planted acreage of 14.76 million acres. Southern states are estimated to account for about 16% of the total soybean acreage planted in the U.S. in 2022. Table 1 shows the past five-year history of soybean acreage by state. In 2022, Arkansas is expected to lead leads the southern states at 3.25 million acres, followed by Mississippi at 2.35 million acres. All southern states, except for Oklahoma and South Carolina, are expected to increase acreage in 2022, when compared to 2021. Soybean acreage in the south has substantially rebounded since 2019, when acreage was reduced due to low prices influenced by the US-China trade war. Soybean acreage across the south in 2022 is up 26 percent compared to 2019.
The observed increase in soybean acreage is influenced by a positive price outlook. On May 12th, USDA released their monthly World Agricultural Supply and Demand Estimate (WASDE) report. The May WASDE provided the first USDA projections for the 2022/23 marketing year for soybeans (and other crops). In this report, USDA projects the national average farm price for soybeans in 2022/23 to be $14.40/bushel. If realized, this price would match the record high achieved in 2012. The positive price outlook is supported by higher exports and domestic crushing on the demand side, compared to 2021. The supply side calls for higher production due to increased acreage, which increases estimated ending stocks to 310 million bushels. However, with a stocks-to-use ratio of 6.76 percent, the overall market environment is supportive of higher soybean prices.
Even with the positive price outlook, it’s important for producers to have a marketing plan in place to take advantage of the current high prices in the market. The new crop soybean Nov’22 futures has been trending higher since January 12th, with a closing price of $15.12/bushel as of May 25th. While prices are currently high, we continue to see considerable price volatility and producers should familiarize themselves with available tools to mitigate price risk. Available tools for price risk mitigation include forward cash sells on portions of expected production or hedging using the futures market. Another tool to consider is forward pricing with options which was covered in a recent Southern Ag Today article by Dr. John Robinson with an application to cotton markets (Forward Pricing with Options on ICE Cotton Futures – Southern Ag Today).
Table 1. Soybean Planted Acreage in U.S. Southern States, 2018-2022 (1,000 acres)
State
2018
2019
2020
2021
2022*
Alabama
345
265
280
310
350
Arkansas
3,270
2,650
2,820
3,040
3,250
Georgia
145
100
100
140
170
Kentucky
1,950
1,700
1,850
1,850
2,000
Louisiana
1,340
890
1,050
1,080
1,200
Mississippi
2,230
1,660
2,090
2,220
2,350
North Carolina
1,650
1,540
1,600
1,650
1,800
Oklahoma
640
465
560
580
560
South Carolina
390
335
310
395
390
Tennessee
1,700
1,400
1,650
1,550
1,850
Texas
175
80
120
110
160
Virginia
600
570
570
600
680
Total
14,435
11,655
13,000
13,525
14,760
* Estimate as of March 31, 2022 Prospective Plantings report. Source: USDA-NASS