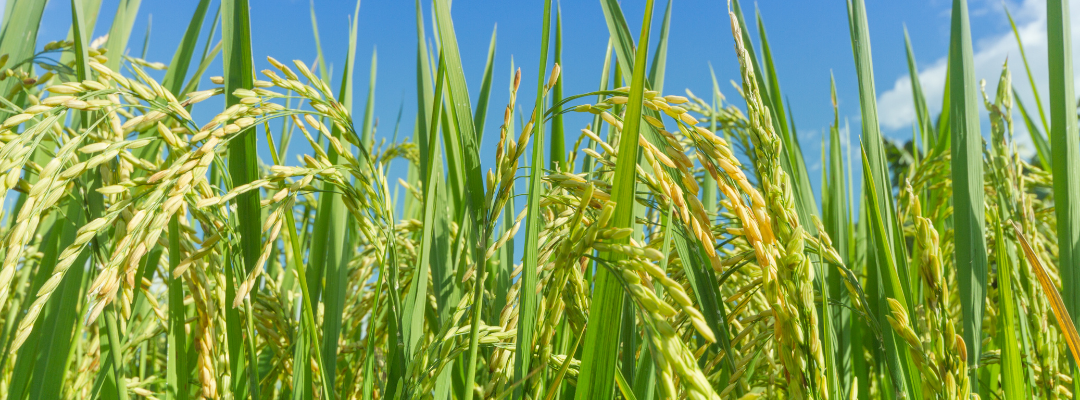
The U.S. has consistently ranked among the top-5 rice exporters in the world. However, since hitting a record 3.98 million metric tons (mmt) in 2002, U.S. rice exports have shown a downward trend, reaching 2.98 mmt in the marketing year 2020/21. The decrease in US exports contrasts with a growing global rice market and results in a significant drop in the US share in global rice exports in the last two decades. The decrease in U.S. exports is exclusively a result of a drop in long-grain rice exports since exports of medium- and short-grain rice have shown a positive trend. Long-grain rice is the main type of rice produced in the Mid-South, accounting for over 91% of the volume of production.
In the last 20 years, exports of long-grain rice to North America and the Caribbean, the two largest market destinations, have grown marginally (less than 1% a year), while those to Central America and the Middle East have decreased moderately (between 1 and 2% a year on average). Exports to Europe have not recovered since the GM-contamination case in the mid-2000s. Exports to Mexico, the largest market for US long-grain rice accounting for a quarter of total exports in the period 2018-2020, show almost no growth since the early 2000s, and more recently are in a downward trend as competition from other suppliers, primarily Mercosur, grow. Haiti remains a core and growing market for US rice, but one plagued with risks and uncertainty. Competition in Central America, primarily from Mercosur, is eroding the market share of US rice despite its preferential access under DR-CAFTA.
Efforts are being made to improve the competitiveness of US rice, particularly when it comes to rice quality. The US was once regarded as the golden standard for long-grain rice quality, but many will argue that is a thing of the past. The blame goes far and wide as to why the quality of US long-grain rice has diminished, but what matters is that the industry is taking steps to address the issue. The US exports around half of its rice crop every year, so working on regaining competitiveness in the global market is of utmost importance.
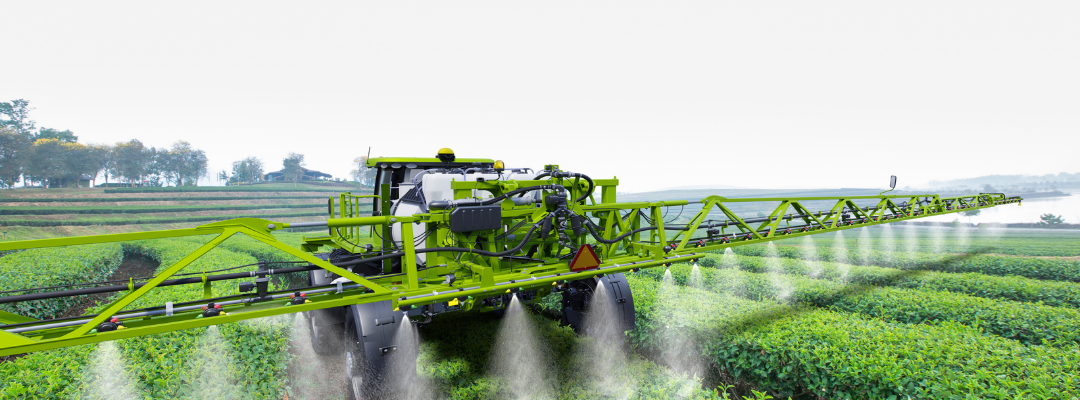
Irrigation water can be one of the largest expenses associated with rice production, particularly when energy prices are high as in the current production season. Multiple inlet rice irrigation (MIRI) has potential to reduce the cost of applying irrigation water to rice. MIRI uses poly pipe to distribute irrigation water to all rice paddies simultaneously. This differs from conventional cascade flood in which water is applied to the first paddy at the top of the field and then flows over spills to lower paddies until the entire field is flooded. Fields are flooded much faster with MIRI. Based on examples in Arkansas, applied water savings of up to 25 percent are achievable with MIRI relative to cascade flood. Other potential benefits of MIRI relative to cascade flood include reduced irrigation labor and higher rice grain yields. Labor is reduced with MIRI due to less adjustment of levee gates and better management of water depth during the growing season. Yields can be 3 to 5 percent higher under MIRI due to a reduced “cold water” effect at the top of the field (more cold water concentrated at top of field with cascade flood) and improved nitrogen efficiency due to faster flooding of the field.
Figure 1 presents rice irrigation variable costs per acre for both cascade flood and MIRI. Irrigation variable costs include energy, repairs and maintenance, irrigation labor, and for MIRI, the additional cost of poly pipe pick-up and removal. Rice irrigation variable costs are presented for three total dynamic head (TDH) levels (80 ft, 100 ft; 120 ft), and assume 32 acre-inches of water are applied under cascade flood and 24 acre-inches of water are applied under MIRI during the growing season. Both applied water amounts are typical water amounts for cascade flood and MIRI as reported in the Arkansas Rice Production Handbook.
Irrigation variable costs are presented for both diesel and electric power. Irrigation energy costs were calculated based on diesel and electric energy consumption data from McDougal (2015). A diesel price of $3.94/gallon and an electric price of $0.138/kWh were used in the energy cost calculations. The diesel price comes from 2022 Arkansas field crop enterprise budgets, while the electric price represents a median price estimated from electric rate schedules for irrigation from various electric cooperatives located throughout eastern Arkansas. Irrigation labor is charged at $11.33/hour, also from 2022 Arkansas field crop enterprise budgets.
Irrigation variable costs are much lower for electric power than for diesel power (Figure 1). Farmers have switched many of their diesel irrigation motors to electric motors because the cost of electricity has been lower and less variable over time relative to the cost of diesel. Irrigation variable costs are lower for MIRI than for cascade flood at all TDH levels. Lower costs are associated with less applied water and lower irrigation labor under MIRI. Monetary savings from MIRI are greater for diesel power than for electric power because applied water costs are much greater under diesel power than under electric power. Applied water cost for diesel power ranged from $5.35/acre-inch at 80 ft TDH to $8.02/acre-inch at 120 ft TDH. In contrast, applied water cost for electric power ranged from $2.10/acre-inch at 80 ft TDH to $3.15/acre-inch at 120 TDH. Diesel irrigation motors could potentially receive larger monetary payoffs from MIRI than electric irrigation motors on farms. Nonetheless, rice fields supplied with irrigation water by both diesel and electric motors could potentially benefit monetarily from MIRI relative to conventional cascade flood irrigation.
References and Resources
McDougall, W. M. (2015). A Pump Monitoring Approach to Irrigation Pumping Plant Performance Testing. Graduate Theses and Dissertations Retrieved from https://scholarworks.uark.edu/etd/1146
The latest CPC-IRI Forecast of the Niño/Southern Oscillation has increased the probability of being in a Niña season through summer and fall (Graph 1). La Niña patterns typically bring drought to the Southern Plains. The risk of continuing to suffer the consequences of being in a drought is increasing day after day. The chance of a third consecutive Niña, is rising. The sooner we get prepared for it, the higher our chances of successfully implementing a drought management plan, saving costs, and having a solid business in the future.
Graph 1. CPC-IRI Official Probabilistic ENSO Forecast.
Most cow-calf production is highly dependent on rainfall. With very high input and feeding costs, a drought management plan should incorporate more than one strategy to lessen adverse economic impacts. It should also consider future restocking strategies given the business’s financial position, long-term profitability, cash-flow, years to rebuild your livestock equity lost during drought, and other productive variables such as forage productivity, genetics, or leasing alternatives.
Our model analyzed the impact of integrating drought management practices to mitigate losses and reduce risk (https://vernon.tamu.edu/extension-projects/d3-agricultural-economics/). Integrating these proactive and reactive strategies such as early weaning, early culling, pre-stocking hay, destocking, and restocking strategies has a significantly higher economic and financial impact than each strategy. These strategies resulted in a $426 saving per breeding cow unit (BCU) during year one.
Other pro-active strategies like USDA’s Pasture, Rangeland, and Forage Insurance (PRF) are essential tools that can be implemented in many cases. PRF showed a positive net benefit in many cases, but most importantly, it generated significant payments in drought years when it was needed most.
Unfortunately, droughts always have a negative effect on our companies. Waiting for it to rain to solve problems has not always been the best solution. These types of tools will help you prepare your operation given your production data, financial position, experience, and future expectations.
The war between Russia and Ukraine has upended grain flows from the Black Sea region for months. Since the first days of fighting in late February, Ukraine’s export terminals in the southern part of the country have been closed. This from a nation that provides 10 percent of the world’s wheat exports and 12 percent of global corn exports.
As fighting continues, the threat to grain supplies extends beyond the export of old crop grain (2021/2022 marketing year) to the production of the 2022 crop. Russia, with its military control of the region, may still be able to provide wheat to its trading partners. The world wheat trade has other participants that may be able to increase their sales.
The impact of the conflict on the feed grain market may be harder to compensate for. Ukraine is the fourth largest corn exporter, 23 mmt in 2021/2022, 12 percent of the world total, and there are not many other major export providers of feed grain. After Ukraine, the next largest corn exporter is the EU at 4.9 mmt or 2.5 percent of total exports. Much uncertainty surrounds Ukrainian agriculture and market participation in the upcoming crop year in terms of productive capacity, foreign market access, and export controls due to domestic food security concerns. What will the implications be for 2022 world feed grain fundamentals—supply and demand—without the contribution of Ukrainian agriculture?
In this article, feed grain statistics are those reported for world coarse grains by USDA (corn, sorghum, barley, oats, rye, millet, and mixed grains) as well as wheat for feed. Since 1980, wheat for feed has constituted about 20 percent of total world domestic wheat use (Figure 1). The contribution of wheat as a feed grain for this analysis will be 20 percent of total wheat production, use, and stocks.
Without Ukraine, feed grain supplies in the 2022/2023 marketing year would decrease by about 60 mmt: 53 mmt for coarse grains and 7 mmt of wheat (USDA, WASDE, 2022). A simple linear regression model of the response in consumption to a supply change in feed grains yields a regression coefficient of +0.34, in that a 60 mmt decrease in supply would have an estimated 20 mmt decrease in use (Figure 2).
Using those estimates, without Ukraine, the feed grain days of use on hand at the end of the marketing year would fall to a 78-day supply in the 2022/2023 marketing year, down from an 85-day supply for 2021/2022. This extends the downward trend of the last six years, a time frame in which the marketing year average price of corn, which accounts for over 70 percent of all feed grains, has increased from $3.36 per bushel to a current estimate of $5.80 per bushel. This would be the lowest days of use on hand number since 2013/2014 (Table 1 and Figure 3). The years of tightest stocks to use in feed grains (lowest days on hand) since 1980 was from 2003/2004 to 2012/2013.
If, instead of a complete loss, the supply of feed grain in the upcoming marketing year from Ukraine were to decline by half, that would reduce world feed grain supplies by 30 mmt and use by about 10 mmt. The resulting days of use on hand at the end of the marketing year would be an 81.6-day supply. The impact of the Russia/Ukraine conflict is having severe and significant impacts on the world grain trade. In the short term, this impact is creating the tightest supply situation for feed grains that we have seen in the last ten years. The World Food Program’s emergency coordinator in Ukraine expects 20 percent of planted acres will not be harvested this July and that spring planted area will be down by about one third (Reuters, 4/21/2022). Even if this conflict were to be resolved relatively soon, damaged infrastructure will limit commodity shipments for an extended period of time. The longer drawn out the conflict, the greater the magnitude of fundamental adjustments that will be required
Figure 1. World wheat feed use as a percentage of total domestic use, 1980/1981-2021/2022
Figure 2. Response in feed grain use to a change in feed grain production
Table 1. World feed grain production, use, stocks, days on hand, and the corn marketing average farm price
Beginning stocks, mmt
Production, mmt
Use, mmt
Ending Stocks, mmt
Days on Hand
U.S. Corn MYA $/bu
2016/2017
399
1,566
1,526
438
105
3.36
2017/2018
438
1,514
1,524
428
103
3.36
2018/2019
428
1,545
1,561
406
95
3.61
2019/2020
406
1,570
1,572
396
92
3.56
2020/2021
396
1,592
1,610
379
86
4.53
2021/2022
379
1,657
1,655
386
85
5.80
2022/2023 est
386
1,597
1,634
349
78
Figure 3. World feed grain production, use, and days of use on hand at the end of the marketing year, 1980-2021, and 2022 estimate
Fertilizer prices exploded during the past year and are now further fueled by the Ukraine conflict. Interest rates have also increased substantially. There is a theory, associated with economist John Taylor that for every percentage point of inflation, interest rates should be raised by a similar percentage. That principle would suggest that our interest rate climb is not over. Numerous articles have discussed the impacts of these trends on farm and ranch profitability. Many producers are also member-owners of agricultural supply cooperatives. Those cooperatives are also impacted by both fertilizer prices and interest rates.
The impacts can be illustrated using a cooperative financial simulator developed at Oklahoma State University. Prior to interest rate and fertilizer increases, the representative wheat marketing and farm supply cooperative had a return on assets of 6.8% and a return on equity of 11.5%. The representative cooperative distributed 50% of profits as cash patronage and needed 29% to service an 18-year equity revolving program. The remaining retained profits allowed the cooperative to grow at an annual rate of 2.4%. If interest rates and fertilizer prices double, the cooperative must either increase farm supply profit margins by 8% or reduce cash patronage to 45%. The impacts are even more dramatic if members expect to maintain the value of their equity position in the cooperative. If length of the equity revolving period is reduced to 10 years, the cooperative must either reduce patronage from 50% to 35% or increase farm supply margins by 42%.
These results illustrate the challenges that will be faced by cooperative boards of directors. In coming months, protecting the financial viability at the cooperative level may require increases in margins or reduction in cash patronage. If interest rates impact producer expectations of equity revolving periods, those challenges will be even more substantial. Cooperative boards may be tempted to try to isolate the members from increasing interest and inventory costs. The danger of that strategy is that cooperative’s reserves and growth rate may be reduced to the point that it will not be in a position to serve future members (Table 1).