Blog

  • Flex Leases for Crop Producers

    Flex Leases for Crop Producers

    One of the biggest challenges to farmers and landowners is negotiation of farmland leases in a manner that leaves both parties satisfied. Too often, fixed cash leases are negotiated and within a short period of time one person or the other is getting less than they think they should. One solution to this is to re-negotiate fixed cash leases on a regular basis and recognize that they will need to be changed to reflect the variability in the market and/or production conditions. Another solution is a flex lease.

    Flex leases are designed with a base cash rent amount (negotiated at the beginning of the season) and a flexible “bonus” amount that depends on either market prices, yields, or both. The idea is to guarantee the landowner a certain amount of rent and have both parties share in the good times as well as the bad times. When set up correctly, they will adjust for changing revenue conditions.

    The base rent needs to be calculated at the beginning of the season and is often tied to a published or well-documented measure.   A couple of options might be: a negotiated premium/discount from the county-average rent from USDA or a percentage of historical gross revenues from the leased farm (for example 15-20%). The flex component (determined at the end of the season) can be calculated as a percentage of actual gross revenue or a measure of gross margin (gross revenue less variable costs of production). For example, you might make the flex component of the payment 20-30% of gross margin.  Another flex component could be a discount in the base rent if total costs are not covered so the landowner shares in the downside risk.

    A few things to remember, as you negotiate a flex lease:

    1) WRITE IT DOWN, don’t rely on a verbal agreement,

    2) Keep the calculations simple and transparent to avoid misunderstandings, and

    3) Be willing to renegotiate if things get out of line, which can happen with big swings in farm profitability.

    Flex leases should encourage communication between landowner and tenant, which will help in overall lease negotiation.

    Taylor, Mykel R. . “Flex Leases for Crop Producers“. Southern Ag Today 2(12.3). March 16, 2022. Permalink

  • Cull Cow Prices Skyrocket

    Cull Cow Prices Skyrocket

    War has contributed to cattle market uncertainty and sharply higher feed costs, record-high cattle on feed, and falling cutout values have hit heavy feeder prices hard.  But, cull cow prices have continued to skyrocket since the beginning of the year, shooting past $75 per cwt in the Southern Plains.  A year ago, 85-90% lean cull cows averaged about $46 per cwt.

    Cow prices are increasing in spite of large cow slaughter.  Cow slaughter during the first two weeks of February totaled 145,000 head, or more, per week.  That is the largest weekly slaughter since December 2012.  Beef cow slaughter is extremely large, rivaling peak Fall slaughter levels.  This large beef cow slaughter is coinciding with seasonally large dairy cow slaughter, which typically peaks early in the year. 

    High cow beef prices are providing some insight into beef demand.  Both the cow beef cutout and the wholesale 90 percent lean beef for ground beef are well above a year ago, at $229 and $284 per cwt, respectively.  But, wholesale middle meat prices have dropped in recent weeks with both wholesale ribeye and strip loin prices lower than last year.  Consumers may be shifting purchases to more ground beef and fewer steaks in response to high retail prices.

    Increasing milk prices should slow dairy culling in the coming weeks.  Beef cow culling is going to be greatly influenced by drought and costs.  The rate of culling over the last year should have already moved older, less productive cows.  Reduced dairy culling should pull down total cow slaughter and support prices in the coming weeks.

    Anderson, David. “Cull Cow Prices Skyrocket“. Southern Ag Today 2(12.2). March 15, 2022. Permalink

  • Ukraine-Russia Implications in Grain and Oilseed Markets

    Ukraine-Russia Implications in Grain and Oilseed Markets

    Global commodity markets have been affected by the Russian invasion of Ukraine on February 24, 2022. Energy prices have skyrocketed.  The American Automobile Association estimated the national average gas price in the United States at $4.32/gallon on March 10. Implications of the conflict are far reaching, affecting nearly all aspects of the global economy. Agricultural producers have been affected on two fronts, input prices (fuel, fertilizer, etc.) and commodity prices (wheat, corn, and soybeans). The focus of this article is the impact on grain and oilseed markets and marketing tools that producers may want to consider to help mitigate price risk.

    Ukraine is an important producer and exporter of wheat, corn, barley, and sunflower seed products.  Table 1 shows Ukraine’s share of world production and their share of world exports for these commodities. While Ukrainian corn represents only 3.5% of world production, it accounts for 13.8% of world exports.  Meanwhile, Ukraine produces almost a third of the world’s sunflower seed, which is then turned into about half of the world’s meal and oil exports.  Sunflower seed oil production and exports in Ukraine have some ramifications for soybean oil and soybean prices as imperfect substitutes.

    Table 1. Ukraine’s Share of World Production and Exports for Select Commodities, 2021/22

     WheatBarleyCornSunflower SeedSunflower Seed MealSunflower Seed Oil
    Production4.2%6.8%3.5%30.6%27.5%30.6%
    Exports9.8%16.7%13.8%4.8%58.0%47.3%

    Source: USDA PSD https://apps.fas.usda.gov/psdonline/app/index.html#/app/home

    Volatility in corn, wheat, and soybean futures markets have been extreme (Figures 1-3). For example, daily price changes for July wheat for the past ten trading days have been: -75, 67, 50, 74.25, 75, 59, 77.25, -57.25, -85, and -67.5 cents. Extreme volatility can make marketing decisions challenging and potentially expensive. However, volatility also often provides opportunities for profit. Three months ago, every farmer would have jumped at the ability to sell wheat futures at $9.00; now farmers can set a futures price floor at $9.62. Purchasing put options is expensive – $1.48 for an at-the-money put as of March 9. However, with a gap between the fall crop insurance price of $7.14 and current market offerings of $11.10, taking some additional downside risk off the table while leaving the top side open is a prudent move.

    Corn and soybean projected crop insurance prices were set 10 days ago at $5.90 and $14.33, respectively. Harvest futures prices on March 10 were $6.50 for corn and $14.95 for soybeans, an increase of 60 and 62 cents, respectively. Producers should be asking themselves at what point they should take some additional price risk off the table. Being too aggressive with setting prices (i.e. cash forward contracts and short hedges) should be approached cautiously as producers need to avoid exchanging price risk for production risk or selling their way out of a bull market. However, managing the downside price risk should be on every producer’s mind, particularly with input prices at elevated levels.

    Grain and oilseed markets are likely to remain unpredictable, due to uncertainty generated from the Russia-Ukraine conflict. Producers should consider how much of the 2022 crop they are comfortable pricing at this point in the year and how they can protect the downside of this market while keeping the upside open. Options strategies will be expensive but should be fully explored based on current market conditions.

    Figure 1. Daily July Wheat Futures, January 3 to March 10, 2022

    References and Resources:

    USDA – Foreign Agricultural Services. Production, supply, and distribution (PSD). Accessed at: https://apps.fas.usda.gov/psdonline/app/index.html#/app/home

    Barchart.com. Corn soybean and wheat historical futures prices. Accessed at: https://www.barchart.com/futures/grains?viewName=main

    AAA – https://gasprices.aaa.com/

    Smith, Aaron. “Ukraine-Russia Implications in Grain and Oilseed Markets“. Southern Ag Today 2(12.1). March 14, 2022. Permalink

  • Locally Raised Meats:  Cooperatives Needed

    Locally Raised Meats: Cooperatives Needed

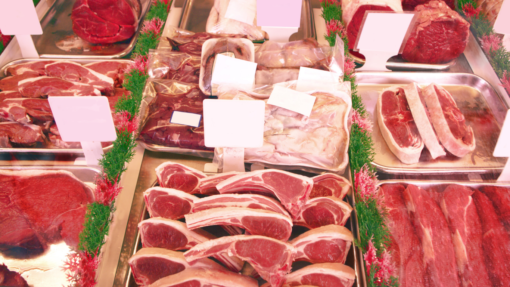
    As a result of COVID-19 grocery store shortages, federal and state governments are investing in local food systems with meat processing high on the list. However, once local meat processing bottlenecks have been relieved, additional obstacles will need to be overcome. Clemson surveys of consumers and restaurants in 2020 and 2021 reveal that additional obstacles for increasing local meat sales are availability, price, and inconsistent quality1.

    A lack of availability points out that there are not enough sales outlets for local meats and purchasing local meats is often inconvenient for potential customers. For instance, most local meat consumers visit a farmers’ market once a month2 yet shop at a grocery store 2-3 times per week3. Even the most dedicated local food consumer sources less than 50% of their groceries from local producers4. For local meats to grow long-term, producers must work together to supply grocery stores and restaurants while addressing the remaining issues of quality inconsistency and price.

    One of the best ways for farmers to work together is to form a cooperative or similar collaborative business arrangement. Through collaborative business arrangements, local meat producers can adopt quality guidelines, provide a consistent supply to more sales outlets, and operate at a more efficient scale (possibly becoming more price-competitive). In short, business collaborations will give local meat producers a shot at gaining and maintaining a competitive position in the market.

    For more information about cooperatives and collaborative business formation, contact a land grant university or cooperative development center in your region. Contact information for USDA rural cooperative development centers can be found at this link:

    https://www.rd.usda.gov/sites/default/files/cooperative_development_centers_february2022.xlsx

    References

    1. Richards, S. (2021). National Restaurant Buyer Survey Results. Clemson University (Unpublished report). Copy in possession of the first author.
    2. Richards, S. (2020). Local Meat Consumer Survey Results. Clemson University (Unpublished report for Berkeley Electric Cooperative and the South Carolina Cattlemens’ Association). Copy in possession of the first author.
    3. Ver Ploeg, M., Larimore, E., & Wilde, P. (2017). The Influence of Food Store Access on Grocery Shopping and Food Spendingers.usda.gov
    4. Cicatiello, C. (2020). Alternative food shoppers and the “quantity dilemma”: a study on the determinants of their purchases at alternative markets. Agricultural and Food Economics8(1). https://doi.org/10.1186/s40100-020-00160-6

    Richards, Steve. “Locally Raised Meats: Cooperatives Needed“. Southern Ag Today 2(11.5). March 11, 2022. Permalink

  • Trade Implications of Russia’s Invasion of Ukraine

    Trade Implications of Russia’s Invasion of Ukraine

    The Russian invasion of Ukraine has impacted financial and energy markets, as well as agricultural markets, increasing price volatility for major commodities.  Russia and Ukraine are not major markets for US agricultural exports, ranking 56th and 80th, respectively.  Before 2014, when Russia invaded Crimea, US exports of agricultural products ranged between $1.2 to $1.7 billion annually.  Afterwards, US agricultural exports to Russia have been around $250 million annually, with animal products (e.g., beef, poultry) taking the largest hit (USDA, 2022).  Moreover, neither Russia nor Ukraine are major exporters of agricultural products to the US; the US ranks 55th and 53rd, respectively.  That said, both Russia and Ukraine are major players in the international wheat and corn markets.  In 2020, Russia was the largest wheat exporter reaching almost $8 billion, while Ukraine was fifth with almost $3.6 billion in wheat exports.  Moreover, Ukraine is the fourth largest corn exporter reaching almost $5 billion, while Russia is the 11th with $400 million in 2020 (UN Comtrade, 2022).  Since Russia and Ukraine’s marketing year ends at the end of May, the impacts of the Russian invasion on their wheat and corn exports this marketing year could be minimal. On the other hand, it is unknown the extent of infrastructure damage for hauling and shipping, or the impact of shipping restrictions in the Black Sea that could slow down or increase the cost of trade.  Finally, Russia accounts for 14 percent of the world’s nitrogenous fertilizer exports and is the leading supplier of urea to the US. Additionally, Russia and Belarus accounts for about 20 percent of US potash imports (USDA, 2022). The sanctions again Russia and Belarus (for supporting the Russian invasion) could hurt US agricultural producers as they are already experiencing record high fertilizer prices.

    UN Comtrade (2022). https://comtrade.un.org/
    U.S. Department of Agriculture (USDA) (2022). Global Agricultural Trade System. Foreign Agricultural Service. https://apps.fas.usda.gov/gats/default.aspx
     

    Figure 1. Top Wheat Exporting Countries: 2020

    Source: United Nations Comtrade Database, 2022

    Figure 2. Top Corn Exporting Countries: 2020

    Source: United Nations Comtrade Database, 2022

    Ribera, Luis, and Andrew Muhammad. “Trade Implications of Russia’s Invasion of Ukraine.” Southern Ag Today 2(11.4). March 10, 2022. Permalink