Producers across the United States benefited from the Coronavirus Food Assistance Program (CFAP) 1.0 and CFAP 2.0 programs aimed at providing assistance for losses due to the COVID-19 pandemic. CFAP 1.0 provided more than $10 billion in payments on over 600,000 applications. CFAP 2.0 provided almost $14 billion in payments along with top-up payments for acreage based commodities totaling another $4.8 billion from over 900,000 approved applications.
CFAP 2.0 provided broader coverage than the CFAP 1.0 program that limited eligibility to only those crops experiencing a 5 percent decline while focusing on unsold inventories from 2019, left out HRW wheat, and only protected livestock inventories on the farm as of January 15th, 2020.
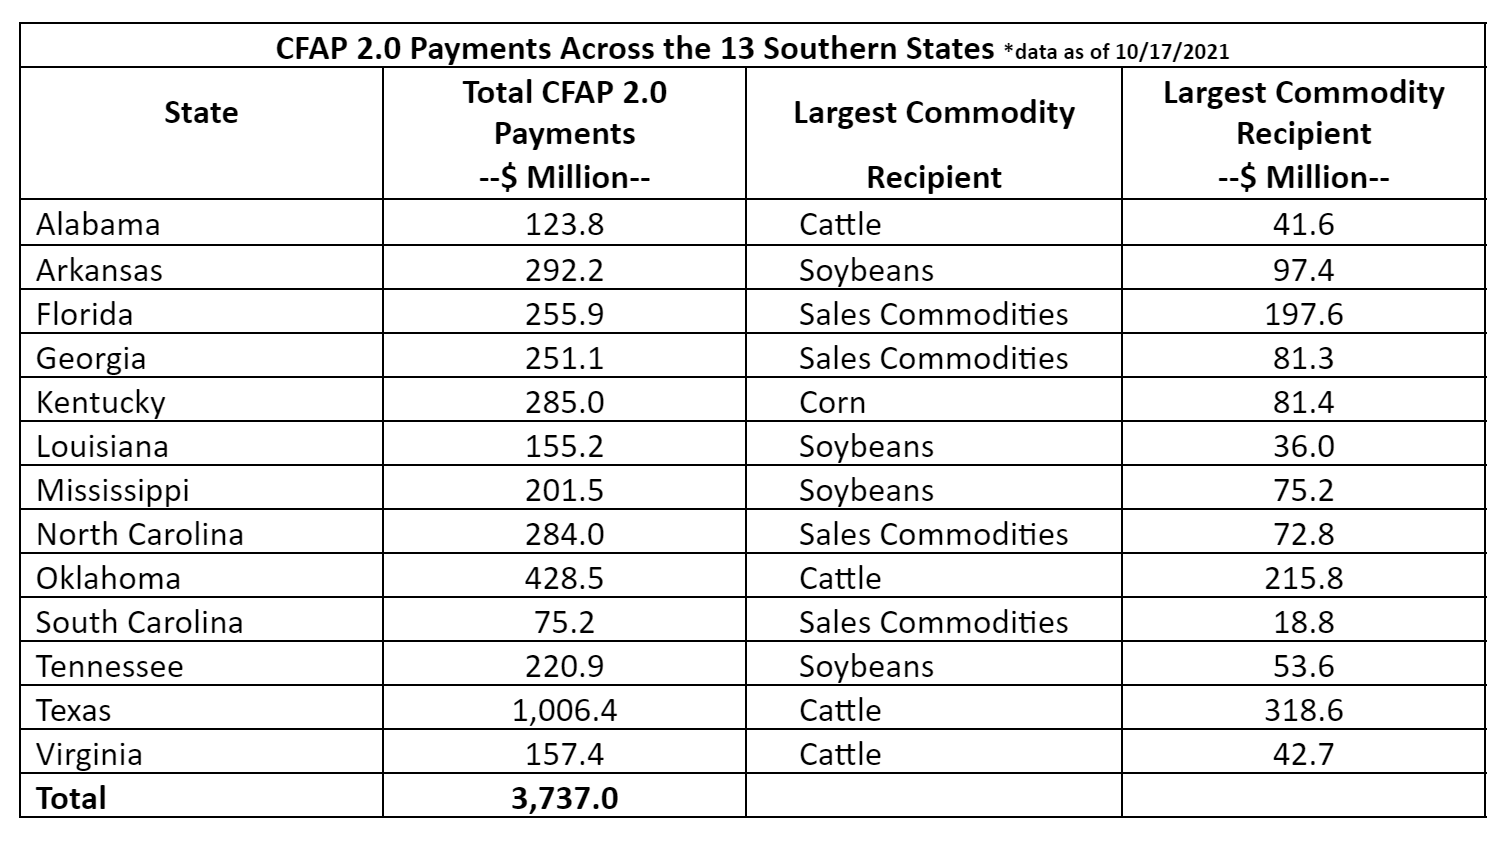
CFAP 2.0 was widely accessed by producers across the South with the 13 southern states accounting for $3.7 billion or nearly 27 percent of the payments. Soybeans, cattle, and sales commodities were the highest commodity categories in four states each, while corn was the highest in Kentucky. Sales commodities include specialty crops, aquaculture, nursery crops and floriculture, and other commodities not included in the price trigger and flat-rate payment categories.
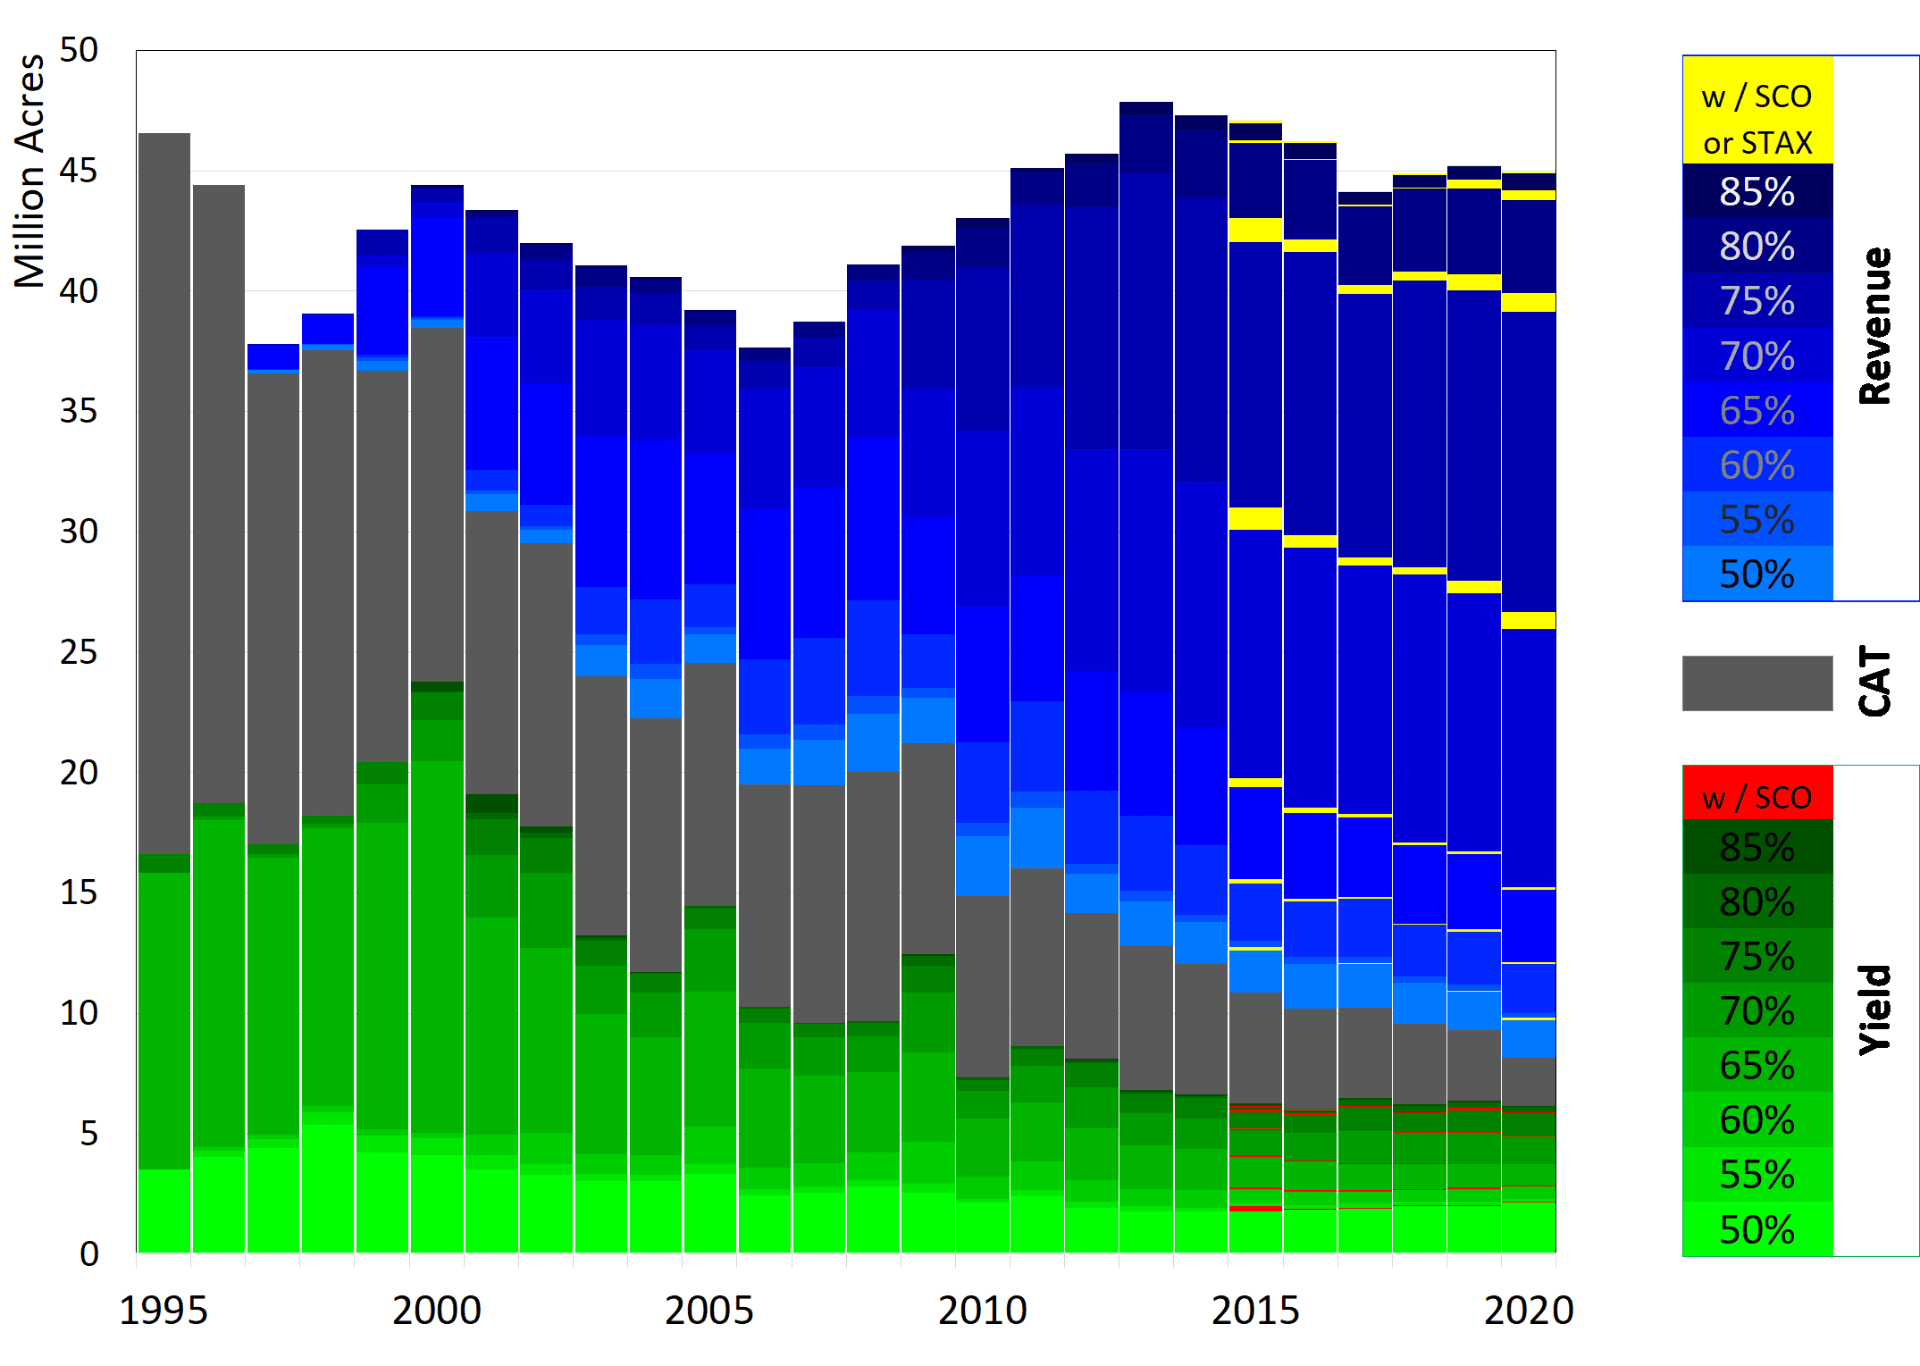
From 1995-2020, available products and program changes have dramatically shifted the profile of crop insurance products used by Southern ag producers. In that time, producers in 13 Southern states have typically covered around 40 to 45 million combined acres across 7 major commodities.
In 1995, over 45 million acres across the South were covered by a limited offering of yield only type products. Two products covered almost 91% of insured acres. Catastrophic coverage (50% yield and 55% price) carried nearly 30 million acres with another 12.35 million under 65% APH. As revenue products [Revenue Assurance, Crop Revenue Coverage, and Revenue Protection (RP)] were developed and incentive structures evolved, producers (and in no small part, their lenders) have come to rely heavily on revenue protection at higher buy-up levels. By 2007, 50% of the acres were covered by a revenue type product, and by 2020 that share had grown to over 80%. Two coverage levels, 70% RP and 75% RP, dominate all other product types/levels, accounting for over half of the acres (24.7 of 44.9 million acres) covered in 2020.
Southern Crop Acres Insured by Product Type/Level
Source: USDA, Risk Management Agency Summary of Business. Total annual acres covered across 13 Southern states (AL, AR, FL, GA, KY, LA, MS, NC, OK, SC, TN, TX, and VA) for 7 crops (Corn, Cotton, Grain Sorghum, Peanuts, Rice, Soybeans, and Wheat). Yield Coverage includes: APH, YP, and PNT. Revenue Coverage includes: CRC, RA, RP, and RPHPE
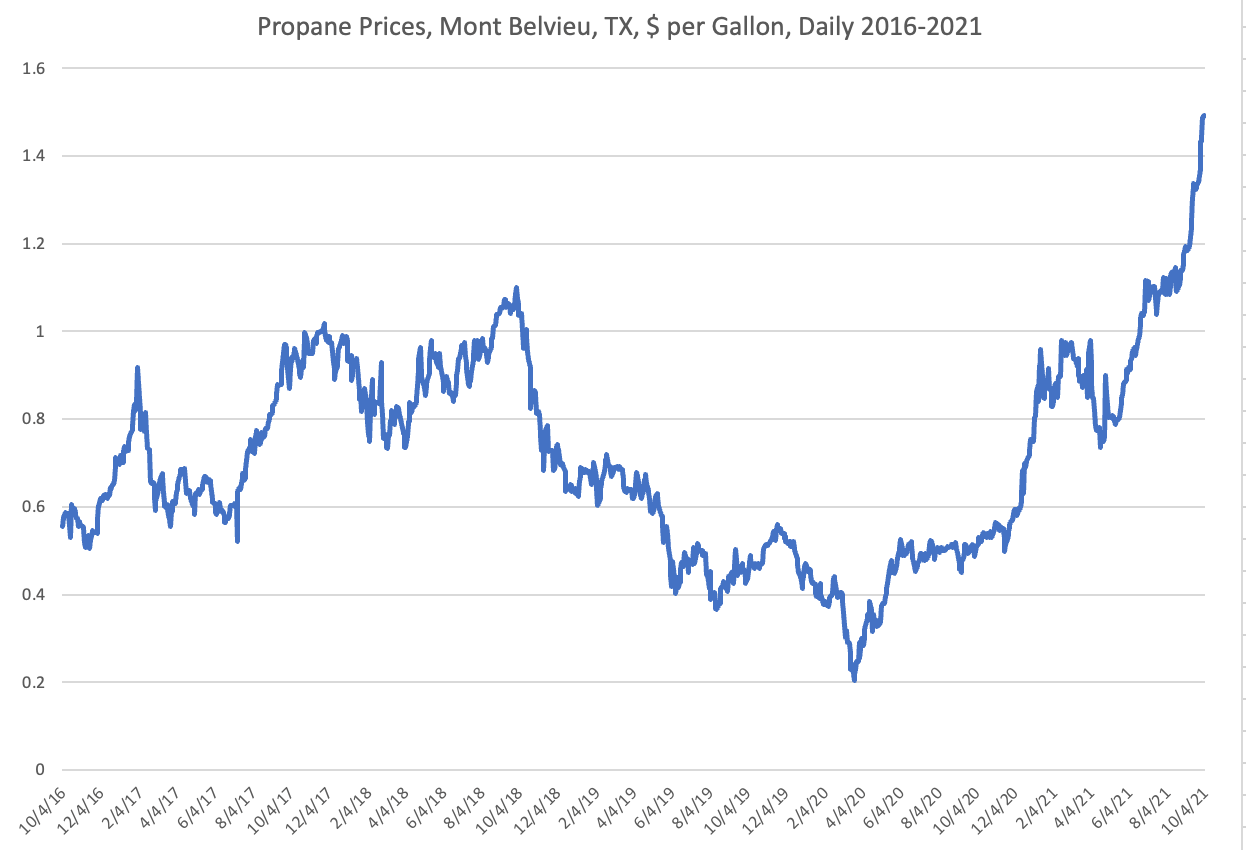
Poultry growers across the southeastern broiler belt are watching heating fuel prices closely. Most commercial poultry houses are heated with either liquid propane (LP) and natural gas (NG) and heating costs can account for upwards of 40% of the annual cost of production. Currently, commodity trading prices of LP and NG are at 5-year highs. The reasons for this are multi-faceted but are closely related to a national supply deficit approaching 30 million barrels of LP per the latest U.S. Energy Information Center’s inventory update. Additionally, the NG crisis in Europe and Asia created a driver for prices to move higher as traders buy BTUs across the energy spectrum. Since LP is primarily a byproduct of crude oil & NG production, recent disruptions in offshore oil and the overall decrease in domestic oil production has shortened LP supply. Natural gas price has moved up 2.5x in the past year. This has a major impact on propane prices as natural gas acts as a price floor for propane. These factors, along with higher trucking costs, are indicators that LP prices could continue to rise this winter and reach all-time highs in the short-term. The bottom line for poultry growers is to do all they can now to prepare for significantly higher heating fuel costs this winter. This includes considering available price security options sooner rather than later and doing all the tightening up and insulating of their houses they can manage. It could be a long winter.
Events culminating in the fall of 2020 set a course for much higher feed grain prices in the 2021 crop year. In June of 2020, USDA was projecting a record U.S. corn crop just shy of 16 billion bushels. However, the severe “derecho” windstorm of August 2020 damaged corn fields from eastern Nebraska to Ohio, the most costly thunderstorm event in U.S. history. By January 2021, with the damage assessments accounted for, the crop size was reduced to 14.2 billion bushels. In Brazil, corn production in the 2020/2021 marketing year was reduced due to heat and drought in critical corn producing areas. Early season estimates of a record 4.3 billion bushel Brazilian corn crop ended with a disappointing 3.4 billion bushels.
Then, China began buying feed grain. Imports of corn and sorghum to China had fallen to 202 million bushels in the 2018/2019 marketing year. By the end of 2020/2021, these coarse grain import levels had grown to 1.35 billion bushels, with 1.41 billion projected for 2021/2022. In the U.S., thanks to record exports, corn days of use on hand at the end of the marketing year fell below the critical 40-day threshold to a 29-day supply to end 2020/2021, the lowest since the 27-day supply that ended the drought year of 2012/2013 (see Figure 1).
Figure 1. U.S. corn average farm price and days of use on hand at the end of the marketing year, 2005/2006-2020/2021, 2021/2022 estimate
Source: USDA, WASDE, September 2021
Tight supplies and strong demand caused grain prices to surge from the fall of 2020 through summer 2021. In August 2020, the national average price for corn in the U.S. was $3.12 per bushel. By July 2021, the average cash price was $6.12 per bushel, the highest since 2013. With these prices as production incentives and normal weather forecasts, global corn production in the 2021/2022 marketing year is projected to break through the 45-billion bushel barrier (see Figure 2). Record crops are projected for major export competitors Brazil, Argentina, Ukraine, and Russia. U.S. days of use on hand at the end of the 2021/2022 marketing year is now projected to be a 35-day supply, a six-day increase compared to the year before.
Figure 2. World Corn Production
Source: USDA, WASDE, Sptember 2021
These same forces will likely shape feed grain prices in 2022. As we wrap up the 2021 crop in the Northern Hemisphere, prices are still relatively high but profits next season will be squeezed by higher input costs. Export demand, driven by the need for feed in China, will continue to drive global corn consumption.
With normal weather, the trend line corn yield in the U.S. for 2022 will be just above 178 bushels per acre, two bushels per acre higher than in 2021. Even if acres hold steady, that would mean a corn production increase over 2021 (add in higher beginning stocks as well). If total use is unchanged (largely impacted by the level of export competition), days of use on hand at the end of the 2022/2023 marketing year will likely continue to increase, putting downward pressure on prices.
On September 28th, ICE cotton futures closed above a dollar for the first time since 2011. Over the past year, the cotton market has been bullish, with prices following a long-term upward trend. On April 1, 2020, at the start of the COVID pandemic, December 2021 cotton futures closed at a contract low of 54.37 cents, but since that point the contract price has increased nearly 95% as of October 1, 2021.
A big driver in U.S. prices has been robust demand. Current USDA estimates for the 2020/21 marketing year have the U.S. exporting 16.37 million bales (Figure 1). As the estimate stands now, this would be the highest level of exports since 2005. China was the largest purchaser of U.S. upland cotton in the 2020/21 marketing year at 4.839 million bales, followed by Vietnam, Pakistan, and Turkey. Upland cotton sales to China were up 97% compared to the previous year. USDA export projections for the 2021/22 marketing year are currently at 15.5 million bales. Chinese demand will be a key factor going forward as questions persist about whether China can maintain current purchasing levels and about how much Chinese purchasing is attributable to the Phase 1 trade deal. Supply chain issues also continue across the globe, and higher U.S. prices have the potential to dampen U.S. export demand.
Current estimates have the U.S. with 11.19 million planted acres of cotton in 2021, down 900,000 acres from the previous year. Though planted acres are down, production is projected to be 3.9 million bales higher than the previous year at 18.51 million bales. Higher production estimates are a combination of a better yield outlook and a lower abandonment rate. Cotton production in 2020 was hampered by drought conditions in Texas and hurricanes in the southeast. The U.S. is projected to harvest 9.92 million acres in 2021, which is 1.64 million more acres than 2020 with an average yield of 895 lbs/acre. Currently, USDA has 65 percent of the U.S. crop rated as good or excellent which is 22 percentage points higher than last year. Most of the U.S. crop remains a couple of weeks behind schedule, and weather remains the determining supply factor after a period of wet weather and milder temperatures across much of the cotton belt.
Bringing supply and demand together, U.S. ending stocks for the 2021/22 marketing year are projected at 3.7 million bales, which is a reasonably tight level. Looking ahead to the spring of 2022, the ratio of Dec’22 CBOT corn futures to Dec’22 ICE cotton futures can serve as an early projection for planted cotton acres. That ratio currently sits near 6.1, which is similar to last year. This suggests planted cotton acres of 11 or 12 million. The occurrence of dollar cotton, though, is exciting to producers and has the potential to push acreage higher. Assuming 12 million planted acres, a ten-year national average yield of 855 lbs/acre, a 15% abandonment rate, and keeping all else at 21/22 projections, this would suggest ending stocks at 3.87 million bales. This would be a minimal increase in ending stocks and suggests new crop futures prices trading around a comparable level to the current marketing year range.
Figure 1. U.S. Cotton Exports 2000-2019, 2020 estimate, and 2021 projection.
Source: USDA WASDE, September 2021
Recommended citation format: Maples, William E. “Cotton Outlook.” Southern Ag Today 1(43.1a). October 18, 2021. Permalink