International markets support U.S. agriculture, especially in the Southern states. Exports make up a significant portion of cash receipts for many major commodities produced in the Southern states (Figure 1). From 2010 to 2023, an average of 84% of cotton receipts came from exports, underscoring the crop’s reliance on global trade. Wheat and soybeans also depend heavily on international markets, with exports accounting for 64% and 55% of their respective receipts. In contrast, corn is less export-oriented, with just 19% of receipts linked to foreign buyers[1]. This level of exposure makes Southern agriculture especially sensitive to tariff changes and trade policy shifts. During periods of uncertainty, a well-informed marketing and risk management strategy is often the best defense producers have against market volatility.
A well-developed marketing and risk management plan is essential for producers facing today’s volatile markets. While trade uncertainty is a significant source of price swings, volatility is a constant in agriculture—driven by weather, input costs, and global events. Trade is one of the dominant factors right now. Regardless of the cause, producers should expect uncertainty and be ready to manage price risk each crop year. A strong marketing and risk management plan is the best tool for navigating uncertainty. Crucially, the plan should be written down and shared with everyone involved in the operation to ensure clear communication and timely decisions. Growing a crop and marketing a crop involve two completely different skill sets, so communication between those in charge of production and those in charge of marketing and risk management is essential.
The most significant value of a marketing plan is determining sales timing, which should coincide with when production risk is reduced, and what action should be taken at different price points. Trying to time price peaks in markets shaped by unpredictable trade shifts is often ineffective and can be risky. Instead, a solid marketing plan sets decision dates, creating structure around when and how much to sell if markets achieve price targets. Dates should be tied to when production risk is reduced and be informed by realistic price targets, helping producers stay disciplined and focused on financial goals while taking some of the emotion out of pricing decisions. The key is to make sales when prices meet or exceed profit objectives at strategic points in the production/marketing year—even if prices might rise later. Especially in tight-margin years, locking in profits when available can be critical to the operation’s financial success.
Producers may benefit from a more proactive sales strategy in today’s challenging market environment when profit opportunities arise. For instance, a summer weather rally that pushes prices higher could present a good time to forward contract or price additional bushels before harvest. While aggressiveness in pre-harvest marketing will vary depending on each producer’s risk tolerance, defining that comfort level in advance is essential. The best marketing decisions are those made with forethought—not in the heat of the moment. In years with tight margins, relying on chance is a risk most operations can’t afford.
Figure 1. Export Contribution to Southern Ag Receipts, Observed and Average Share by Commodity, 2010-2023
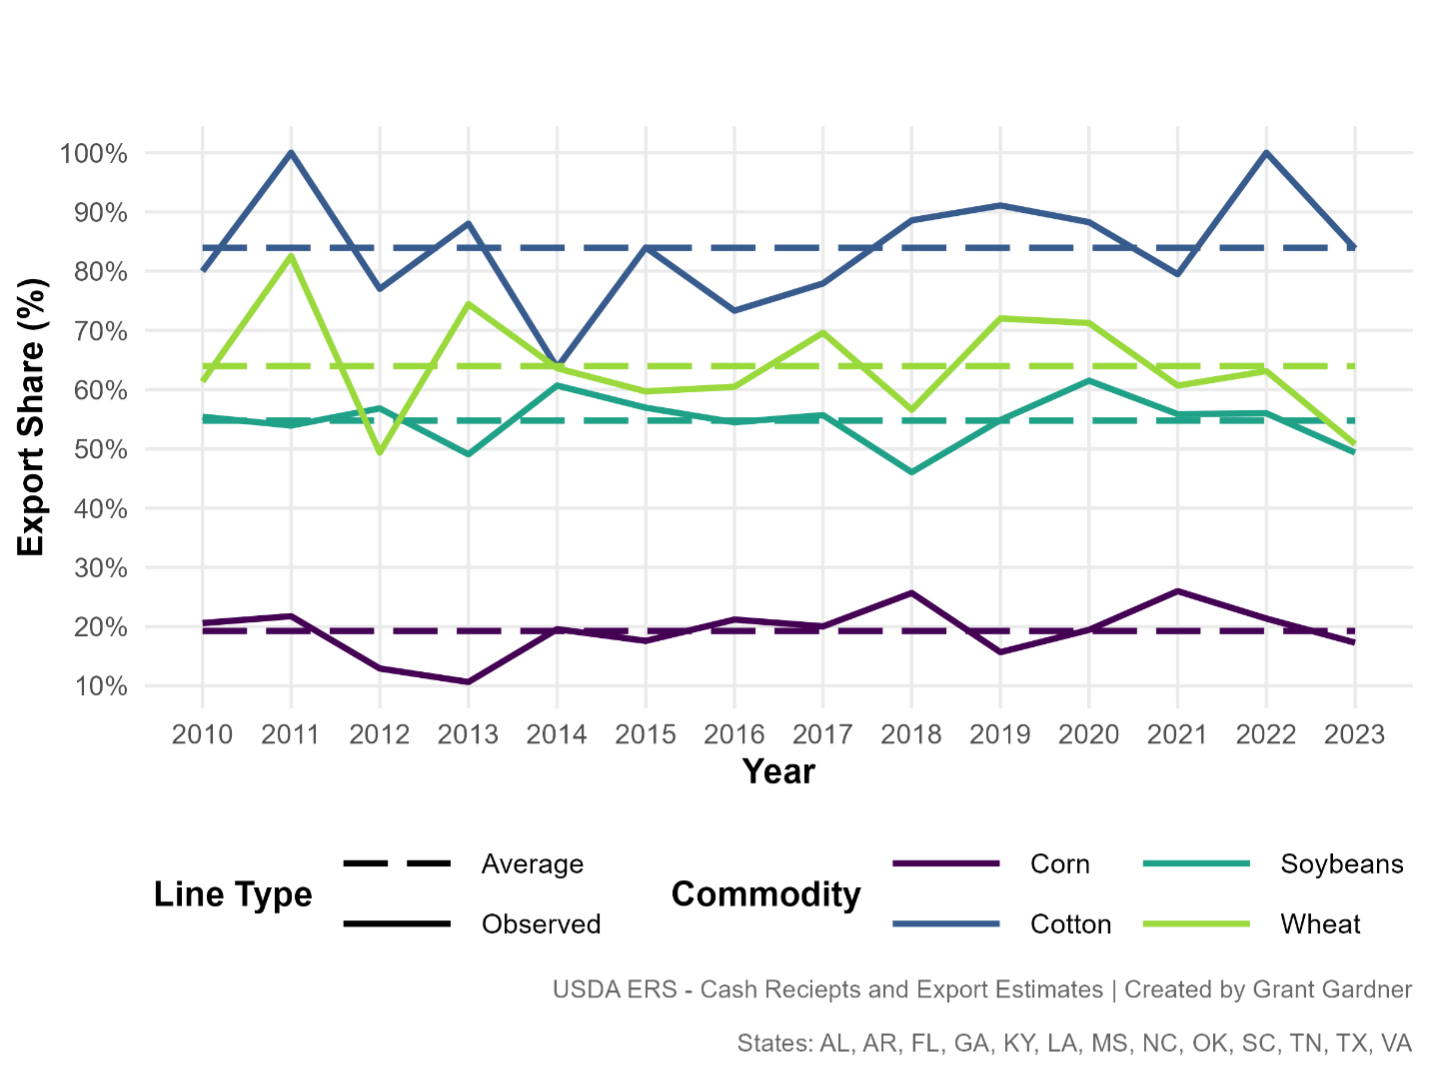
[1] Estimates do not include by products for crops such as ethanol, dried distiller grains (DDGs), soybean oil, and soybean meal.
Maples, William E., and Grant Gardner. “Managing Crop Markets When Trade Disrupts Prices.” Southern Ag Today 5(19.3). May 7, 2025. Permalink