Blog

  • Beekeeping Operations and Revenue Sources in Alabama 

    Beekeeping Operations and Revenue Sources in Alabama 

    Beekeepers provide valuable services to the population and agricultural community in Southern states. Many beekeepers produce honey, which they sell to retailers or directly to consumers. In addition, many specialty crops grown in the South rely on pollinators – both wild pollinators and those managed by beekeepers – to produce fruit and seeds. Blueberries and watermelon in particular are entirely dependent on insect pollinators, and other crops such as avocados, oranges, strawberries, and tomatoes are moderately dependent on insect pollinators (Mallinger et al. 2021). Reflecting this dependence, the largest number of acres that farmers pay to have pollinated in many Southern states is blueberries, followed by watermelon (USDA 2023).

    Given the importance of beekeepers to Southern consumers and to farmers, we conducted an electronic survey of 150 Alabama beekeepers. Our response represented about 12% of the registered beekeepers in Alabama. Alabama has fewer honeybee colonies and lower honey production than Florida or Georgia, but comparable to South Carolina (USDA 2024). Despite the lower total production, Alabama honey yield per colony is higher than other Southern states except for South Carolina (USDA 2024). Alabama also had the highest honey price per pound of all the states in the Southern region in 2023 (USDA 2024). 

    Figure 1 describes the operation size and revenue sources for the surveyed beekeepers. Almost all of the beekeepers sold honey (80%), and many beekeepers sold bees to other beekeepers (42.6%). Very few beekeepers provided pollination services (12%). The most immediate potential for revenue growth among beekeepers thus consists of improving the marketing potential of honey. For farmers in specific regions, it may also be difficult to find a beekeeper that provides pollination services. 

    The majority of our sample (62%) were “hobbyist” beekeepers with small numbers of hives, and only 6% of our sample were large commercial beekeepers. Farmers looking for pollination services would thus need to find the few beekeepers who have enough capacity to pollinate the required number of acres. Alternatively, farmers may wish to contract with many different hobbyist beekeepers either individually or through a cooperative of hobbyist beekeepers. 

    Of the sampled beekeepers who did provide pollination services, 72.2% only offered them within Alabama, while 27.8% offered them both within Alabama and in other states (Florida, Georgia, and California). Reflecting the fact that most of the beekeepers were hobbyists, when asked about barriers to providing pollination services, those that did not offer these services cited a lack of time, resources, and the fact that their operations were too small. Respondents also cited barriers to expanding honey production, which also included a lack of time, as well as difficulty identifying new markets and competing with mass-produced honey that may be mixed with non-honey sweeteners. 

    Given the presence of hobbyist beekeepers in Alabama, facilitating coordination between smaller beekeepers will be essential to improving beekeeper revenue from honey as well as providing pollination services. Beekeepers associations may help connect farmers with beekeepers with the capacity to provide pollination services. Hobbyist beekeepers may also find it beneficial to organize into cooperatives that either provide pollination services or coordinate marketing efforts of local honey. Such cooperatives may have the collective capacity that an individual beekeeper lacks to identify new honey markets or provide consumer education on honey. At the extreme, a state- or region-specific honey marketing board may further improve marketing coordination between large numbers of smaller beekeepers. 

    Figure 1: Characteristics of a sample of 150 Alabama beekeepers

    Source: Survey of 150 Alabama beekeepers conducted in 2024 by the authors

    Sources:

    Mallinger, Rachel E., John J. Ternest, Sarah A. Weaver, James Weaver, and Samantha Pryer. 2021. Importance of insect pollinators for Florida agriculture: A systematic review of the literature. Florida Entomologist 104(3): 222-229. 

    United States Department of Agriculture, National Agricultural Statistics Service. Cost of Pollination, December 15, 2023. 

    United States Department of Agriculture, National Agricultural Statistics Service. Southern Region News Release Honey, March 15, 2024. 


    Scarbrough, Lawson, and Joel Cuffey. “Beekeeping Operations and Revenue Sources in Alabama.Southern Ag Today 4(38.5). September 20, 2024. Permalink

  • USDA Projects a Widening Trade Deficit for Fiscal Year 2025

    USDA Projects a Widening Trade Deficit for Fiscal Year 2025

    In previous Southern Ag Today articles, we reported on the rising U.S. agricultural trade deficit as forecasted by the U.S. Department of Agriculture (USDA). Last month (August), the USDA released new forecasts for the fiscal year (FY) 2025, indicating an even larger deficit than FY 2024. According to the USDA, the U.S. will conclude this fiscal year with agricultural exports at $173.5 billion and imports at $204.0 billion, resulting in a negative trade balance of $30.5 billion. For FY 2025, the USDA forecasts agricultural exports at $169.5 billion and imports at $212.0 billion. If these projections hold true, the continued decrease in exports and increase in imports will cause the U.S. agricultural trade deficit to rise to a record $42.5 billion (Kenner et al., 2024). As mentioned in previous articles, this is not necessarily a concern because we import high-value agricultural and food products that are very different from the bulk commodities that dominate U.S. exports. For instance, U.S. imports of beer, wine, and spirits accounted for more than half of this deficit in recent years (Muhammad and Hossen, 2024b). That said, the continued decline in U.S. agricultural exports should be a concern.

    The differences between the latest FY 2024 and FY 2025 forecasts are reported in Table 1. Soybeans account for the largest expected decline at $1.5 billion, a decrease of over 6%. Beef and veal exports are expected to be lower by $1 billion, nearly an 11% decline. Other noted declines include cotton (-$900 million, -17%), soybean meal (-$700 million, -10%), and sorghum (-$400 million, -27%). While there are projected declines for several major commodities, some sectors are projected to increase, albeit the projected increases are smaller by comparison.

    The shift from historical trade surpluses presents both challenges and opportunities for U.S. agricultural policy, with an increased urgency to address declining export sales. To mitigate the impact of declining exports, particularly to China, U.S. policymakers must focus on diversifying export markets. Exports to China have declined by 30.9% between 2021 and 2023 (Muhammad and Hossen, 2024a), and they are projected to fall further to $24.0 billion in FY 2025 from $27.0 billion in FY 2024. There is an urgent need to seek new markets in regions such as Southeast Asia, Africa, and Latin America. Negotiating new trade agreements with these emerging markets could open opportunities for U.S. agricultural products. Additionally, providing export promotion assistance and investing in market research will be essential in identifying and capitalizing on opportunities in untapped markets.

    Table 1. Difference in USDA exports forecasts: FY 2024 versus FY 2025

    Note: Change = FY2025 forecast – FY2024 forecast.
    Data Source: Kenner, Bart, Hui Jiang, James Kaufman, and Angelica Williams. (2024). Outlook for U.S. Agricultural Trade: August 2024. Report AES-129. U.S. Department of Agriculture. https://www.ers.usda.gov/publications/pub-details/?pubid=109831

    For more information:

    Kenner, Bart, Hui Jiang, James Kaufman, and Angelica Williams. (2024). Outlook for U.S. Agricultural Trade: August 2024. Report AES-129. U.S. Department of Agriculture. https://www.ers.usda.gov/publications/pub-details/?pubid=109831

    Muhammad, Andrew, and Md Deluair Hossen. (2024a). “Understanding the Growing U.S. Agricultural Trade Deficit: The Fall in Exports.” Southern Ag Today 4(26.4). June 27.

    Muhammad, Andrew, and Md Deluair Hossen. (2024b). “Understanding the Growing U.S. Agricultural Trade Deficit (Part 2): What’s Happening with Imports?” Southern Ag Today 4(30.4). July 25.


    Hossen, Md Deluair, and Andrew Muhammad. “USDA Projects a Widening Trade Deficit for Fiscal Year 2025.Southern Ag Today 4(38.4). September 19, 2024. Permalink

  • Minimal Price Gains Amid Record Yields: A Tough Outlook for Grain Producers in 2024

    Minimal Price Gains Amid Record Yields: A Tough Outlook for Grain Producers in 2024

    The September World Agricultural Supply and Demand Estimates (WASDE) report indicates modest changes in supply and demand for corn and soybeans. The World Agricultural Outlook Board (WAOB) increased their estimated corn yield by 0.5 bushels per acre, offset by a decrease in carryover from the 2023 marketing year. Soybean demand also saw a slight increase of 2 million bushels. Both cotton and rice yields were cut; however, the lower yield expectations were offset by lower demand, resulting in no change to the projected season-average price.

    The remainder of this article focuses on corn and soybeans, which exceed trend yields by 2.6 and 1.2 bushels and represent a national high. Record yield expectations are driving stocks-to-use ratios (a key indicator of surplus) to levels much higher than in recent years. Consequently, the USDA has projected the marketing year average price for corn to be around $4.10 per bushel, while soybeans are expected to average $10.80 per bushel.

    Currently, domestic consumption and exports of corn and soybeans appear to be stable. Crush (processing) and ethanol production are at or near record highs, while export demand is lower, but somewhat steady. Without a significant change in the yield estimate due to drought or overestimation, it is hard to envision a sharp price rise for the 2024/25 marketing year.

    Figure 1 graphs stocks-to-use ratios and CPI- (inflation) adjusted season average prices for corn and soybeans with the September WASDE Estimates and associated trendlines (green and yellow with gray confidence intervals). CPI-adjusted corn prices are at their lowest level since at least 2011, and soybeans are nearing the lows seen in 2019. As a result, 2024 may be one of the toughest years for grain producers in the past decade, given the absence of a major event that could drive substantial price increases.

    Figure 1: CPI Adjusted Price and Stocks to Use Ratio for Corn and Soybeans

    Sources:

    U.S. Department of Agriculture, World Agricultural Outlook Board. (2024, September 13). World Agricultural Supply and Demand Estimates (WASDE). https://www.usda.gov/oce/commodity/wasde


    Gardner, Grant. “Minimal Price Gains Amid Record Yields: A Tough Outlook for Grain Producers in 2024.” Southern Ag Today 4(38.3). September 18, 2024. Permalink

  • Summer Slide

    Summer Slide

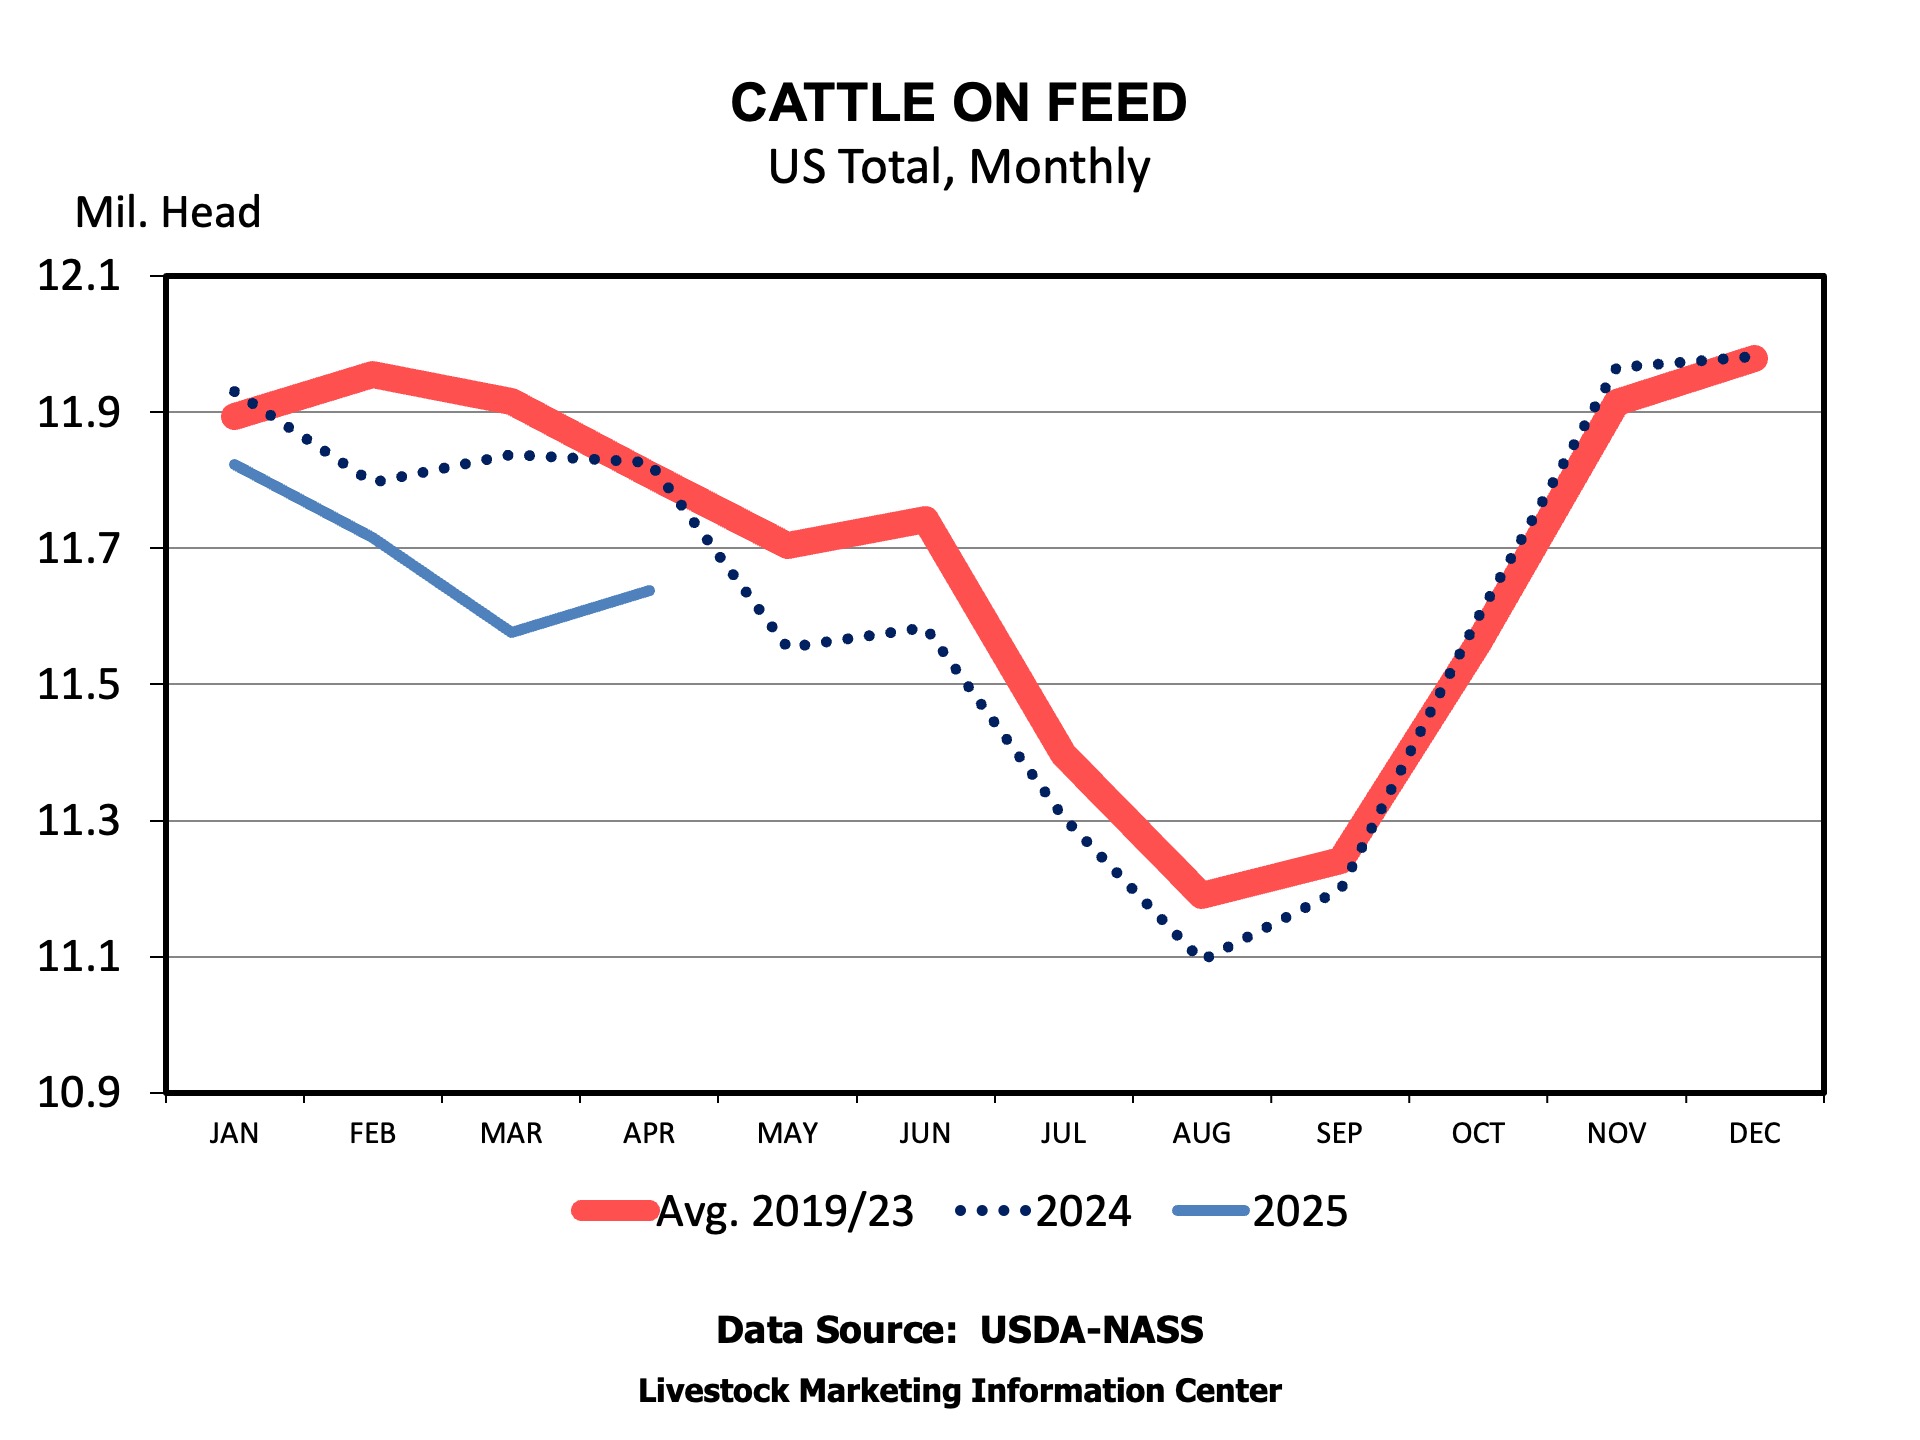
    Cattle and calf prices have been sliding lower for more than a month.  For the most part, prices remain higher than last year at this time, even though they are declining.  In the middle of this slide comes the next cattle on feed report which will indicate fed cattle supplies for the next few months.  

    The next cattle on feed report will be released on Friday, September 20th.  Most market analysts’ forecasts are published by now and, generally, indicate that they expect marketings and placements to be below last year.  Feedlot marketings should be down about 3.5 percent lower than last year.  While below last year, one less workday during August means that daily average marketings were slightly higher than last year. 

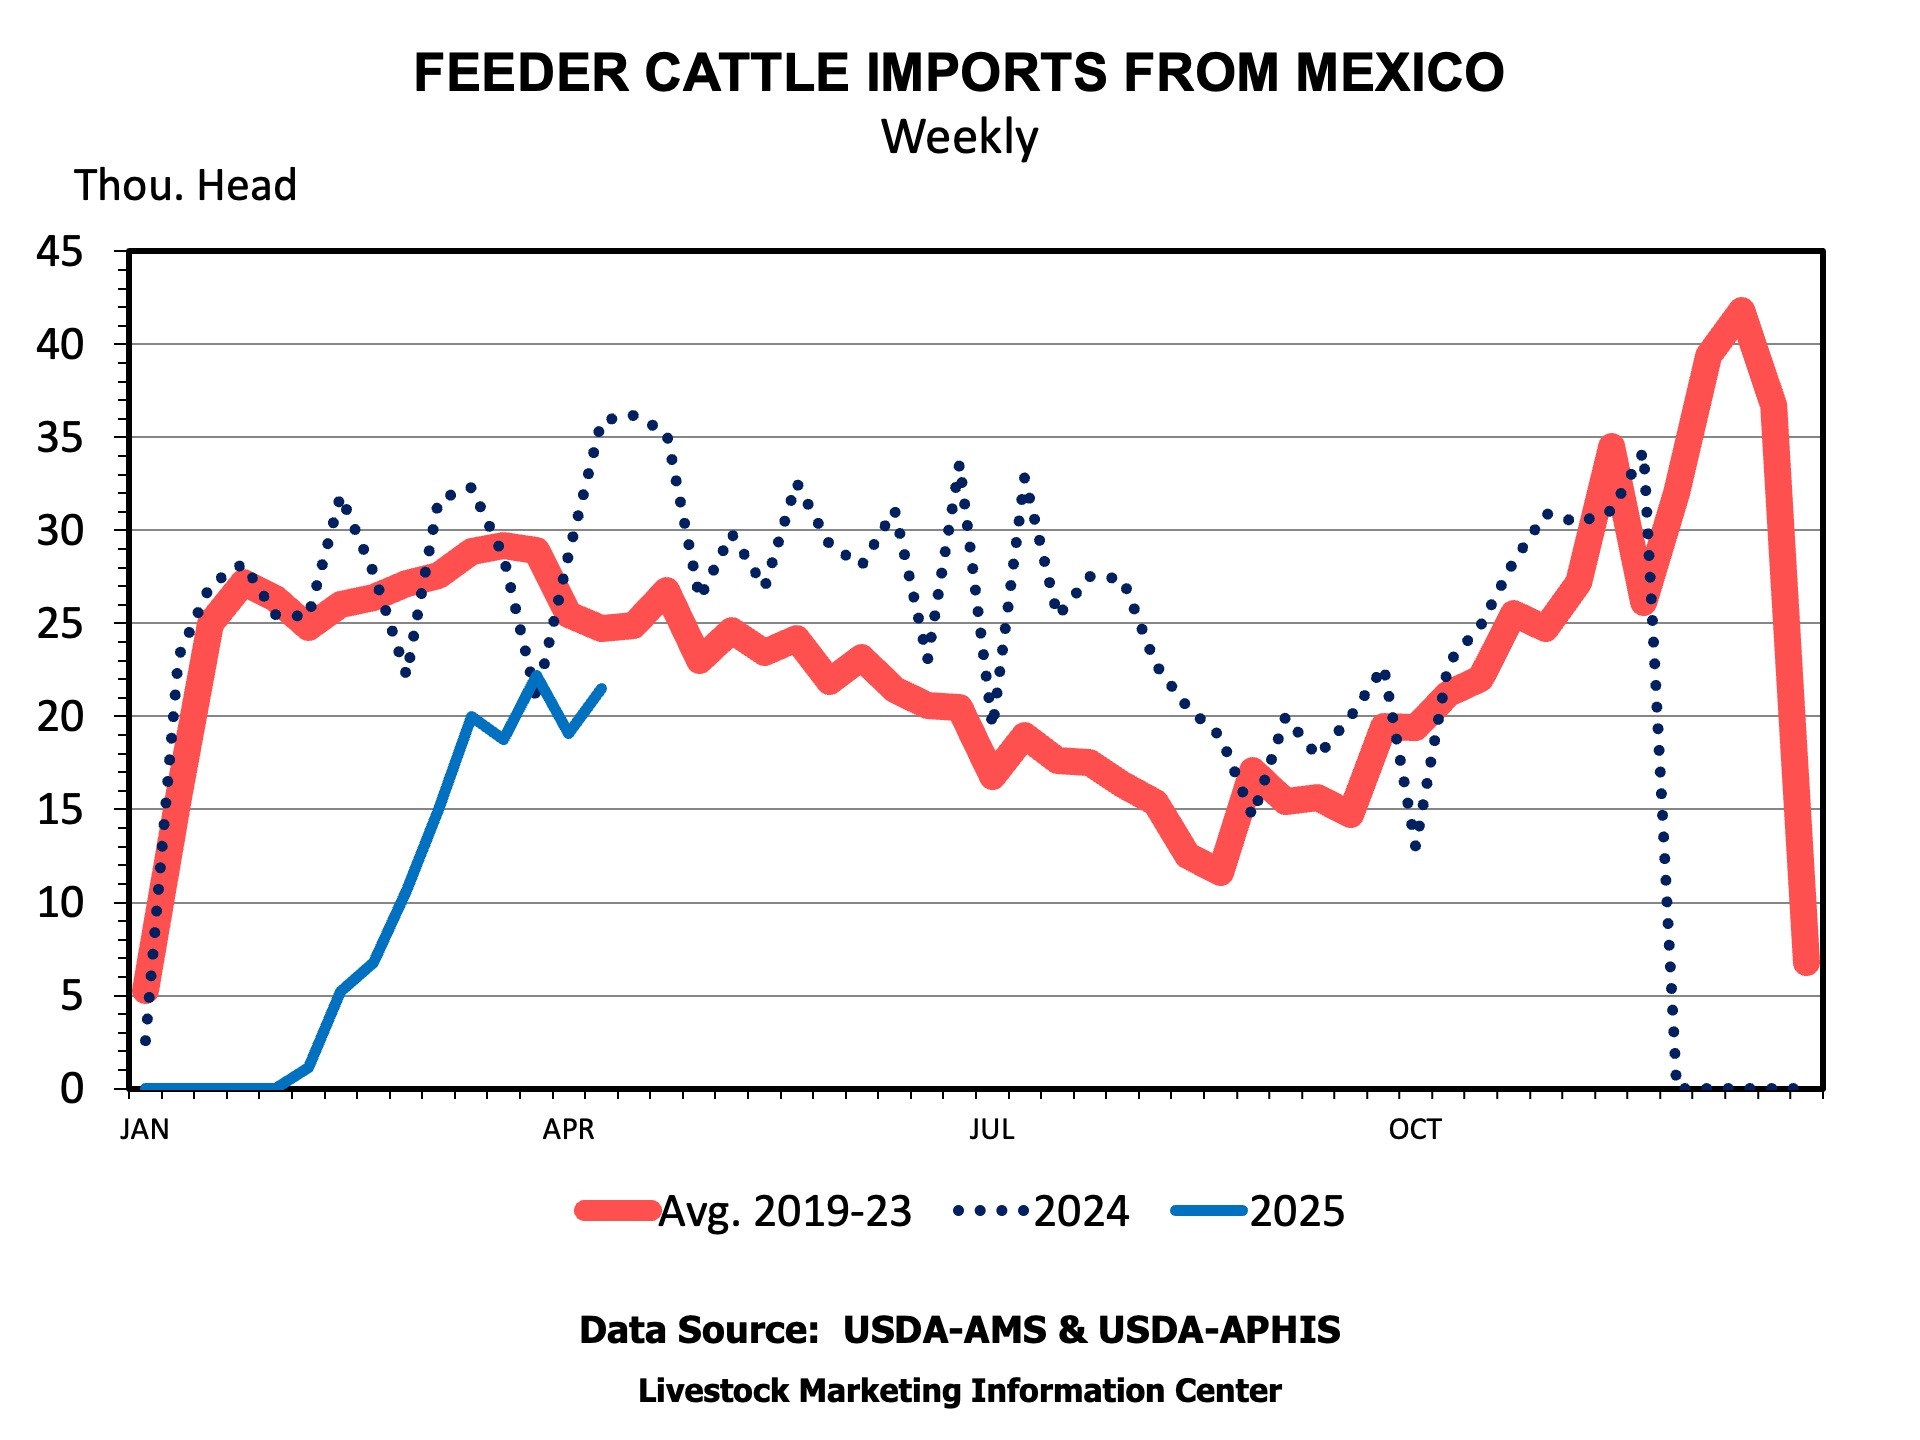
    There is a fairly wide range of market analysts’ estimate of placements, from down 4 percent to up 2 percent.  Seasonally, August placements tend to be large as calves born in the Spring and yearlings coming off summer grazing programs start to be placed.  September and October tend to be the months with the most feedlot placements.  Fewer feeder cattle were sold this August than last year according to available data on feeder cattle sales and feeder cattle reported on the CME feeder cattle index.  But, about 29,000 more feeder cattle were imported from Mexico during August.  August placements also occurred against a backdrop of falling fed cattle futures prices.  Even though corn prices continued to decline lower fed prices forced lower feeder cattle prices throughout the month.

    Typically, more feeder cattle are placed than fed cattle marketed in August.  That is likely the case again this year, which leaves the number of cattle on feed up about 0.3 percent on September 1.  So, compared to last year supplies of cattle in feedlots implying fed beef production should remain close to last year’s level for most of the rest of the year.  

    The report should support the continued trend of more beef production from fed cattle than a year ago.  Both fed steer and heifer weights are headed higher, seasonally, and are at record highs for this time of the year. The percent of beef grading Choice is higher than a year ago indicating that there are larger supplies of Choice beef on the market compared to last year.  From a beef supply perspective, it should not be surprising to see the Choice beef cutout and cattle prices struggling to gain ground compared to last year.

    Watch for placements and the total number of cattle on feed in the report on Friday, September 20th.  Those will provide some good information on beef supplies for the rest of the year.  Placements should be larger in September and October as Fall runs of calves start across the South and the rest of the country.


    Anderson, David. “Summer Slide.Southern Ag Today 4(38.2). September 17, 2024. Permalink

  • Empowering the Next Generation: The Perks of Paying Your Farm Kids

    Empowering the Next Generation: The Perks of Paying Your Farm Kids

    Even in the year 2024, farming tends to be a family affair. The late nights and subsequent long hours can mean the most promising way to spend family time is by spending it together in the field or on the ranch. Predictably, the kids of generational farm parents can morph quickly into farm hands – driving grain carts, loading hay, working cattle, and, in general, proving themselves to be reliable help.

    Farm families and family labor are multi-layered. The roles of manager and parent, employee and child begin to overlap, blend, and mesh over time. The slow, steady drip of ever-increasing labor from the kid often means there’s never a set hire date. Then, suddenly, your brand-new teenager has put in a 40-hour week on her summer break, completely unpaid. The farmer parent may make the valid point that they allow their child to work “for free” on the farm under the guise of building character or as an exchange for a future allowance like a car or college. While I’m never one to argue with character building, this route is not the best approach from a financial and tax perspective. 

    If your farm kid was hard at work in the wheat field or hay field this summer break, consider putting them on the payroll. In 2024, the standard deduction is $14,600. This means one could earn up to $14,600 and not owe any federal tax. Further, if a parent pays their child through a sole proprietorship, and the child is also under the age of 18, the child is also exempt from Social Security and Medicare taxes. The child can also be exempt from Social Security and Medicare taxes when working for a partnership as long as both partners are the child’s parents. 

    The wage paid to an employee who happens to be your child is a fully deductible expense to the payer, and if the amount falls under the threshold mentioned above, the child will not be subject to federal tax. In some instances, state and local taxes may apply, but those amounts are often nominal. This scenario is a win-win for the child and for the parents. 

    There are considerations to be made when adding your children to the payroll. 

    • The wage and the work must be reasonable. One can’t suddenly decide their child is worth $100 per stacked straw bale or $14,000 for a day’s worth of work. 
    • There’s paperwork. It’s important to treat your child like a proper employee. Keep and maintain payroll records and be sure to file the necessary forms throughout the year and at year-end, including issuing them a W2. 
    • Tax allowances are not labor and safety laws. Ensure you are following all laws in regard to children in agricultural settings. 
    • Every farming situation is unique. It’s best to speak with your local tax preparer to discuss your situation and ensure you follow the rules.

    If you want to further set your children up for success, consider helping them invest their wages into a tax-free savings vehicle. A college investment account or a retirement account for those not college bound are a great option. Investing those wages while mom and dad are footing the bill for living expenses will really help to secure a person’s future.

    Paying your kids to work on the family farm is a great way to instill the value of hard work, perseverance, and determination. Done the right way, adding your child to the payroll can be a beneficial situation for all parties involved.