Blog

  • Land Ownership and the Preservation of Family Farm Legacies 

    Land Ownership and the Preservation of Family Farm Legacies 

    The preservation of land for future generations and the creation of family legacies is an important part of the U.S. agricultural heritage.  Unfortunately, many families are left vulnerable to losing their land or face complicated management decisions.  This occurs because the land is passed down from one generation to the next without an appropriate transition plan or without a properly probated will.  

    Two recent Southern Ag Today articles (referenced below) focused on estate and transition planning, both illustrating the importance of the process of organizing and arranging the transfer of one’s assets, including real estate, to heirs in a structured and legally recognized manner. It typically involves creating a will or trust, designating beneficiaries, and addressing issues like taxes and debts. It is a crucial aspect of risk management that can keep land in the family.  Land ownership where property is passed down without clear legal documentation and is shared among all the heirs is known as heirs property.  

    Heirs property can limit land management and complicate access to some federal programs. Each heir has an equal right to full use and possession and is legally responsible for taxes and other property-related expenses and activities.  As land is passed down to future generations, and the number of heirs increases, it becomes more fractionated with each person’s percentage interest in the land decreasing.  Furthermore, heirs property becomes vulnerable to loss through issues such as partition sales, tax sales, or adverse possession.  Maintenance of the land and the ability to manage the use of the lands resources is also limited and can result in conflict and disputes amongst the heirs.  

    While heirs property is a significant issue, there are means to resolution and preventing the future creation of heirs property.  This starts with a will or appropriate estate or transition plan.  According to a Gallup Poll in 2020, only 46% of U.S. adults have a will.  Almost a quarter of adults 65 years and older are also without a will.  While we do not have these data for agricultural producers, the USDA Census of Agriculture does report the number of producers who are engaged in some form of estate and transition planning.  Table 1 reports the percentage of producers in the 13-state southern region that reported being engaged in estate or transition planning in the 2017 and 2022 Census of Agriculture.  In 2017, this percentage ranged from a low of 49% in Louisiana to a high of 62% in Oklahoma.  These numbers fell in 2022 in all states, with Louisiana remaining the smallest percentage at 44% and Oklahoma, while still the highest, dropped to 56%.  This illustrates the significant gap that exists in agricultural estate planning, leading to increased risk of creating heirs property for future generations. 

     There are various reasons why individuals do not engage in proper estate planning.  Sometimes they feel they do not have enough assets, the process is too expensive, or the process is too complicated.  Another reason is that some people are simply holding off because the conversation is uncomfortable and morbid. However, the best prevention for heirs property is education, choosing the right attorney, and formalizing a transition plan. A well-crafted estate plan can prevent a property from becoming heirs property by ensuring that a clear title is passed down to future generations.  More information on the resolution and prevention of heirs property can be found in the Heirs Property in Alabama publication. 

    Table 1: Percentage of Agricultural Producers Engaged in Estate or Transition Planning 

    State20172022Percentage 
    Change
    OK62%56%-6%
    AR57%53%-4%
    TX58%53%-5%
    VA56%53%-3%
    AL56%52%-4%
    GA55%52%-3%
    MS55%51%-4%
    SC56%51%-4%
    TN55%51%-4%
    KY55%50%-5%
    NC54%50%-4%
    FL51%48%-3%
    LA49%44%-5%
    Source: Author Calculations based on 2022 USDA Census of Agriculture 

    References:

    Gallup. “How Many Americans Have a Will?” The Short Answer. June 23, 2021.

    Graff, Natalie. “Government Incentives for Agricultural Generational Transfer?” Southern Ag Today 4(25.4). June 20, 2024.

    Johnson, Portia, Ryan Thomson, Adam Rabinowitz, and Katie Keown. “Heirs Property in Alabama.” Alabama Cooperative Extension System HE-0852. Revised July 2024.

    Martinez, Charley, and Kevin Ferguson. “Estate Transition Planning.” Southern Ag Today 4(27.3). July 3, 2024.


    Rabinowitz, Adam, Justin Anderson, and Jamie Mardis. “Land Ownership and the Preservation of Family Farm Legacies.Southern Ag Today 4(35.5). August 30, 2024. Permalink

  • Timeline of the ARC and PLC Programs: Why Are Payments Received a Year Later?

    Timeline of the ARC and PLC Programs: Why Are Payments Received a Year Later?

    The Agriculture Risk Coverage (ARC) and Price Loss Coverage (PLC) programs are vital components of the farm safety net for many producers, helping them manage the considerable risks they face. Eligible commodities for these programs include wheat, corn, sorghum, barley, oats, seed cotton, long- and medium-grain rice, certain pulses, soybeans/other oilseeds, and peanuts. Given the importance of these programs, we are often asked why the payments are made so late, generally well over a year after harvest. This article illustrates the timeline for the ARC and PLC programs, explains the reasons behind the one-year delay in payments, and examines the impact on current farm bill discussions.

    Typically, prior to planting a crop, producers must make a decision (i.e., an election) between ARC and PLC on a crop-by-crop and farm-by-farm basis. They generally have until March 15 to notify USDA’s Farm Service Agency (FSA) of their election decision and to enroll in an annual ARC/PLC contract for the covered commodities for which they have base acres. Because ARC and PLC are decoupled from production, a producer’s individual production, harvesting, and marketing decisions have no bearing on ARC and PLC payments. In fact, the marketing year is standardized and does not depend on when a farmer harvests their crops on individual farms. Instead, it is based on a fixed start date specific to each commodity, which generally aligns with the typical harvest period for that crop and lasts for 12 months from this standardized start date. For example, the marketing year for cotton and peanuts starts on August 1st and lasts until the following July 31st. The national average price over this “marketing year” is then used to calculate any required ARC or PLC payments. Farmers can then expect the processing of ARC and PLC payments to occur after October 1 following the end of the marketing year, in accordance with the farm bill. 

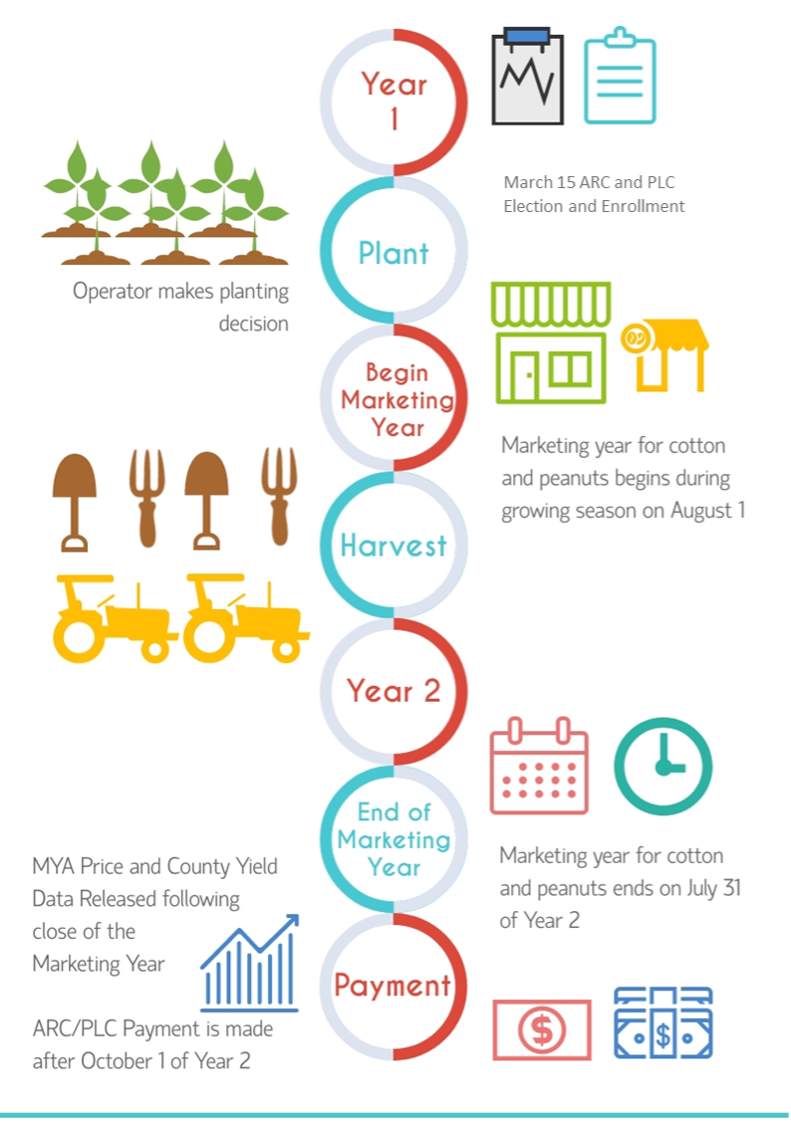
    Figure 1 illustrates the timeline of the ARC and PLC programs using cotton and peanuts as examples. For the 2024 crop year, producers signed up for ARC/PLC and planted the crop this past spring. The marketing year started on August 1, 2024. Some producers (e.g., South Texas) have already harvested, and the remainder will be harvested this fall. The marketing year will continue into next year, concluding on July 31, 2025. USDA will then calculate marketing year average prices and county yields, and they will make any ARC/PLC payments after October 1, 2025. In other words, more than 18 months will have transpired between the time a producer enrolled in ARC/PLC and the time when assistance was eventually paid.

    Interestingly, it hasn’t always been this way. Using the Counter-Cyclical Payments (CCP) program – the predecessor to PLC – from the 2002 Farm Bill as an illustration: the 2002 Farm Bill required USDA to make payments “as soon as practicable after the end of the 12-month marketing year for the covered commodity.” To help lessen the impact of the lagged payment timing, if the Secretary estimated that a CCP payment would be required, the 2002 Farm Bill required the Secretary to “give producers on a farm the option to receive partial payments of the [CCP] projected to be made for that crop of the covered commodity.” This all changed in the 2008 Farm Bill. The 2008 Farm Bill required any CCP payments to be made “beginning October 1, or as soon as practicable thereafter, after the end of the marketing year for the covered commodity.” In other words, payments were further delayed – until after October 1 following the end of the marketing year – and no partial/advance payments were allowed. The payment timing introduced in the 2008 Farm Bill was maintained with the creation of ARC and PLC in the 2014 Farm Bill, and it is still in place today. This all naturally leads to the question: why? 

    First, both ARC and PLC use the marketing year average price to determine if assistance is warranted. That necessarily means waiting until the end of the marketing year before final ARC and PLC payments can be made. While some attempts have been made to reduce the wait time – such as utilizing prices based on the first few months of the marketing year – those haven’t taken hold. Regardless, that doesn’t explain the further delay introduced in 2008. When the drafters of the 2008 Farm Bill delayed payments until after October 1, they effectively pushed payments into a subsequent fiscal year, as the federal fiscal year starts on October 1 each year. In so doing, this “timing shift” resulted in one less year of assistance that had to be funded by the 2008 Farm Bill, freeing up those resources to be used on other priorities. The problem: reversing this would result in another fiscal year of ARC/PLC assistance having to be provided by the existing farm bill budget. While complicated, it is simply a matter of policymakers deciding if it is better to use scarce resources to (1) accelerate the timing of payments or (2) make programmatic improvements like increasing reference prices. Over the last two farm bill cycles, policymakers have opted for leaving the timing alone and making programmatic improvements instead.

    The more acute concern is this: even if Congress passes a new farm bill this fall (in time for the 2025 crop year), under current ARC and PLC payment timelines, producers will not see any assistance until after October 1, 2026 (the first month of fiscal year 2027). Given growing concerns about the state of the farm economy, even with a new farm bill in place, there undoubtedly will be tremendous pressure on Congress to provide ad hoc assistance for the 2024 crop year this fall, as was highlighted in a recent Southern Ag Today article, to help fill in the gap.

    Figure 1. Two-Year Timeline for Key Dates of ARC and PLC Payments Using Cotton and Peanuts as an Example


    Li, Yangxuan, Bart L. Fischer, and John Lai. “Timeline of the ARC and PLC Programs: Why Are Payments Received a Year Later?Southern Ag Today 4(35.4). August 29, 2024. Permalink


  • Are the Pre-Season Polls (Crop Production Reports) Accurate?

    Are the Pre-Season Polls (Crop Production Reports) Accurate?

    USDA NASS has released the equivalent of college football’s pre-season poll, which is the August Crop Production report (released August 12). The Crop Production report provides an estimate of acreage, area harvested, yields, and production for the major row crops in the U.S.  Additional crop production reports (polls) will be released in September, October, and November. The Annual Crop Production report (final poll) will be released in January.

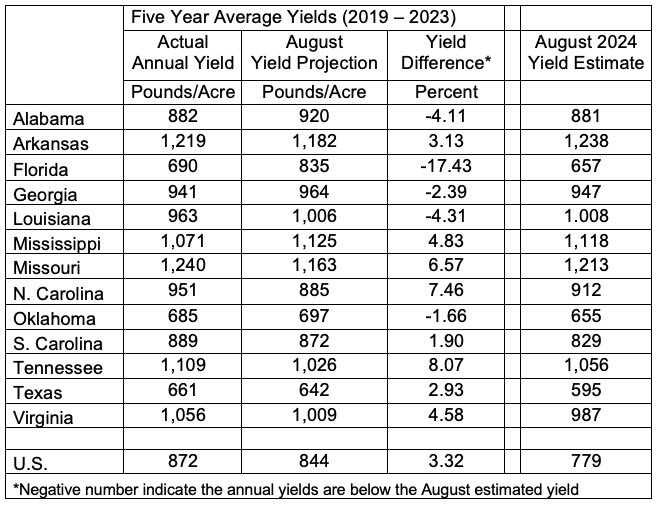
    For the states represented in the Southern Ag Today area, estimates for cotton yields garner a lot of attention.  How accurate are these August estimates to actual yields? Table 1 shows the actual five-year average (2019 – 2023) annual cotton yield compared to the five-year average of the August yield projection. 

    Table 1.  Annual Cotton yield vs. August estimates yields (5-year averages)

    There is a range in the percent difference in the actual yields versus the August estimates. The actual five-year average ranges from 17.43 percent below the five-year estimated August yield (Florida) to just over 8 percent higher than the August estimate (Tennessee).

    Like pre-season polls, the estimated yields can vary from the actual annual yield for numerous reasons.  Wind and excess rain from tropical weather events cause the largest decline in yields from the August estimate to the actual yields. While we won’t know for several months what our actual yields are (or our favorite team’s record), the pre-season projections provide some insight.

    Reference: USDA NASS Crop Production

    https://downloads.usda.library.cornell.edu/usda-esmis/files/tm70mv177/4b29cz98b/9593wm26b/crop0824.pdf


    Runge, Max. “Are the Pre-Season Polls (Crop Production Reports) Accurate?Southern Ag Today 4(35.3). August 28, 2024. Permalink

  • U.S. Beef Imports: A Quick Look at Recent Trends

    U.S. Beef Imports: A Quick Look at Recent Trends

    Cattle prices have reached record highs, and the cattle herd is the smallest since the 1950s. USDA predicts high domestic prices will result in increasing imports in the coming years. The U.S. is an attractive market, particularly for lean beef trimmings for ground beef. This article briefly discusses the recent spike in live animals, fresh/chilled, and frozen meat imports.  

    During the first half of 2024, imports of beef and live cattle soared. From January to June 2024, the U.S. imported 175,441 more head of cattle than in the same period last year, a 19% increase, reaching 1.12 million animals (Fig. 1). Over the same span, imported Fresh/Chilled and Frozen beef rose 11% and 29%, totaling 331,550 and 365,067 metric tons (MT), respectively (Fig. 1). Tight lean supplies along with high domestic beef prices help explain the growth in foreign acquisitions. 

    As the U.S. cattle herd declines, live animal imports have increased, mostly from Mexico (Fig. 2). Drought in Mexico and high U.S. cattle prices helped fueled more U.S. feeder cattle imports. In 2023, Mexican sales to the U.S. jumped 43%.  That is 375,879 more head of cattle than in 2022. The Mexican herd has been stable recently, with FAS-PSD/USDA forecasting 0.4% growth in 2024.

    Imported fresh or chilled beef has been growing over the past decade (Fig. 3). In 2023, the U.S. imported more than double the quantity it did in 2013 (Fig. 3). During this period, Canada provided, on average, half of the U.S. imported fresh/chilled meat while Mexico had, on average, 34% of market share. FAS-PSS/USDA predicts Canada stocks will drop 2% in 2024, down to 11.06 million head. 

    The amount of foreign frozen beef increased by 20% from 2022 to 2023, totaling 0.57 MMT last year (Fig. 3). In 2013, Australia and New Zealand each held 41% of the frozen imported beef market. However, their market shares declined to 28% and 29% over the last decade. A two-year drought (2019-20) affected Australia’s supply. Since 2020, shipments from Brazil expanded, reaching 90,303 MT in 2023, representing 16% of the market share. When China temporarily banned Brazilian beef imports in 2021, Brazil diverted its products to other countries, including the U.S. According to FAS-PSD/USDA, Brazil’s (-0.92%) and New Zealand’s (-1.66%) cattle herds are expected to decrease in 2024, while Australia’s stock is projected to increase by 4.93%.

    U.S. beef imports are likely to continue ahead of last year as fewer cows are culled, and lean beef supplies continue to shrink.  Drought in Mexico will be a major factor in feeder cattle imports in coming months.

    Figure 1. The U.S. Total Imported of Live Animals, Fresh/Chilled and Frozen Beef, Quantity: Jan – Jun 2023 vs. Jan – Jun 2024. 

    Source: FAS-USDA (2024).

    Figure 2. U.S. Live Cattle Imports from Canada and Mexico, 2013-2023. 

    Source: FAS-USDA (2024).
    Note: Total quantity imported of live cattle other than purebred or those imported (HS code: 1022940).

    Figure 3. The U.S. Total Imported Fresh/Chilled and Frozen Beef, Quantity: 2013-2023 

    Source: FAS-USDA (2024).

    References

    FAS-PSD/USDA (2024). PSD Reports. Livestock and Poultry. Retrieved from:   https://apps.fas.usda.gov/psdonline/app/index.html#/app/downloads

    FAS-USDA (2024). Standard Query. Retrieved from: https://apps.fas.usda.gov/gats/ExpressQuery1.aspx


    Calil, Yuri. “U.S. Beef Imports: A Quick Look at Recent Trends.” Southern Ag Today 4(35.2). August 27, 2024. Permalink

  • To Store or Not to Store?  Old Crop Exit Strategies 

    To Store or Not to Store?  Old Crop Exit Strategies 

    USDA’s June Grain Stocks report estimated 37% more corn and 44% more soybeans stored on-farm than last year (Maples, 2024). Many producers are still sitting on unpriced old crop corn trying to decide whether to sell or hold through harvest hoping for prices to improve. This article discusses three potential options for a farmer deciding what to do with old crop held in storage. The three options – using 100,000 bushels of corn and a current cash price of $4.00 – examined are:

    1. sell corn at the current market price;
    2. continue to store corn with operating loan utilization; or
    3. store corn with cash resources.

    Selling corn at the market price is the most straightforward option. Selling would result in collecting $400,000 that could be used in other areas of the operation – including paying down opertating debt or covering expenses – or it could be invested. Additionally, making sales would free up storage for the new crop and shift the focus to marketing the 2024 crop.

    If an operating loan with a 9% interest rate is being used, continuing to store corn until February would incurr interest expense of $21,000 ($400,000 × 9% × 7/12). Dividing by 100,000 bushels, the per-bushel interest expense would be $0.21 or $0.03 per bushel per month, meaning cash prices from now until February would need to increase to at least $4.21 for the farmer to be better off than selling at today’s prices. 

    If the farmer is using cash reserves, rather than an operating loan, to carry corn until February, forgone interest should be estimated. Current certificate of deposit (CD) rates for short term money are close to 4.5%. Utilizing $400,000 cash has a forgone return on investment interest of  $10,500 ($400,000 × 4.5% × 7/12) or $0.11/bu ($0.015 per bu per month). 

    When deciding to continue to store corn or sell, several factors need to be considered. Calculating the interest expense or forgone interest is one factor. There is uncertainty in price direction; however, based on current projections it is likely that both futures prices and basis will remain low as harvest proceeds. It is worth noting that this analysis only considers interest expenses. It does not include other other storage costs or risks, such as quality losses, grain handling, and capital recovery for storage infastructure. Additionally, prices may not increase by February, and all storage could result in a loss. 

    References

    Maples, William E. “Having a Way Out.” Southern Ag Today 4(30.1). July 22, 2024. Permalink

    Gardner, Grant. “Interest Rates and Grain Storage.” Southern Ag Today 3(26.1). June 26, 2023. Permalink


    Gardner, Grant. “To Store or Not to Store? Old Crop Exit Strategies.Southern Ag Today 4(35.1). August 26, 2024. Permalink