Blog

  • The Economic Toll of Animal Diseases on U.S. Soybean Exports

    The Economic Toll of Animal Diseases on U.S. Soybean Exports

    Recent years have seen several high-profile outbreaks of transboundary animal disease. On average, approximately 0.01% of the world’s cattle population, 0.05% of the world’s swine population, and 0.03% of the world’s poultry population die each year due to global animal disease outbreaks.

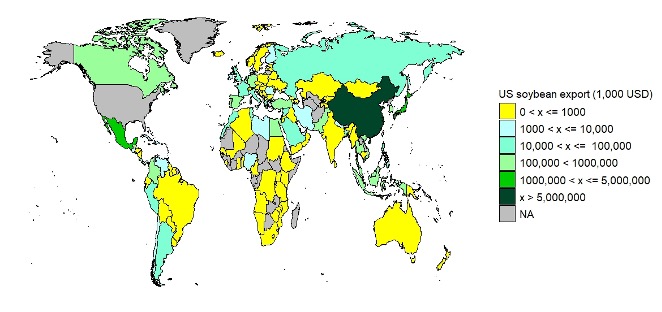
    These disruptions cause losses not only in the animal production industry but also in other related industries, such as the feed grain markets. One such upstream industry which is important for Southern U.S. agriculture is the international soybean market. Soybeans are the predominant source of protein in animal feed, and over 95% of global soybean meal production is destined for animal feeding (about 76% of total crush by weight) (Economic Research Service, 2024). Between 2005 to 2020, the U.S. was the second largest exporter of soybeans in the world behind Brazil. U.S. exports account for more than 30% of global soybean trade. The top five destination markets for U.S. soybeans have historically been China, Mexico, Japan, Indonesia, and Germany (Figure 1).

    Figure 1: U.S. Soybean Exports, by Destination Market

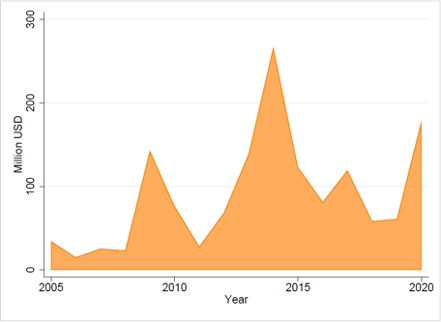
    In a recent study, we use a statistical model to examine the losses to global soybean trade due to animal disease (Lwin, Schaefer and Hagerman, 2024). A significant amount of animal deaths within a short period represents a demand-side shock in the feed market, where soymeal is a primary protein source. Our analysis suggests that—on average—more than $96 million in export potential is lost annually due to animal disease outbreaks (Figure 2).

    Figure 2: Annual losses in U.S. soybean export potential due to animal diseases 

    Source: Lwin, Schaefer and Hagerman, 2024

    These results should be of interest to policymakers. Historically, animal health policies have focused primarily on compensation to producers of affected livestock, which may include indemnity for animals that die or are depopulated for disease control. Few policies address the risk animal diseases pose to upstream suppliers. Crop insurance programs, if available, may protect grain producers against price declines. However, crop insurance is unlikely to address additional costs of storage or quality loss for grain that must be stored for longer periods of time. Policy efforts to enhance supply chain resilience should consider the ripple effects of animal disease-related disruptions on related industries. 

    References 

    Economic Research Service, USDA. 2024. “International Baseline Projections.” Accessed: 2024-02-02. 

    Lwin, Wuit Yi, K. Aleks Schaefer, and Amy D. Hagerman. 2024. “Animal Disease Outbreaks and Upstream Soybean Trade.” Food Policy, 127: 102685.

  • Can I deduct timber loss from natural disasters?

    Can I deduct timber loss from natural disasters?

    Following recent droughts, hurricanes, or other natural disasters, many timber owners may wonder if they can deduct timber losses on their federal income tax returns. As with many tax questions, the answer is often, “It depends.” While it sounds unhelpful, it reflects the complexity of factors that can influence the eligibility for the tax deduction. Furthermore, even if the timber losses are deductible, they may be subject to different deduction rules regarding types of losses, ways to calculate the deduction, and limitations on the deductible losses. These also have implications for the forms used to claim the deductions and documents for record keeping. 

    This article focuses on the tax treatment of timber losses from natural disasters for federal income tax purposes. The rules for income tax deductions for yard trees differ from those for timber. We’ll cover that topic in a future article. As mentioned in a previous article in this series, the classification of your timber holding has important tax implications. Timber holding can generally be classified as one of the following three types: 1) for personal use or as a hobby (not-for-profit); 2) as an investment; or 3) for trade or use in a trade or business.

    Natural disasters and types of timber losses

    Not all natural disasters are treated the same when it comes to timber loss deductions on your federal income tax returns. Timber losses from natural disasters could be treated as casualty losses or noncasualty losses. 

    • Casualty timber loss. If the timber loss is caused by natural disasters such as fire, storm, flood, hurricane, volcanic eruption, or earthquake, it could be treated as a casualty loss. For federal income tax purposes, a casualty is an identifiable event that is sudden, unexpected, and unusual. Suddenness is a key element, and it means the suddenness of the loss rather than the suddenness of the event itself (Rev. Rul. 87-59). Therefore, timber losses due to gradual deterioration are not considered casualty losses. For example, losses of timber following prolonged droughts (Rev. Rul. 90-61) or epidemic attacks of Southern Pine Beetles (SPB) are generally not considered casualty losses
    • Noncasualty timber losses. Noncasualty timber loss is the loss of timber due to an identifiable event that is unexpected and unusual but does not meet the suddenness requirement. The loss may result from a combination of factors. For example, timber losses from prolonged droughts or epidemic attacks of beetles (e.g., mountain pine beetles, SPB) could qualify as noncasualty losses for landowners holding timber in a trade or business or as an investment. 

    However, tree mortality caused by routine disease and normal levels of insect infestation is considered a cost of doing business and is not treated as either a casualty loss or a noncasualty loss. These losses are recoverable through depletion when the timber is sold or harvested.

    Tax treatment of casualty timber losses vs. noncasualty timber losses 

    There are several tax advantages to timber casualty losses compared to noncasualty losses: 

    • Deduction from ordinary income. Timber casualty losses are deducted from ordinary income, while timber noncasualty losses offset section 1231 gains first, which are taxed at the lower long-term capital gains rate. 
    • Eligibility. Casualty loss deduction is available for all types of timber holdings, including timber for personal use (subject to the $100 reduction and 10% adjusted gross income rule and presidentially declared disaster area). In contrast, noncasualty loss deduction is only available for timber held in a trade or business or as an investment. 
    • Loss estimation method. Timber casualty losses are estimated using a block approach (IRS, 2011). Deductible timber casualty loss is the lesser of (1) the adjusted timber basis or 2) the diminution in the fair market value of the timber block due to the casualty. In contrast, timber noncausality losses are estimated like a timber sale by multiplying the depletion unit by the quantity of timber destroyed. When the timber depletion block is large, and only a relatively smaller portion of it is damaged or destroyed, the deductible timber casualty loss could be greater than if the loss were considered noncasualty. 
    • Special provisions for federally declared disaster areas. If the timber casualty loss results from a presidentially declared disaster, you can deduct the casualty loss in the current year or on an amended return for the previous year. 

    Landowners may experience significant timber losses due to various natural disasters. Federal income tax provisions are available to help landowners recoup some of the losses. However, the tax treatment of timber losses varies depending on the type of natural disaster and the classification of the timber holding. In most cases, the deductible timber losses may not fully reflect the actual economic losses. Affected landowners are encouraged to consult with a forester and tax advisor for advice specific to their situation. 

    References

    IRS. 2011. Timber casualty loss audit techniques guide. 

    Resources:

    Li, Y. 2019. Income tax deductions for hurricane-damaged timber losses. University of Georgia.

    National timber tax website: www.timbertax.org.

    Tanger, S., Dicke, S., and Henderson, J. 2021. Frequently asked questions about timber casualty losses. Mississippi State University. 

    Wang, L. 2018. Income tax deduction on timber and landscape tree loss from casualty. USDA Forest Service. 


    Li, Yanshu. “Can I deduct timber loss from natural disasters?Southern Ag Today 4(34.3). August 21, 2024. Permalink

  • The Relationship Between Formula and Negotiated Cash Fed Cattle Prices

    The Relationship Between Formula and Negotiated Cash Fed Cattle Prices

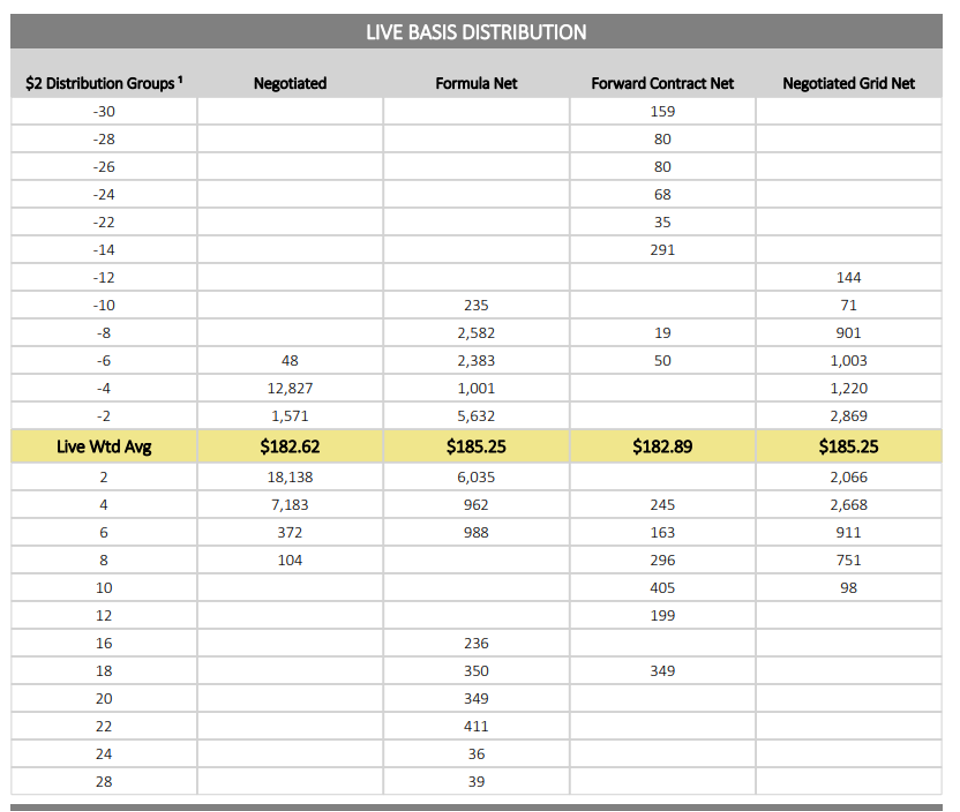
    In August 2021, the USDA announced a new market news report that would contain the distribution of weekly US fed cattle prices using price “bins” (LM_CT215). What makes this report unique is the way that price data are reported. Prices are reported in $2 increments, or bins, for negotiated cash, net formula, net forward contract, and negotiated grid nets. Figure 1 shows an example of how these weekly data are reported. The weekly weighted average live fed cattle price is highlighted in Figure 1.  The number of fed cattle selling at each $2 per cwt premium or discount to the average is reported in the grid.  

    Figure 1. Snapshot of Data Reported in USDA National Weekly Direct Beef Type Price Distribution (LM_CT215)

    Source: USDA AMS

    The new distributional data allow market participants to understand fed cattle prices in more detail and go beyond minimum, maximum, and average prices for each marketing type. With this new distributional dataset for formula and negotiated fed cattle prices, we[1] analyzed how weekly prices between these two markets interact with each other. One objective of our study centered around the impacts of negotiated prices on cattle markets. Specifically, as concerns have risen in relation to a possible thin cash market, we wanted to understand whether or not negotiated prices impact formula prices, or if it’s the other way around, as some market participants have suggested. Figure 2 displays a visual representation of the results from our study and shows how prices interact with each other (from August 10, 2021, to May 14, 2024). Current negotiated (orange) and formula (blue) prices for a given week are in the middle. We found that, depending on the market, current prices are impacted by the preceding three weeks of prices (the two columns on the right and left).

    Figure 2. Negotiated Cash and Formula Fed Cattle Price Relationship Flow Chart. Data is weekly for the time range, August 10, 2021, to May 14, 2024 (n = 145).

    Our study found that the current negotiated cash price for a given week (top middle orange box) is positively impacted by the week prior negotiated cash price (green dotted line), and negatively impacted by the negotiated price 3-weeks prior (solid red line). Current formula prices were found to be positively impacted (green dotted line) by the formula price from the prior week and the prior two weeks of negotiated fed cattle prices. However, formula prices were negatively impacted (solid red line) by formula price from two weeks prior. 

    Despite concerns that the negotiated cash market is too thin and does not provide marketing information to the formula market, we find that the negotiated price does influence the formula fed cattle price. We find evidence supporting the conclusion that negotiated cash price information is being transmitted to formula price variability, which is expected because formula prices are designed to be based on the negotiated trade. Our results also indicate that formula prices do not impact on the negotiated price. 


    [1] Boyer, C.N., E. Park, A. F. Ramsey, and C. Martinez. 2024. “Formula and Cash Negotiated Fed Cattle Price Relationships”. Journal of Agricultural and Resource Economics, forthcoming.


    Martinez, Charley, Christopher Boyer, Eunchun Park, and A. Ford Ramsey. “The Relationship Between Formula and Negotiated Cash Fed Cattle Prices.Southern Ag Today 4(34.2). August 20, 2024. Permalink

  • The Week that Followed the August WASDE Report

    The Week that Followed the August WASDE Report

    The August 2024 World Agricultural Supply and Demand Estimates (WASDE) report included indicators of record yields and production, lower average prices, and some mixed market signals in the week that followed the release.  On August 12, the USDA released the WASDE report projecting a record corn yield of 183.1 bushels per acre.  The increased corn yield more than offsets a reduction in harvested acres, resulting in a forecast of 15.15 billion bushels.  If realized, total U.S. corn production would be the third-largest corn crop on record, roughly 200 million bushels behind the 15.34 billion bushel record crop of 2023.  With increased exports, ending stocks are expected to fall slightly to 2.1 million bushels.

    The USDA also reported a record soybean yield of 53.2 bushels per acre, and forecasted record production of 4.59 billion bushels.  Even with a small increase in projected exports, ending stocks are projected to increase significantly to 560 million bushels.  As a result of these projections, the average farm price for 2024/25 is projected to be $4.20/bu for corn (down 10 cents/bu from the month prior) and $10.80/bu for soybeans (down 30 cents/bu from the month prior).  

    For cotton, acreage and production estimates were both lowered.  Yields are projected at 840 pounds per acre, while planted acres are down about 500 thousand acres.  Combined with an expected increase in the abandonment rate from the prior month, production estimates are expected to be 15.11 million bales.  Total use also is projected to decline with decreases in both domestic use and exports, resulting in a 4.5 million bale ending stock.  Even with lower ending stocks, the average farm price for 2024/25 is projected to be 66 cents/lb (down 2 cents/lb from the month prior).  

    Long-grain rice production is expected to decline only slightly to 167.2 million hundredweight, with ending stocks following suit, down to 23.2 million hundredweight. The average farm price remained steady at $14.50/cwt.

    The week that followed this report was filled with ups and downs, but overall indications of a low-price environment this fall and winter.  Table 1 illustrates the last futures market trade price for November/December contracts for corn, soybeans, cotton, and rough rice for each day since August 9, the day before the WASDE release.  On August 12, the day of the release, the corn contract increased 6.5 cents from the prior day, with an attempt to stay at the $4/bu mark that didn’t make it through Friday.  The November soybean futures price saw a 16.5 cent drop from the prior day and continued to fall thereafter, down to $9.57 by the end of day Friday, marking a one-week drop of 45.4 cents/bu.  Meanwhile, cotton appeared to make an attempt at the 70 cent/lb mark after the WASDE release, but ultimately has continued the fall to near 67.24 cents/lb by the end of the week.  Rough rice initially dropped 28.5 cents from the prior day, but did rebound to above $15/cwt before pulling back again to close out the week at $14.725/cwt.  The reaction to the August WASDE report indicates a continued downward trend in futures prices, with a high likelihood that prices remain depressed through harvest. The 2024/25 marketing year is setting up to be a challenging year for profitability for most farmers. Producers need to ensure they are obtaining the most out of their  marketing plans under these challenging circumstances.  

    Table 1. Futures Market Prices around the August WASDE Report for Nov/Dec Contract Dates for Select Commodities

    Source: Prices obtained from https://www.barchart.com/.
    Note: Prices are the last trade price reported on the given date.  The August WASDE report was released at 12pm ET on 8/12.
     

    References:

    USDA World Agricultural Supply and Demand Estimates, August 12, 2024.  Available at: https://www.usda.gov/oce/commodity/wasde/wasde0824.pdf


    Rabinowitz, Adam. “The Week that Followed the August WASDE Report.Southern Ag Today 4(34.1). August 19, 2024. Permalink

  • Making Cooperatives More Relevant and Exciting

    Making Cooperatives More Relevant and Exciting

    I truly enjoyed Phil Kenkel’s Southern Ag Today’s Article “Why Don’t We Start More Cooperatives?” The points and questions he raised got me thinking about cooperative formation opportunities and challenges faced by today’s business owners and society in general. 

    Recently, Phil’s article again came to mind when someone interviewed me about what it meant to run a cooperative development center: what were the challenges and opportunities? My answer to this question was that we must make cooperatives more relevant and exciting. 

    Relevance

    Certainly, the successful cooperatives we have in the United States are prime examples of relevance: credit unions, mutual insurance companies, cotton gins, peanut shellers, dairy processors, and many more.  By relevance, I mean a general awareness of cooperative organization being an option for incorporation.  

    I also believe we may be on the cusp of a cooperative resurgence.  Over 200 years ago, the cooperative movement was largely credited as society’s reaction to the Industrial Revolution, when the workforce had to adjust to mechanized production processes. At the same time, the manufacturing and transportation industries were consolidating into very large firms.  

    Today, we are amid the Digital Revolution, where society is grappling with information technology and artificial intelligence during a period of consolidation and rapid growth of technology firms, which has immensely changed commerce.  Cooperatives may yet again provide society with a response to these trends.   

    Excitement

    How does one get excited about a business structure? Well, a cooperative does have the word “cooperate” embedded in it, so that helps.  Also, in its most basic form, cooperative membership equates to one member, one vote, meaning equal voting representation for all its members.  So, a cooperative structure also embodies the principles of democracy.

    However, my take is that corporate by-laws (although important) are not an exciting rallying point.  Rather, what is the purpose of groups coming together? To address common social, economic, or cultural needs, as defined by the National Cooperative Business Association? How about gaining additional power and independence in an economic system where smaller actors are having an increasingly difficult time? All the above reasons seem compelling to me!

    The local foods movement has provided plenty of excitement and challenges to this space. A “food hub” is a relatively new business model that encompasses the aggregation, distribution, and marketing of local/regionally produced food products (Bartham, 2010).  This definition is remarkably similar to that of a farmers’ cooperative, aside from the fact that some food hubs are non-profit corporations (or other entities) not owned and controlled by farmers. 

    At the South Carolina Center for Cooperative and Enterprise Development, we have had good results generating excitement about cooperatives focusing on these current trends. Within the past 4 years, we have started eight new cooperatives, each addressing issues important to their members.  Some examples:

    Once started, of course, the work does not end.  Keeping cooperatives running smoothly and efficiently is also necessary.  Thankfully, there are many sources of support.

    Assistance for Cooperative Development

    Like the SC Center for Cooperative Development at Clemson University, many land-grant universities have cooperative centers that help train new board members and develop current board members. There is also CooperationWorks!, a non-profit that supports both land-grant and non-land-grant cooperative development centers. A map of development centers can be found on their website, along with many good supporting materials. 

    The USDA Rural Development encourages cooperative development and helps fund cooperative development through its Rural Cooperative Development Grants, gives priority points to cooperatives on its Value-Added Producer Grants, and provides direct assistance to minority-owned cooperatives through its Socially Disadvantaged Groups Grant.  

    Returning to Phil Kenkel’s article with his last line quoted, “Perhaps we just need to recycle some good old ideas!” seems appropriate to repeat. Maybe I would modify it just slightly to “recycle and repackage.” 


    Resources and References

    Bartham, J. (2010). Getting to Scale with Regional Food Hubs.  USDA Rural Development website accessed 7.17.2024. https://www.usda.gov/media/blog/2010/12/14/getting-scale-regional-food-hubs

    CooperationWorks! The National Cooperative Development Network.  Cooperative Development Locations.  Website accessed 7.17.2024. https://cooperationworks.coop/member-locator/#search

    Kenkel, P. (2024). Why Don’t We Start More Cooperatives? Southern Ag Today.  https://southernagtoday.org/2024/05/17/why-dont-we-start-more-cooperatives/

    National Cooperative Business Association. (2024). What is a Coop?  NCBA website accessed 7.17.2024 https://ncbaclusa.coop/resources/what-is-a-co-op/

    South Carolina Center for Cooperative and Enterprise Development (2024). Website accessed 7.17.2024. https://coopcentersc.org/

    South Carolina Department of Agriculture (2022). New Beef Co-op Seeks to Expand Processing, Create SC Beef Product.  SC Department of Agriculture News Release. https://agriculture.sc.gov/new-beef-co-op-aims-to-expand-processing-create-sc-beef-product/

    South Carolina Department of Agriculture (2024). New Cut Flower Co-op Working to Market South Carolina Blooms. SC Department of Agriculture News Release. https://cooperationworks.coop/success_stories/new-cut-flower-co-op-working-to-market-wholesale-south-carolina-blooms/

    United States Department of Agriculture, National Institute of Food and Agriculture. Land Grant Colleges and Universities (2019).  Website accessed 7.17.2024. https://www.nifa.usda.gov/sites/default/files/resource/LGU-Map-03-18-19.pdf  

    United States Department of Agriculture, Rural Development (2022). Preserving Seafood Heritage by Bringing in Next Generation.  Rural Development Success Stories. Website accessed 7.17.2024. https://www.rd.usda.gov/newsroom/success-stories/preserving-seafood-heritage-bringing-next-generation

    United States Department of Agriculture, Rural Development (2022). Gullah Coop: Growing Food, Preserving Culture.  Rural Development Success Stories. Website accessed 7.17.2024. https://www.rd.usda.gov/newsroom/success-stories/gullah-co-op-growing-food-preserving-culture

    United States Department of Agriculture, Rural Development (2024). Website accessed 7.17.2024. Webpage resources:

    Service Center Locator https://www.rd.usda.gov/browse-state

    Rural Cooperative Development Grant https://www.rd.usda.gov/programs-services/business-programs/rural-cooperative-development-grant-program
    Value Added Producer Grant
     https://www.rd.usda.gov/programs-services/business-programs/value-added-producer-grants
    Socially Disadvantaged Groups Grant https://www.rd.usda.gov/programs-services/business-programs/socially-disadvantaged-groups-grant


    Richards, Steven. “Making Cooperatives More Relevant and Exciting.” Southern Ag Today 4(33.5). August 16, 2024. Permalink