In January 2026, the Texas Agricultural Cooperative Council (TACC) held their annual Farm Store Summit. The Summit is a gathering of farm store managers which allows for the sharing of ideas, success stories, and strategies in response to their greatest challenges. As participants discussed the challenges facing their farm store operations, three themes stood out.
I. Increasing Competition
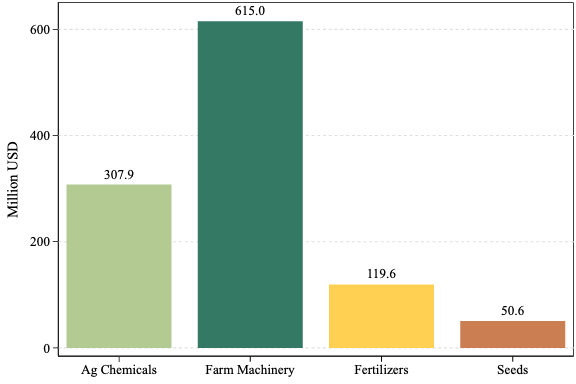
Consolidation in supply markets, especially for fertilizer, chemical, and seed, is having a negative impact on form store profitability. Agricultural industries are populated by some very large suppliers who may also be competitors in the retail space. That’s a difficult situation for a local cooperative farm store. Increasing urbanization adds to the challenge with a change in the surrounding customer base. As agriculture loses acres to homes and other industries, cooperatives are challenged to adapt to an urban consumer to help maintain sales volume. They strive to tell these customers that they are welcome at the co-op. These changes also bring increased competition from urban-focused retailers like Walmart, Home Depot, and Tractor Supply Co. Although cooperatives feel they might have an advantage in expertise, their competitors are marketing and distribution powerhouses.
II. Finding Good Employees
Several times during the summit a manager praised the value of a good employee. In a retail business, employees can make all the difference. They are the first to greet customers and the last to ensure that all expectations were met. Employees that are friendly and engaging with customers generate increased sales. Likewise, poor employees can leave customers feeling dissatisfied and inclined to take their business elsewhere. Even when everything else in the cooperative is executed perfectly, negative behavior and attitudes of employees will be felt in sales. As one manager put it, “culture can edge out competency”. Cooperative farm store managers are replacing the negative energy of poor employees with the profitability that comes with employees that value and understand excellent customer service.
III. The Attitude of the Board
Perhaps the greatest challenge to the cooperative farm store comes from within the board room. Many managers expressed concern over the attitude of board members toward retail operations. Board members sometimes see their farm store as a needed service rather than a profit center for the cooperative. They are willing to take losses on an activity that represents a convenience or perceived security, especially when the cooperative has another primary activity, such as a grain elevator. However, a profitable farm store represents added resilience to overall cooperative operations. Additionally, board members may focus on the convenience aspects of carrying certain inventory and neglect the profit considerations of inventory turnover. A tractor part may seem invaluable for an occasional emergency, but inventory that sits on the shelf for ten years has already lost money. Retail space and the money used to stock the shelves are investments.
Successful farm stores are valuable to their members and communities. Not only do they provide needed products and services, but they also generate profits from other parts of the supply chain. Their success depends on adapting to competition, excellent customer service, and direction from a board that is focused on profit and financial stability.
Park, John. “Challenges for the Cooperative Farm Store in 2026.” Southern Ag Today 6(7.5). February 13, 2026. Permalink