Blog

  • Record Egg Prices Driven by Supply Disruptions

    Record Egg Prices Driven by Supply Disruptions

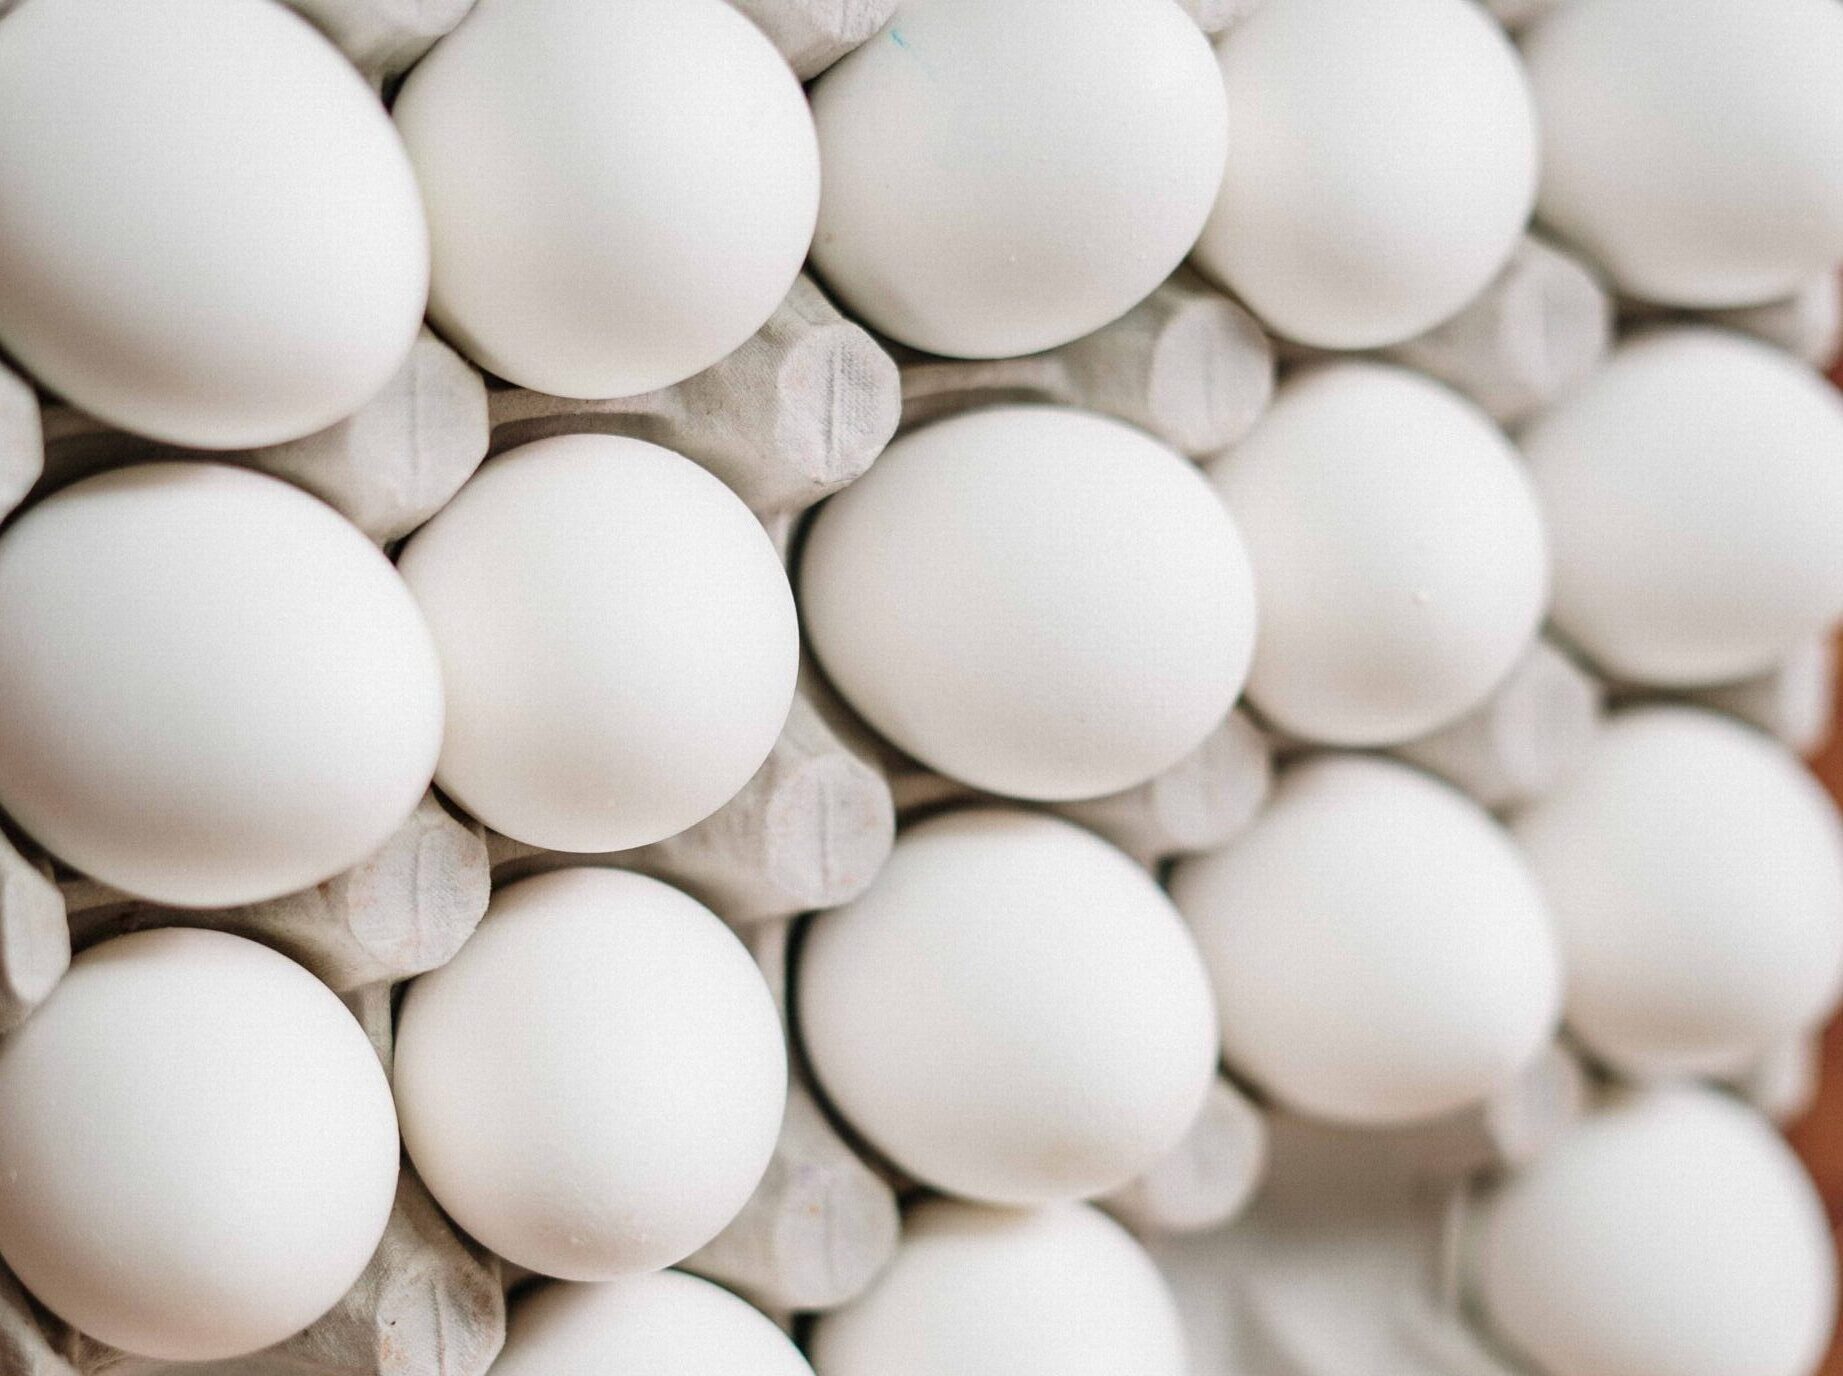
    Prices at the grocery store are higher for nearly everything, but one staple food item, in particular, is likely a key driver of recent sticker shock for consumers. Egg prices during the holiday season were up more than double over the same period in 2021. Retail egg prices averaged $4.25 per dozen in December 2022, a record high. This compares to $1.79 per dozen in December 2021.

    The main culprit of the higher prices is a supply disruption at a time when consumers have a strong demand for eggs. Highly Pathogenic Avian Influenza (HPAI), often called the bird flu, is an important concern each year, but was especially problematic in the U.S. during 2022. USDA reports that HPAI was detected in 307 commercial flocks in 2022. HPAI is very contagious between birds, so strict containment protocols including depopulation of infected flocks are used to prevent additional spread to other flocks. 

    USDA estimates that approximately 57 million birds in the U.S. were affected by HPAI in 2022. Of this total, nearly 40 million were egg laying hens lost to HPAI between February and December 2022. There were 320 to 335 million hens laying eggs each month in 2021 but that total has been in the 299 to 310 million hen range between April to October 2022. Fewer laying hens has led to fewer eggs produced and tighter supplies for eggs consumers.  Egg production has trended down over the last couple of years due to high feed costs, rising other production costs, and the turmoil of the pandemic on profits.

    On the demand side, the holiday season is peak season for egg consumption. According to the first weekly USDA “Egg Markets Overview” of 2023, an estimated 11.4 eggs during the Thanksgiving holiday and 8.6 eggs during Christmas were used per household. The Christmas estimate is 1.6 eggs higher than Christmas 2021. Even at high prices, U.S. consumers still purchased a lot of eggs over the holidays. Strong demand at a time when supplies are tighter drove egg prices higher.  

    The good news is that egg prices are expected to moderate in the months ahead. Consumer demand for eggs will not be at holiday levels, except for Easter egg hunts, and egg producers will continue to try to recover from the supply disruptions. HPAI concerns will continue into 2023 and future impacts could affect supplies this year, too. But current USDA forecasts are for 2023 egg prices to fall back to more normal levels as the supply and demand balance improves.    

    Mississippi state university logo

    Author: Josh Maples

    Assistant Professor, Livestock, Production Economics, Commodity Marketing

    Mississippi State University


    Maples, Josh. “Record Egg Prices Driven by Supply Disruptions.” Southern Ag Today 3(5.2). January 31, 2023. Permalink

    Image credit to Julia Filrovska

  • Traditional Stock-to-Use Ratios are of Little Value in Determining Peanut Prices

    Traditional Stock-to-Use Ratios are of Little Value in Determining Peanut Prices

    A common approach adopted by analysts and researchers is to investigate the relationship between the marketing year average price and the stocks-to-use ratio.  The stocks-to-use ratio (S/U) is often cited as an easy representation of the relationship between supply and demand.  When the S/U ratios are low, the supply of the commodity is low relative to the demand.  This is typically an indicator of high prices.  When the S/U ratios are high, the supply of the commodity is high relative to the demand.  Prices in these cases would be expected to be much lower.

    The marketing year average price, as determined by the National Agricultural Statistics Service (NASS), is the weighted average of monthly prices of commodities surveyed during the marketing year, whereas the S/U ratio is computed as the ratio of ending stocks to total demand during the marketing year. The marketing year varies for different commodities. Corn and soybeans have marketing years from September 1 to August 31.  Peanuts has a marketing year of August 1 to July 31. 

    We look at the relationship between S/U ratios and prices for corn and soybeans in figures 1 and 2.  During the period of 2003-2021, we clearly observe the expected downward sloping relationship for corn and soybeans.  As the supply increases, relative to the demand, the price of the commodity is lower.  Figure 3 shows the relationship between S/U ratios and the price of peanuts, or more precisely the lack of any relationship between these two indicators.  In other words, there is no relationship between current peanut prices and current measures of supply and demand.

    The negative relationship in the corn and soybean market can be attributed to the size of the crop, significant number of spot market transactions and the existence of a futures market, with the latter two contributing to price discovery in the market.  However, the similarity between corn and soybeans and that of peanuts is that all are grown in the south – yet that is where it ends. The peanut crop is small relative to these larger commodities, with sales largely done through contracts between the growers and a concentrated sheller market. The absence of a futures market is also a factor that limits price discovery and transparency which could account for the lack of responsiveness in prices to current market conditions. So, while S/U ratios are helpful in explaining prices of many commodities, the same is not true for the peanut sector.

    Figure 1. Corn Marketing Year Average Price and Stocks-to-Use Ratios from 2003-2021

    Source: USDA National Agricultural Statistics Service (USDA-NASS) and USDA World Agricultural Supply and Demand Estimates (USDA WASDE) 

    Figure 2. Soybean Marketing Year Average Price and Stocks-to-Use Ratios from 2003-2021

    Source: USDA National Agricultural Statistics Service (USDA-NASS) and USDA World Agricultural Supply and Demand Estimates (USDA WASDE) 

    Figure 3. Peanut Marketing Year Average Price and Stocks-to-Use Ratios from 2003-2021

    Source: USDA National Agricultural Statistics Service (USDA-NASS) and Oil Crops Yearbook (USDA ERS)

    Attah, Festus, and Adam Rabinowitz. “Traditional Stocks-to-Use Ratios are of Little Value in Determining Peanut Prices.Southern Ag Today 3(5.1). January 30, 2023. Permalink

  • Cooperative Farm Stores and Challenge of Member Loyalty

    Cooperative Farm Stores and Challenge of Member Loyalty

    Recently at the Texas Agricultural Cooperative Council’s Farm Store Summit, cooperative farm store managers held a roundtable discussion on the challenges they face. While issues such as the lack of skilled labor and loss of farmland were discussed, participants described a worrisome cycle regarding the farm store’s value proposition.

    The cycle can be described something like this:

    1. Cooperatives sometimes struggle with a fear or inability to invest in activities that will broaden their value proposition
    2. As a result, they engage in more price-focused competition
    3. The cooperative struggles with a fear or inability to maintain or increase price margins
    4. The co-op becomes less profitable, which in turn causes an inability to invest in value-adding activities (back to step 1). 

    When a cooperative farm store is experiencing cost inflation and is not willing to pass some or all of the increase on to member-owners by maintaining price margins, they experience a financial strain that can result in a reduced power to invest in the co-op. This means less labor that can be hired, or less customer service training for existing employees. Well-trained labor is an investment that can generate greater sales, and not a simple expense to be written off by managers or boards. Finally, boards must adopt the expectation that the cooperative farm store should make a profit. Developing a value proposition focused on service is essential for success. 

    The cooperative’s ability to maintain member loyalty is ultimately tied to its value proposition. If the only value that members can see in cooperative ownership is rooted in price, their loyalty will lie with the best price, whether it be at the co-op or a competitor. Developing member value that is based on customer service, convenience, or other customer-centric factors will allow for a healthy, long-term business relationship with patrons.

    Author: Conner Neumann

    Graduate Assistant- Agricultural Economics – Texas A&M University

    Author: John Park

    Roy B. Davis Professor of Agricultural Cooperation and Extension Specialist


    Neumann, Conner, and John Park. “Cooperative Farm Stores and the Challenge of Member Loyalty.Southern Ag Today 3(4.5). January 27, 2023. Permalink

    Top photo Credit to Wendy Wei

  • Brazil Challenging U.S. Corn Export Top Spot

    Brazil Challenging U.S. Corn Export Top Spot

    The U.S. has been the top corn exporter for a long time averaging around 45 percent of the world corn exports since 2000 with a high of 67 percent in 2005 (Figure 1).  The one exception since the turn of the century was in 2012; the most severe drought since the 1950s reduced corn production by over 13 percent in the largest producing states.  On the other hand, Brazil has increased its corn exports rapidly through the years securing the number two spot.  Brazil’s participation in the corn export market is quite remarkable. In 2000, corn exports from Brazil accounted for only 8.2 percent of the world total and reached its lowest volume of exports in 2004 with less than one percent. Brazil bounced back after claiming the top spot in 2012 and challenged the United States.  Currently, Brazil exports reached 47 million metric tons compared to 48.9 million metric tons for the United States, accounting for 26.4 and 27.4 percent of total world corn exports, respectively. 

    The top world corn importers are EU, China, Mexico, Japan, and South Korea accounting for 47.2 percent (Figure 2).  Similar to Brazil in the exporting market, China’s rise as a major corn importer is remarkable.  China had nearly zero corn imports from 2000 to 2008, then gradually increased its share reaching around five percent in 2011, 2014, and 2019, and finally exploding as a top market for corn in 2020 and 2021.  Currently, China occupies the number two spot between the EU and Mexico.  U.S. corn exports to China earlier this month were around 70 percent shorter than at the same point in the previous two years.  On the other hand, Brazil corn shipments to China last month reached over one million metric tons and is on track to repeat the same amount this month.  Although Brazil exports to China seem to be coming at the expense of the United States, China’s continued purchases are a good sign for the world corn market.

    Figure 1. Major World Exporters of Corn, MY 2012/13 – MY 2022/23

    Source: Production, Supply, and Distribution (PS&D); USDA-FAS

    Figure 2. Major World Importers of Corn, MY 2012/13 – MY 2022/23

    Source: Production, Supply, and Distribution (PS&D); USDA-FAS

    Author: Luis A. Ribera

    Professor and Director

    Center for North American Studies

    Texas A&M University


    Ribera, Luis. “Brazil Challenging U.S. Corn Export Top Spot.Southern Ag Today 3(4.4). January 26, 2023. Permalink

  • Income Averaging: An underutilized tax management strategy available to farms and commercial fisherman

    Income Averaging: An underutilized tax management strategy available to farms and commercial fisherman

    The following information is for educational purposes. Each situation is unique, and it is strongly encouraged to utilize tax and legal professionals about this topic and others.

    Income Averaging is a tax management tool that can be used by many farmers and commercial fishermen. It has been underutilized for some time but can provide benefits in many cases by reducing tax liability, depending on the facts and circumstances of the taxpayer. Income Averaging can also be used for capital gains, benefiting dairy and beef cow/calf producers who regularly cull their raised breeding livestock. 

    The name of the tax management strategy is a bit misleading; it is not a true averaging of a farm’s income but allows for the utilization of potential unused lower-income tax brackets found within the three previous tax base years. Income Averaging uses the 1040F, Schedule J. Not all income can utilize this method, so the first thing that must be determined is which income is eligible to be averaged. This is known as electable income. Once the electable income is determined, you must specify the amount of income to be elected. The elected income then must be divided by three, and that value applied to each of the three base years. 

    Utilizing Income Averaging, Schedule J does not affect the amount of income subject to income taxes owed. Furthermore, it does not affect Self-Employed Tax (Social Security, Medicare, etc.).

    The chart below illustrates the following example. In this example, the Eli Willy Ranch, Eli is married and files a joint return. In 2019, Eli had a farm income of $72,000, in 2020 income of $65,000, in 2021 income of $70,000, and 2022 income of $110,000. Eli’s 2022 Federal Tax liability would be $15,405, not including Self-Employment Tax. But using the Income Averaging option, Eli’s Federal Tax liability would be $9,160, a savings of $6,250.

    In many cases, even if the use of Income Averaging does not create tax liability savings, it may be advantageous to utilize Income Averaging to create a “hole” in the current tax year so that it can be used in future years with the hopes of higher income.

    Please work with a trusted tax and or legal advisor about whether your situation can gain an advantage using Income Averaging. 

    For additional farm tax publications and information, please visit ruraltax.org and IRS Publication 225, the Farmer’s Tax Guide.

    Author: Dr. Adam Kantrovich

    Extension Specialist, Clemson University.

    akantro@clemson.edu