Knowing how much it costs to produce your product is one of the most important pieces of information for a farmer, rancher, or agribusiness manager. The cost of production provides the foundation for calculating breakeven prices, which impact marketing plans and sales decisions. One effective tool for these calculations is the enterprise budget.
Enterprise budgets are detailed plans that estimate the costs of producing a specific agricultural product or service. An enterprise budget can be created for each crop, livestock, or service that a grower plans to produce during the year. Examples include corn, cotton, peanuts, feeder calves, hay, blueberries, tomatoes, cabbage, and many others. An enterprise budget is typically created on a per-acre, per-head, per-pound, or per-service basis. They are also created for one growing season or production cycle.
One of the first steps in creating an enterprise budget is to estimate costs. There are two types of costs, variable and fixed. Variable costs are use-related and will vary based on the level of production and the amount of input a grower plans to use. Variable costs can include seed, fertilizer, fuel, repairs & maintenance on machinery, labor, pesticides, or feed, depending upon the enterprise being evaluated. Fixed costs are time-based and do not change regardless of the production level. Fixed costs include land ownership costs, interest, depreciation on machinery and equipment, insurance, and taxes.
Once variable and fixed costs are estimated, a grower can calculate their breakeven price. The breakeven price is the price at which costs are covered, and profit is zero. Breakeven price equals total cost (variable + fixed costs) divided by expected yield, as shown in the equation below. The expected yield tends to come from historical data for that farm. Growers can also calculate a breakeven price that covers only their variable costs, the only difference being that you would use variable cost in the equation below instead of total cost..
Growers who estimate their breakeven price know the minimum price they need to get for their product to cover their costs. It is advised that growers lock in prices above breakeven as part of their marketing plan and sales decisions to give them a higher chance of making a profit.
The land-grant universities throughout our coverage area have enterprise budgets that can be used as a template for growers. These enterprise budgets are representative of the region where they were developed, and individual farm numbers will vary. Producers are highly encouraged to use the budgets as a template and adjust the numbers to reflect their production plans for the upcoming season. This will provide a more accurate estimate of their own cost of production and breakeven prices.
Rural land values in the U.S. sit at the intersection of agriculture, housing, energy, and long-term investment. Land values influence producers’ borrowing capacity and decision making while they influence households’ wealth and tax burdens, affecting the prosperity of rural communities. There was an increase in rural land and property values in the wake of the pandemic, due in part to high buyer demand. Remote workers were able to relocate from cities to rural areas as broadband access (high-speed internet) expanded and rural infrastructure improved in more remote regions (Smith, 2023), resulting in an emerging trend across the U.S. that further increased demand for rural land. Understanding the factors affecting rural land values help determine the resilience of farm operations and the affordability of rural living, both of which are important to the development of rural communities. This becomes even more pertinent given the recent shift in interest rates, along with the volatile nature of commodity prices, and growing competition for land from investors for various purposes such as renewable energy projects.
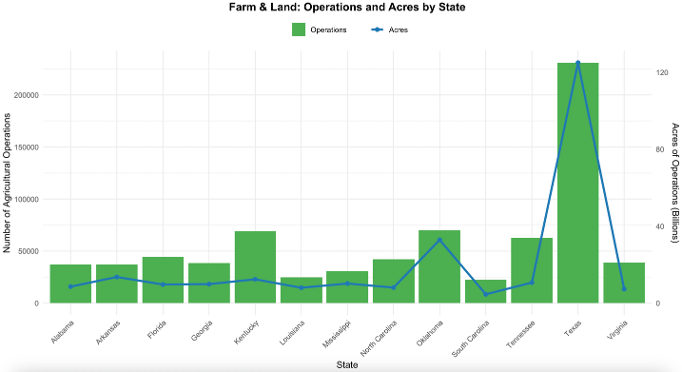
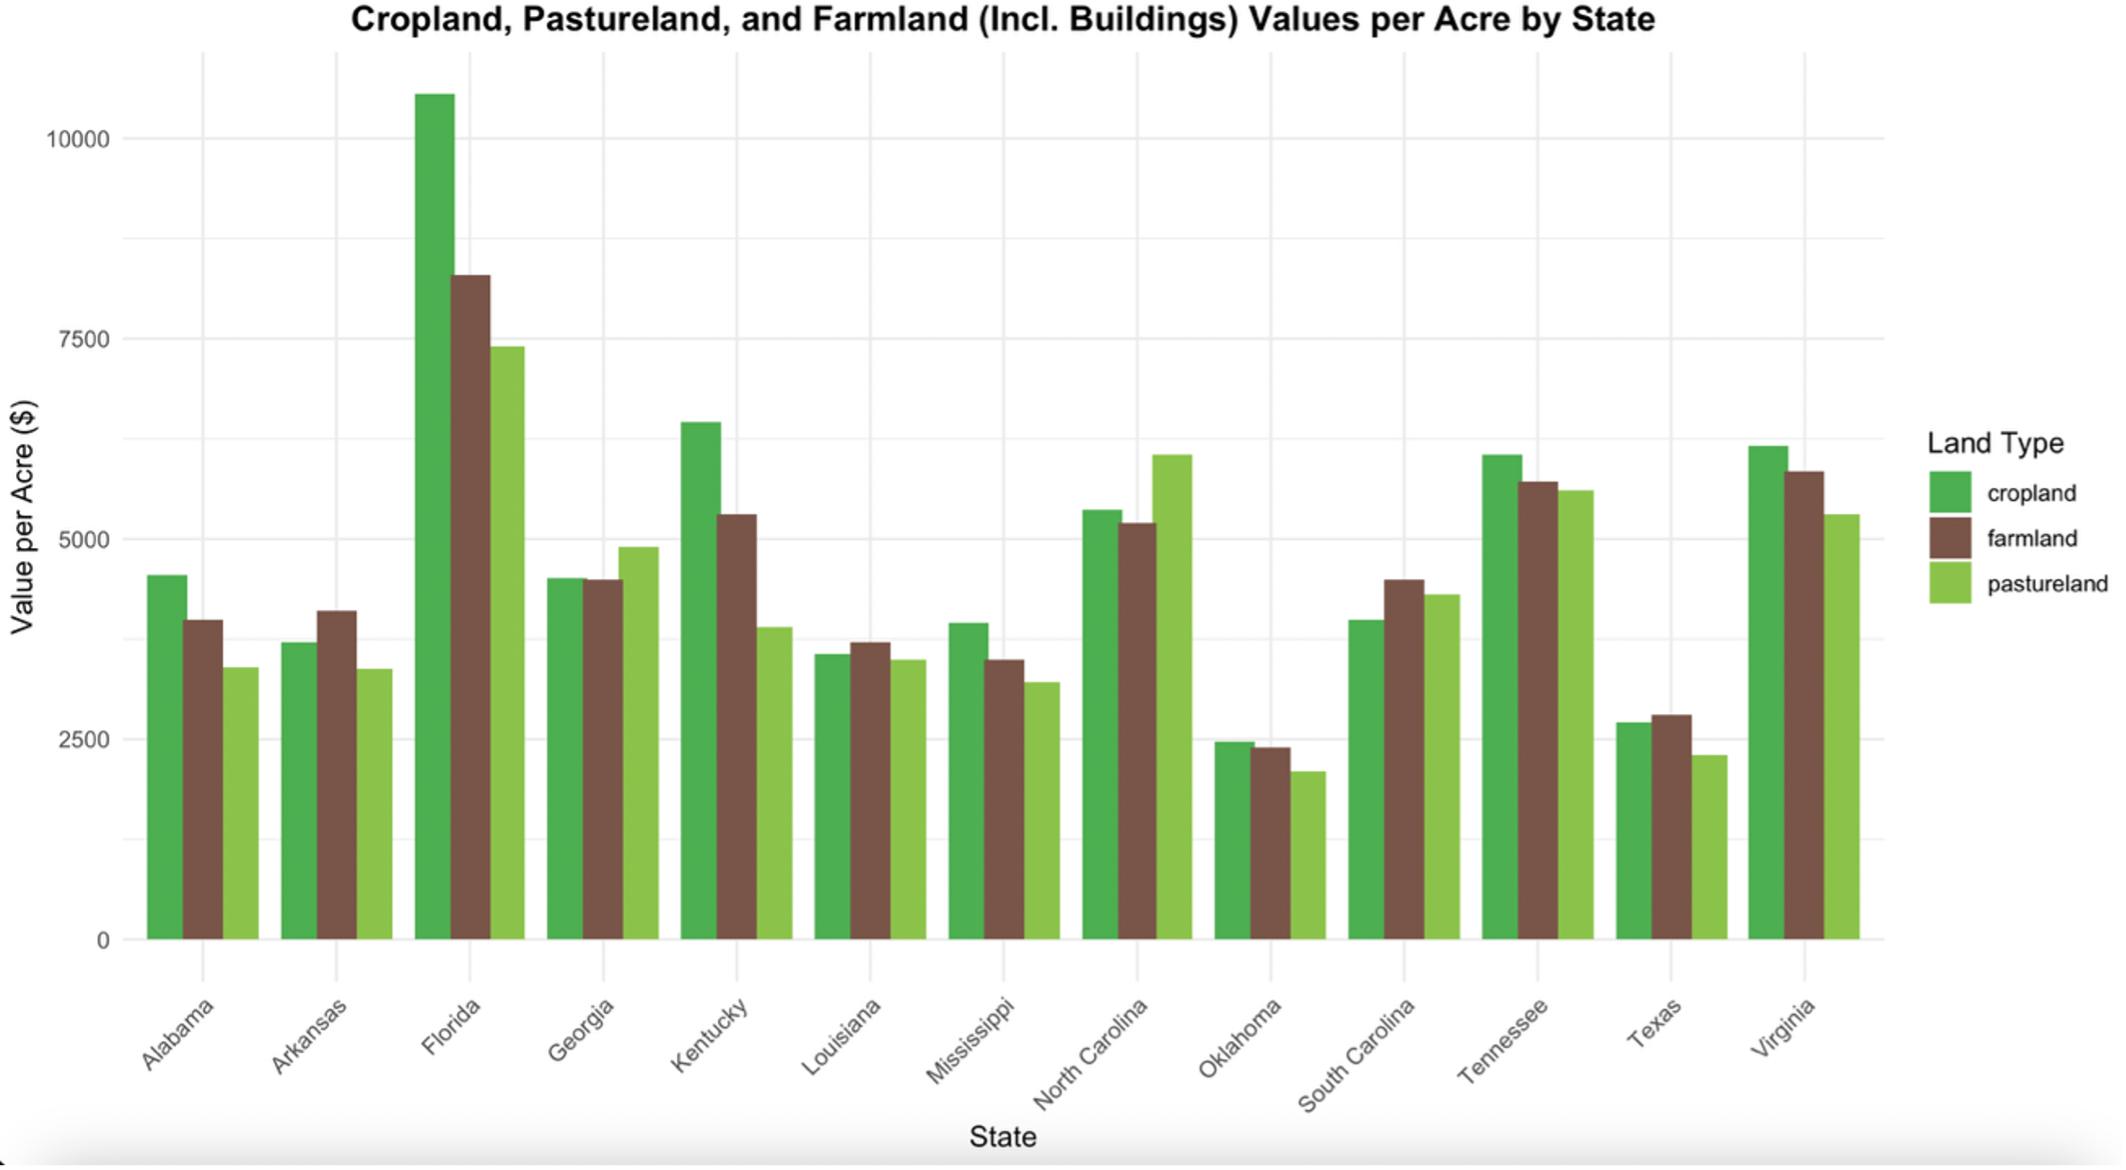
Texas is known for its rural character, having the most farmland in the country and by far the largest amount in the southern region (U.S Census, 2022, see Figure 1). Despite the state having one of the lowest land values in the region, second only to Oklahoma (Figure 2), its land value increased by about 55% over the past 10 years (Smith et al., 2025). Average per-acre land prices increased from $1,951 in 2017 to $3,021 in 2022, mostly driven by an increased recreational use potential (Smith et al., 2025). The 2024 Texas Land Trends report found that rural land values were highly influenced by demand for lifestyle-oriented buyers and investors rather than traditional farm income from production (ASFMRA-TX, 2024). Rural land in Texas was valued at nearly $300 billion in 2021, representing about 10% of the total rural real estate value in the U.S. (Su et al., 2024). Although farm income and commodity prices have shown peaks during the past decade, they have since returned to more stable levels, placing a significant financial burden on both new buyers trying to enter the market and long-time landowners struggling to hold on to their property. According to the ASFMRA- TX (2024), the strongest increases in land value in rural Texas were observed in Central Texas (48%) and the Upper Gulf Coast Region (12%) given their proximity to intense growing urban centers like Austin and Houston, respectively. In contrast, Far West Texas showed the slowest growth in value. Gilliland et al. (2020 & 2010) alluded to the sparse population, lack of urban development, and limited agricultural infrastructure as factors influencing the low land values in this region.
To examine the factors that influence land values, this article uses Washington County in Texas as an example. The county is in the Blackland Prairies region of southeast central Texas, an area influenced by its proximity to urban centers and its availability to those markets. Specifically, a 250-acre case study property was examined. The site features hilly topography, a mix of wooded and open areas, recreational infrastructure, and five building improvements, including a main house overlooking a small lake. To analyze the property’s market value and the factors influencing it, data from 136 comparable property sales in the county were used. A simple regression analysis was performed to identify significant factors that influenced land prices. The variables used in the analysis to determine the factors that influence property values in Washington County were minutes to Brenham (urban center), percentage of surface water, percentage of floodplain, percentage of wooded area, plot size, and market conditions.
The variables found to have a statistically significant impact were reduced drive time to Brenham (urban center), percentage of surface water, percentage of floodplain, and market conditions. The regression analysis showed that for every 5-minute increase in drive time to Brenham, land value decreased by 12%, while each 0.5% increase in surface water coverage added 5% to property value. Similarly, properties with more floodplain coverage saw a reduction in value by 4% for every 5% increase in floodplain, reflecting the risk for recreational buyers. Market conditions showed that land values are rising at about 1% per month, highlighting the constant rising demand. A characteristic that is important to note is that land size was deemed statistically insignificant, reinforcing the idea that amenities and accessibility influence more than acreage in recreational markets.
Washington County serves as an example of how non-agricultural factors are driving rural land valuation in Texas. Multiple factors influence land values in Texas that extend from traditional farm income and production capabilities. The statistical analysis done highlights that the tract location and accessibility are the factors that influence land value the most. As land near major cities often has a market rate significantly higher than those in remote areas. In Washington County, for example, public road frontage was found to be the most significant quality for impact on land prices, reflecting the importance of development potential and easy access. Soil quality and water availability also play major roles as fertile land and reliable water sources reduce production costs and enhance productivity (ASFMRA-TX, 2024). Other than traditional agricultural uses, recreational demand has become a powerful driver of land value, especially during the pandemic in 2020, when individuals sought for a rural homesites as comfortable retreats, prioritizing lifestyle and recreation over traditional farm income (Smith, 2023). Additionally, infrastructure and government incentives shape land value by determining how a tract of land can be used and improved. Research show that non-farm factors now play a crucial role as commodity prices or farm returns, highlighting the complex nature of Texas rural land valuation (Su et al., 2025).
Understanding the key drivers of rural land value, especially in counties like Washington, has various implications for a wide range of buyers. Landowners and investors can use this information to make more informed decisions about when and where to buy, sell, or how to develop rural properties, especially as recreational demand continues to rise. Local governments and planners benefit by recognizing how access to land, water features, and proximity to urban areas influence land use trends and can proactively manage growth through development and zoning decisions. Moreover, developers can use these findings to balance the competing interests of development and land preservation, especially in high demand areas. The growing trend of recreational land and displacement from agricultural income also raises concerns for new farmers and policy makers.
Figure 2. Cropland, Pastureland, and Farmland (including buildings) Values per Acre by State, 2024
Source: USDA-NASS (2025)
References:
American Society of Farm Managers and Rural Appraisers, Texas Chapter (ASFMRA-TX). (2024). Texas rural land value trends 2024. ASFMRA Texas Chapter.
Gilliland, C. E., Greaves, S., & Su, T. (2020). Structural trends of regional Texas rural land markets. Texas Real Estate Research Center at Texas A&M University. Available at: https://trerc.tamu.edu/article/structural-trends-regional-texas-rural-land-markets-2279/ (Accessed: 11 July 2025).
Gilliland, C. E., Gunadekar, A., Wiehe, K., & Whitmore, S. (2010). Characteristics of Texas land markets — A regional analysis. Texas A&M University Real Estate Center. Available at: https://trerc.tamu.edu/wp-content/uploads/files/PDFs/Articles/1937.pdf (Accessed: 11 July 2025).
Smith, R. (2023). Southwest land values up: COVID played a role. Farm Progress. Available at: https://www.farmprogress.com/farm-life/southwest-land-values-up-covid-played-a-role (Accessed: 11 July 2025).
Smith, L.A., Lopez, R.R., Lund, A.A., & Anderson, R.E. (2025). Status Update and Trends of Texas Working Lands 1997 – 2022. Texas A&M Natural Resources Institute, College Station, TX, USA. Available at: https://nri.tamu.edu/media/y04fu4b3/status-update-and-trends-2025-full-report.pdf (Accessed: 10 December 2025).
Su, T., Dharmasena, S., Leatham, D., & Gilliland, C. (2024). Texas rural land market integration: A causal analysis using machine learning applications. Machine Learning with Applications, 18, 100604. https://doi.org/10.1016/j.mlwa.2024.100604.
Su, T., Dharmasena, S., Leatham, D., & Gilliland, C. (2025). Modeling influence of agricultural and non-agricultural factors on Texas rural land market values. In Preprints.org.
U.S. Census Bureau. (2022). Nation’s Urban and Rural Populations Shift Following 2020 Census. Available at: https://www.census.gov/newsroom/press-releases/2022/urban-rural-populations.html (Accessed: 31 December 2025).
United States Department of Agriculture, National Agricultural Statistics Service (USDA-NASS) (2025). Available at: https://www.nass.usda.gov/Data_Visualization/Commodity/index.php (Accessed: 10 December 2025).
Program decisions for the 2026 crop year are fast approaching. This article considers the risk management options for cotton producers in light of current price projections and relevant changes in the One Big Beautiful Bill Act (OBBBA) signed into law on July 4, 2025. Given the commodity program and crop insurance changes in OBBBA, producers likely will want to re-evaluate their Title I program and crop insurance decisions for 2026 and beyond.
OBBBA strengthened the Title I programs Price Loss Coverage (PLC) and Agriculture Risk Coverage (ARC) by raising reference prices and increasing the coverage ARC provides, along with other changes. The Stacked Income Protection Plan (STAX) is an area-wide crop insurance policy exclusively for upland cotton producers, and cotton acres with a STAX policy are not eligible to sign up for ARC or PLC on the upland cotton base acres. In light of the recent improvements to ARC and PLC (and the prohibition on combining coverage with STAX), cotton producers should evaluate potential ARC/PLC payments before making their decision about STAX.
The Supplemental Coverage Option (SCO) is another area-wide supplemental crop insurance policy available for cotton and other major commodities. OBBBA improved SCO in two significant ways.
1) The premium subsidy increased from 65% to 80%, now equal to the STAX premium subsidy.
2) The restriction on ARC and SCO was removed. Prior to OBBBA, producers could combine SCO and PLC, but not SCO and ARC.
Cotton producers, especially those that utilized STAX in the past, may wish to consider SCO for 2026 instead (note that producers cannot have both STAX and SCO for the same crop on the same acres). SCO provides supplemental area-wide coverage – operating similarly to STAX – without causing producers to forgo potential ARC or PLC payments.
As a result, one strategy to consider involves (1) enrolling cotton base in ARC or PLC, (2) purchasing an individual crop insurance policy like Revenue Protection (RP) on your cotton acres, and (3) supplementing the RP policy with an area-wide endorsement like SCO. Producers may also wish to add a supplemental Enhanced Coverage Option (ECO) endorsement as well.
Every January, there is talk of New Year’s resolutions—a time to commit to improvements and set new goals. While health and personal finance often top the list of resolutions, there is no reason not to think about the farm business and marketing commitments in the same way. Farm profitability depends on effective management across many areas. Producers devote significant time and effort to decisions that affect crop production, but just as important is having a marketing plan for how the crop will be sold. Marketing is a continuous process that can span multiple production years, but it should be revisited for possible updating. With a solid marketing plan, producers can approach selling their crop as a year-round process rather than a single decision at one point in the year. This article highlights key considerations for developing a successful marketing strategy.
First, it is important to understand what a marketing plan is not. It is not a one-time silver bullet that guarantees sales at the highest price. While some producers may ‘beat’ the market in certain years, few can do so consistently. Commodity prices reflect supply and demand fundamentals, but in the short run, they are influenced by unpredictable events and new information. Even long-term outlooks are subject to shocks such as trade wars or other geopolitical developments. Expecting a marketing plan to always capture the top of the market sets up unrealistic goals. Instead, the value of a marketing plan lies in its ability to manage risk through consistent, disciplined decisions.
Every marketing plan should be anchored in the farm’s business goals. Those goals set the operation’s risk tolerance, cash-flow needs, and planning horizon. A producer nearing retirement may prioritize capital preservation, while a younger producer focused on growth may accept more price variability to preserve upside and liquidity. The plan should explicitly tie tactics to goals and assess which risks (price, basis, yield, liquidity, etc.) would most threaten those goals. In short, the marketing plan should serve the business plan, not the other way around.
Cost of production is the foundation of any marketing plan. Without a current, credible breakeven, you can’t judge whether a sale protects margin. Prices are volatile and mostly outside the producer’s control, so the most reliable gains come from managing inputs and operating efficiently. A sound approach is to build price objectives directly from breakeven, setting a minimum price that locks in a base margin. Additional targets can then be layered at predefined margin levels (for example, breakeven + $0.20 and + $0.40) based on the farm’s goals and cash-flow needs.
Marketing plans are most effective when they encourage proactive, rather than reactive, sales. Often, the worst sale is a forced sale, such as selling grain at harvest due to limited storage or pulling grain from the bin to meet a loan payment. Coordinating decision dates with price targets allows sales to be spread throughout the year. Crop markets frequently show seasonal strength in spring and early summer, making that window a natural fit for higher targets. Extending the marketing window, considering preharvest sales within the operation’s risk tolerance, and using crop insurance to backstop commitments can all help create more opportunities to lock in margin. Maintaining strong relationships with local buyers can also expand contract options and delivery flexibility.
Finally, it is essential to document the reasoning behind every marketing decision. A simple decision log noting the trigger, target price, quantity, tool, and rationale can reinforce discipline when action is required. The biggest threats to good marketing decisions are emotion, fear of making a mistake, and the temptation to hold out for just a little more. If a sale aligns with business goals and protects margin above breakeven, it is a sound decision, even if prices later move higher. Long-term success comes from steady, margin-protecting progress, not perfection on every sale. Now is an excellent time to make a New Year’s resolution for the farm by committing to a clear, disciplined marketing strategy for 2026 and beyond.
We ended 2025 examining total meat supplies, so this week we’ll take a closer look at chicken production.
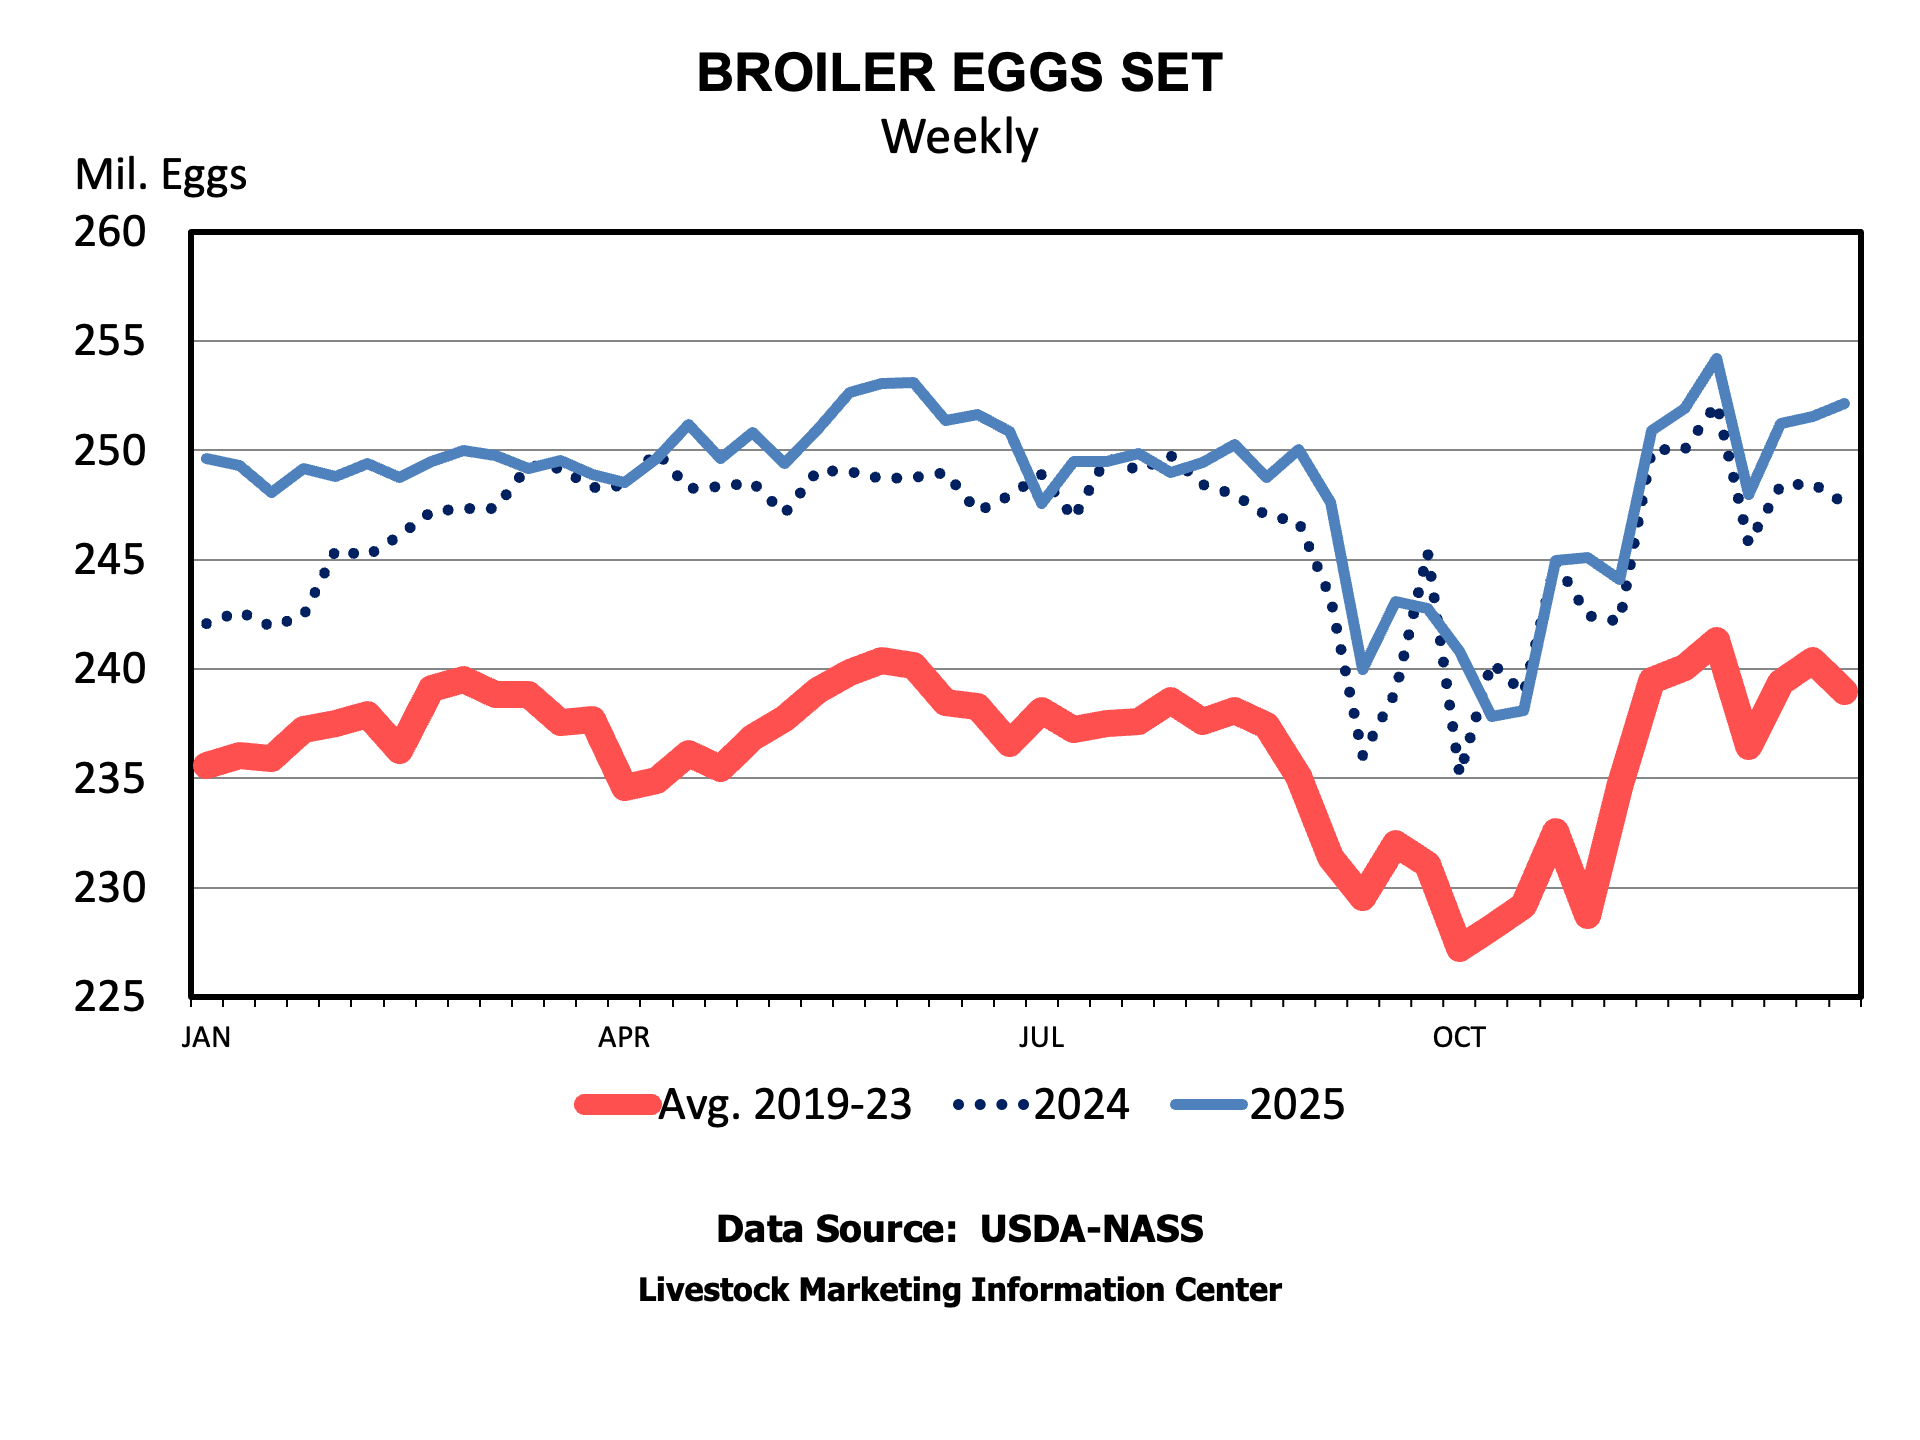
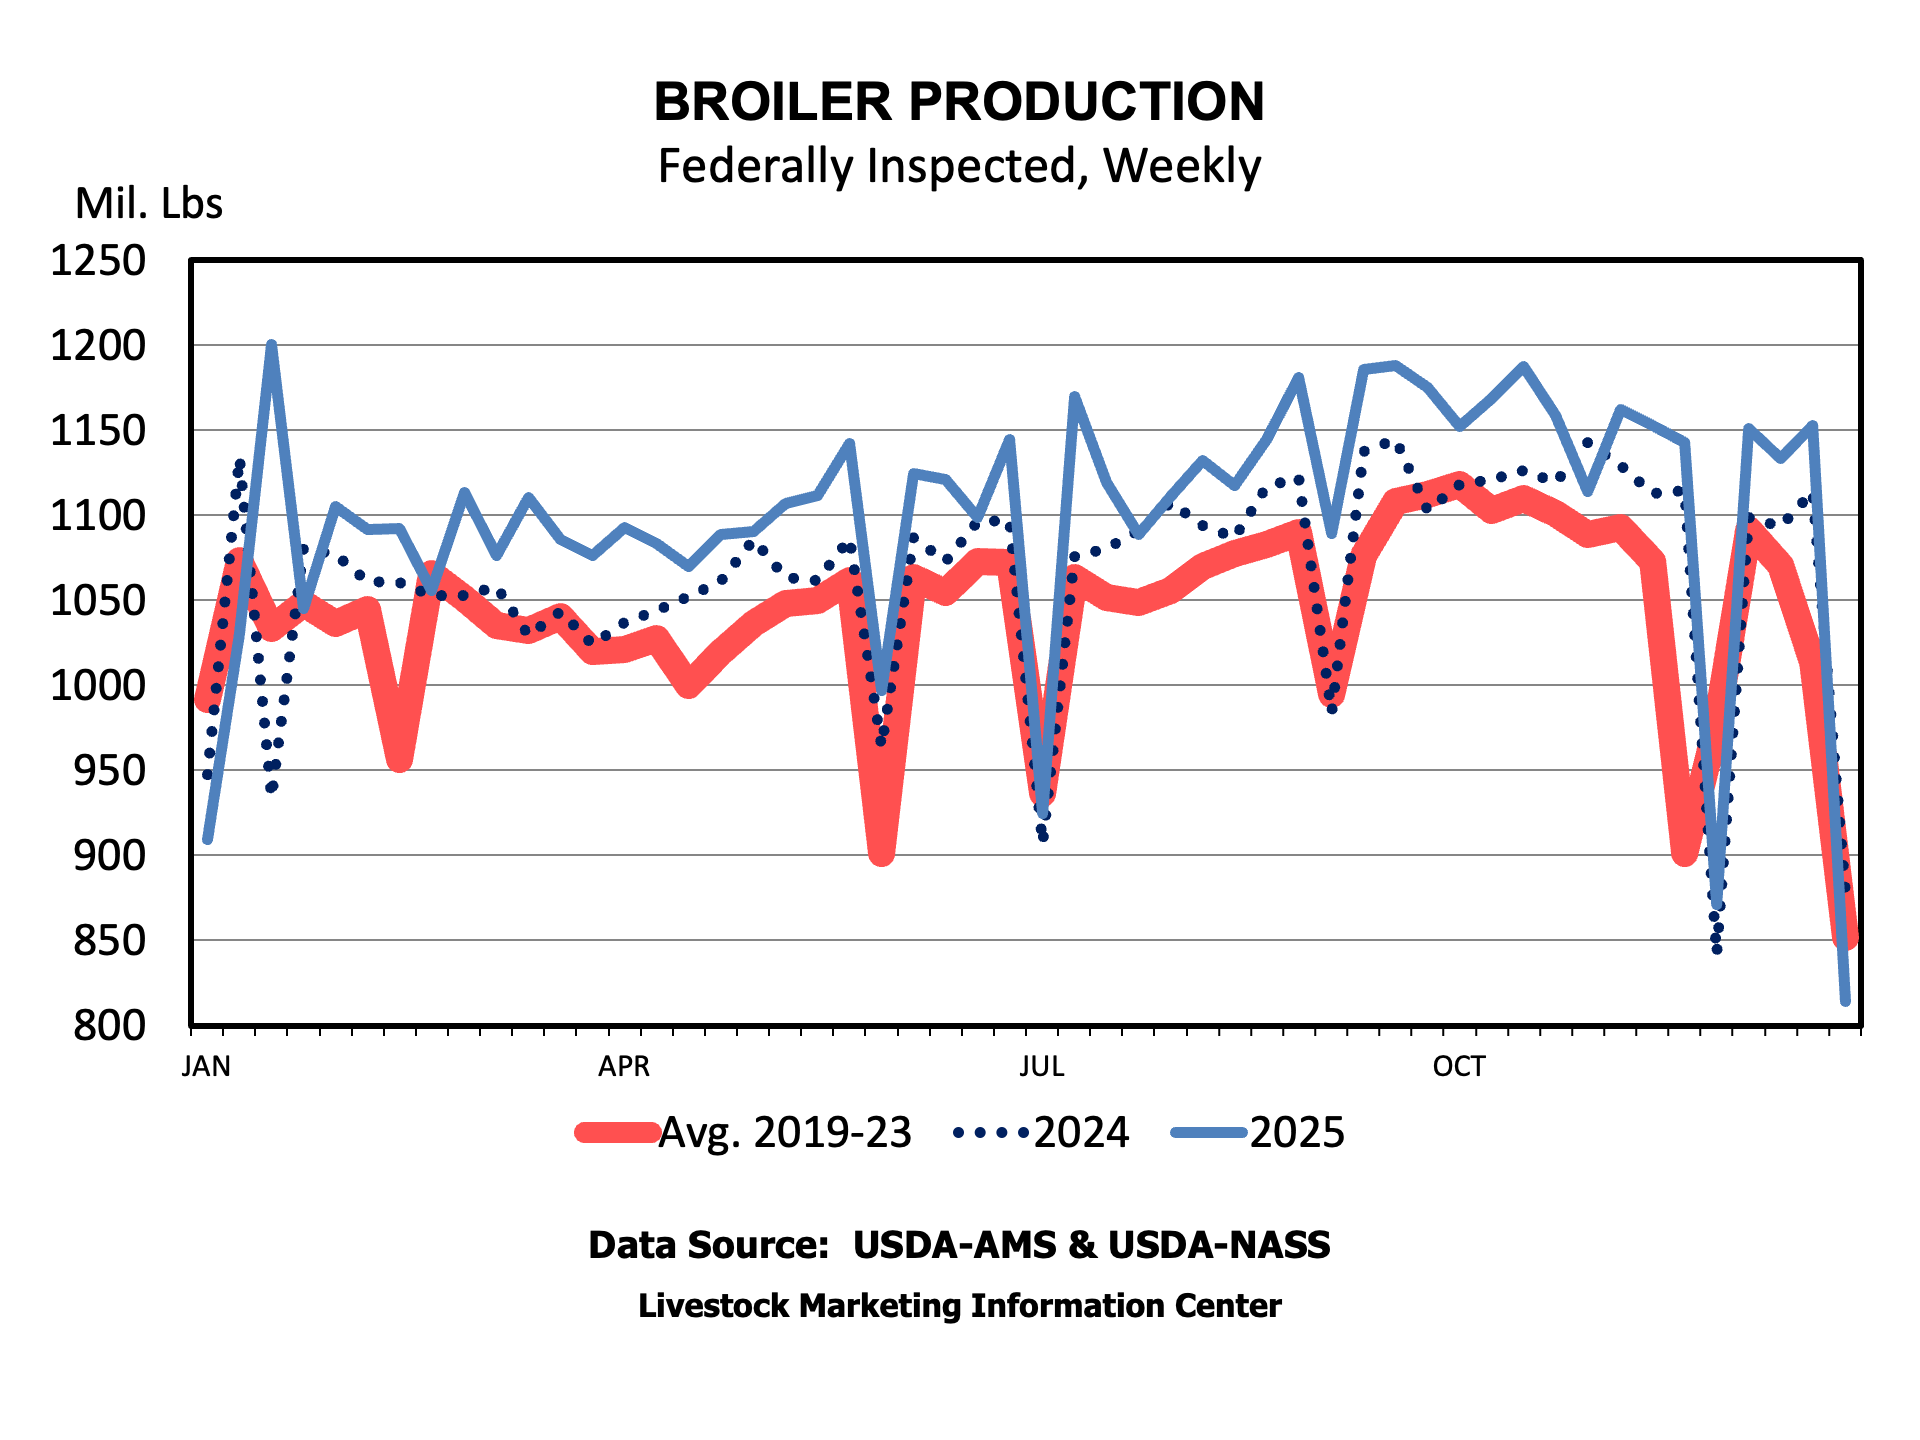
If the reader will forgive the obvious joke about what comes first, 1 percent more eggs for broiler grow-out were set in 2025 compared to 2024. That led to about 1 percent more chicks placed. A few more broilers made it from placement to slaughter, leading to broiler slaughter growing by 2.1 percent over the prior year. Combining more slaughter with 1.2 percent growth in weights generated a 3.3 percent increase in broiler production in 2025.
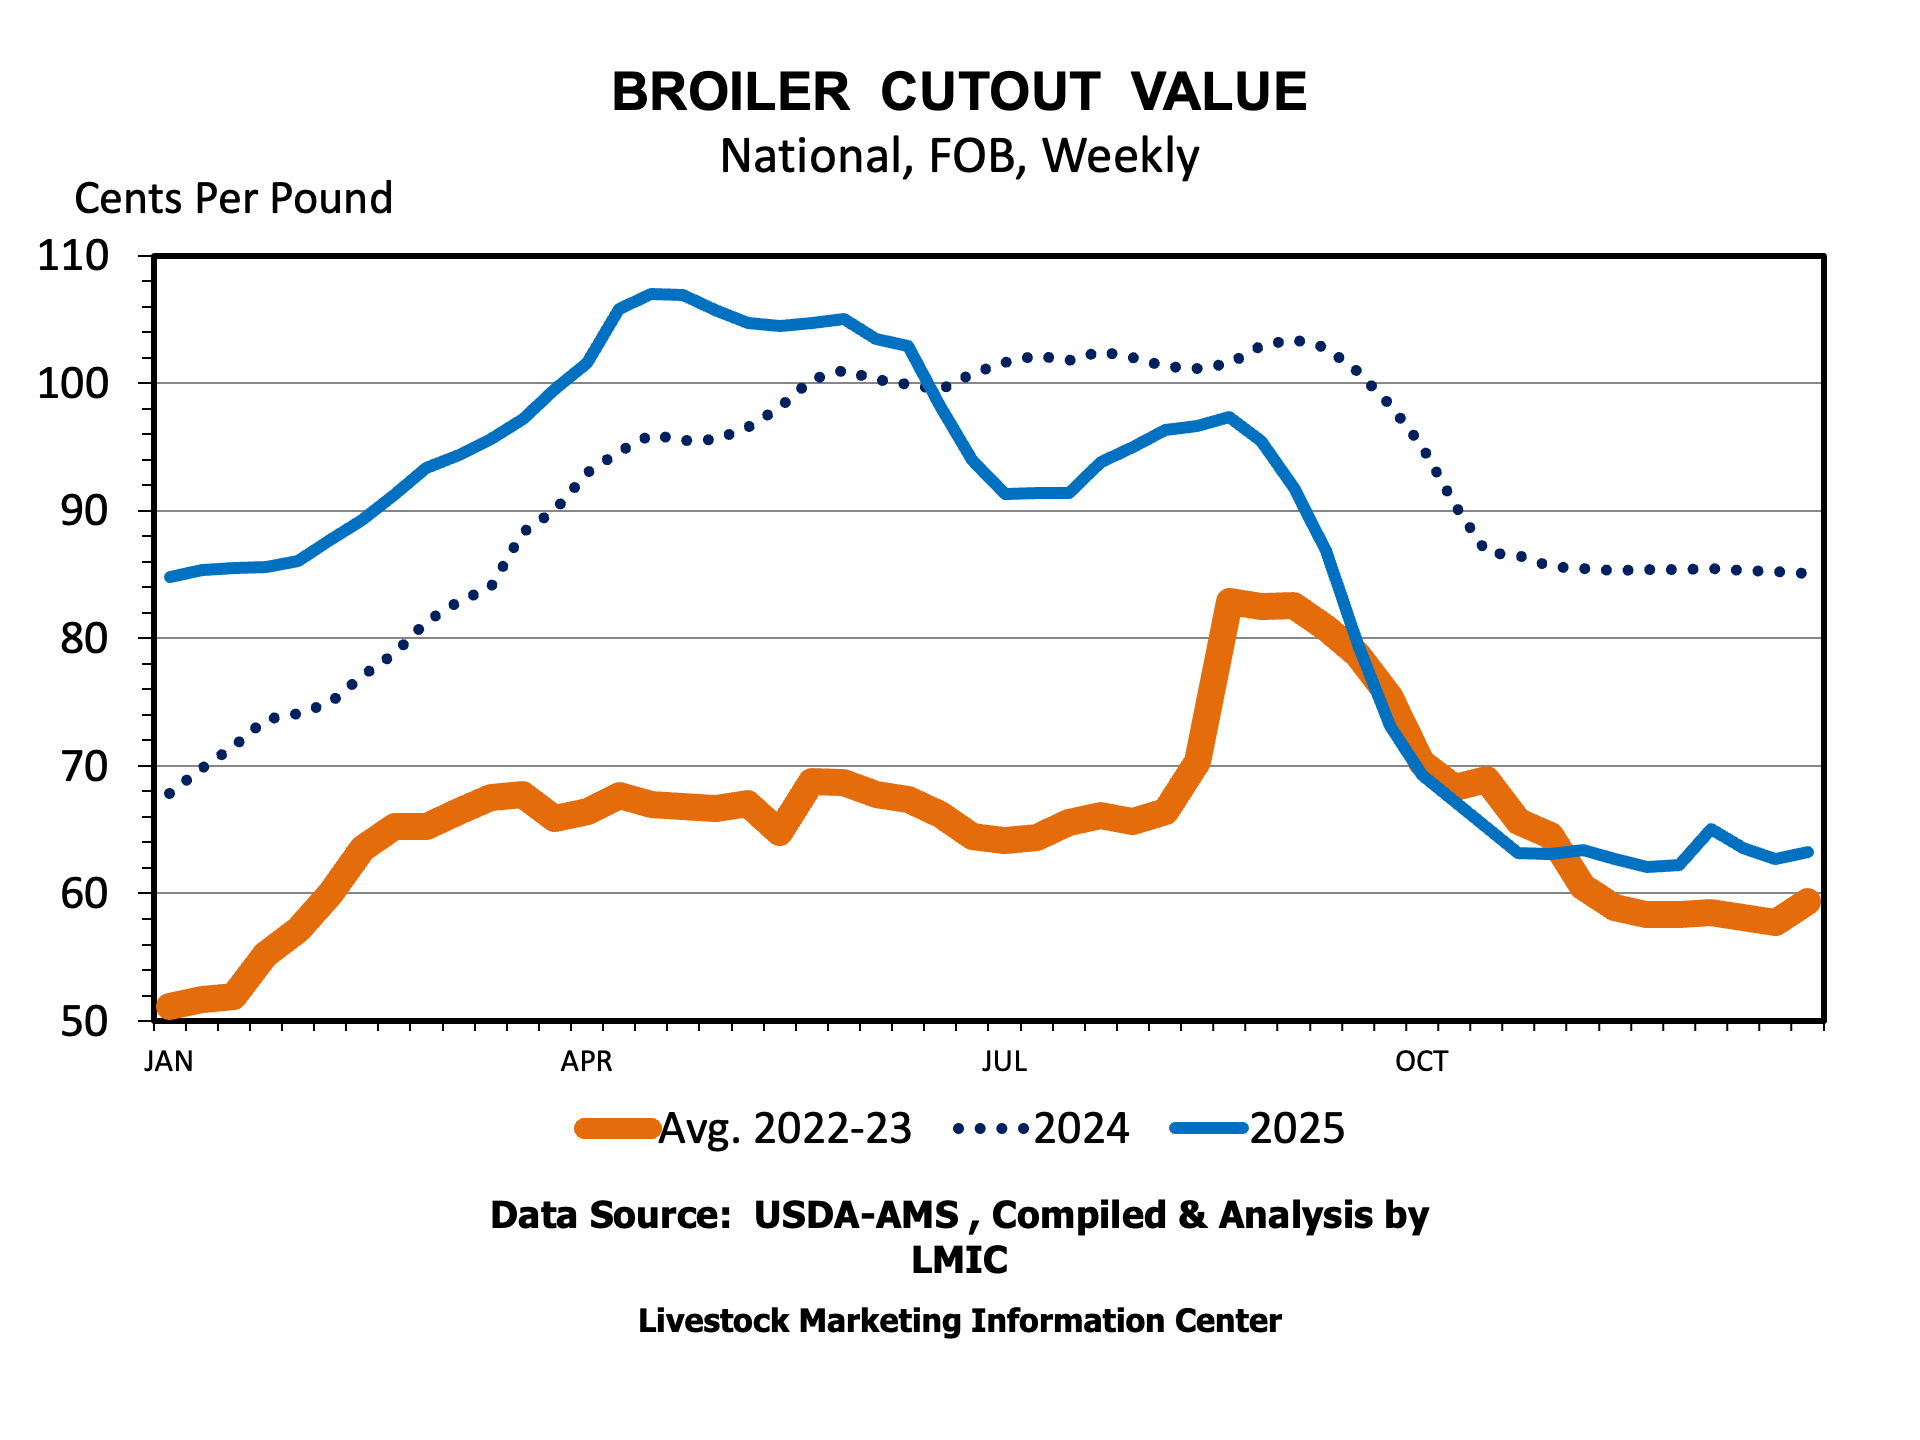
Increasing broiler production was jump started by profits from the combination of high broiler meat prices and falling feed costs. Broilers have a cutout value calculated, much like beef and pork. The broiler cutout value increased from $0.85 per pound in January 2025 to a peak of $1.07 per pound by May. The peak value was about 12 cents per pound higher than the same point the year before and 62 percent higher than the 5-year average for the same period. High prices in 2025 are built on higher price levels hit in 2024. The cutout dropped rapidly later in 2025. By the end of December, the cutout was down to $0.63 per pound.
The decline in the cutout value is shown in the wholesale cuts that make up the cutout value. Wholesale boneless, skinless breast meat has declined from a mid-year peak of $2.77 per pound to $1.16 per pound at the end of December, well below the almost $1.50 per pound the year before. Legs have declined from about $0.90 per pound to $0.59 per pound over the same period.
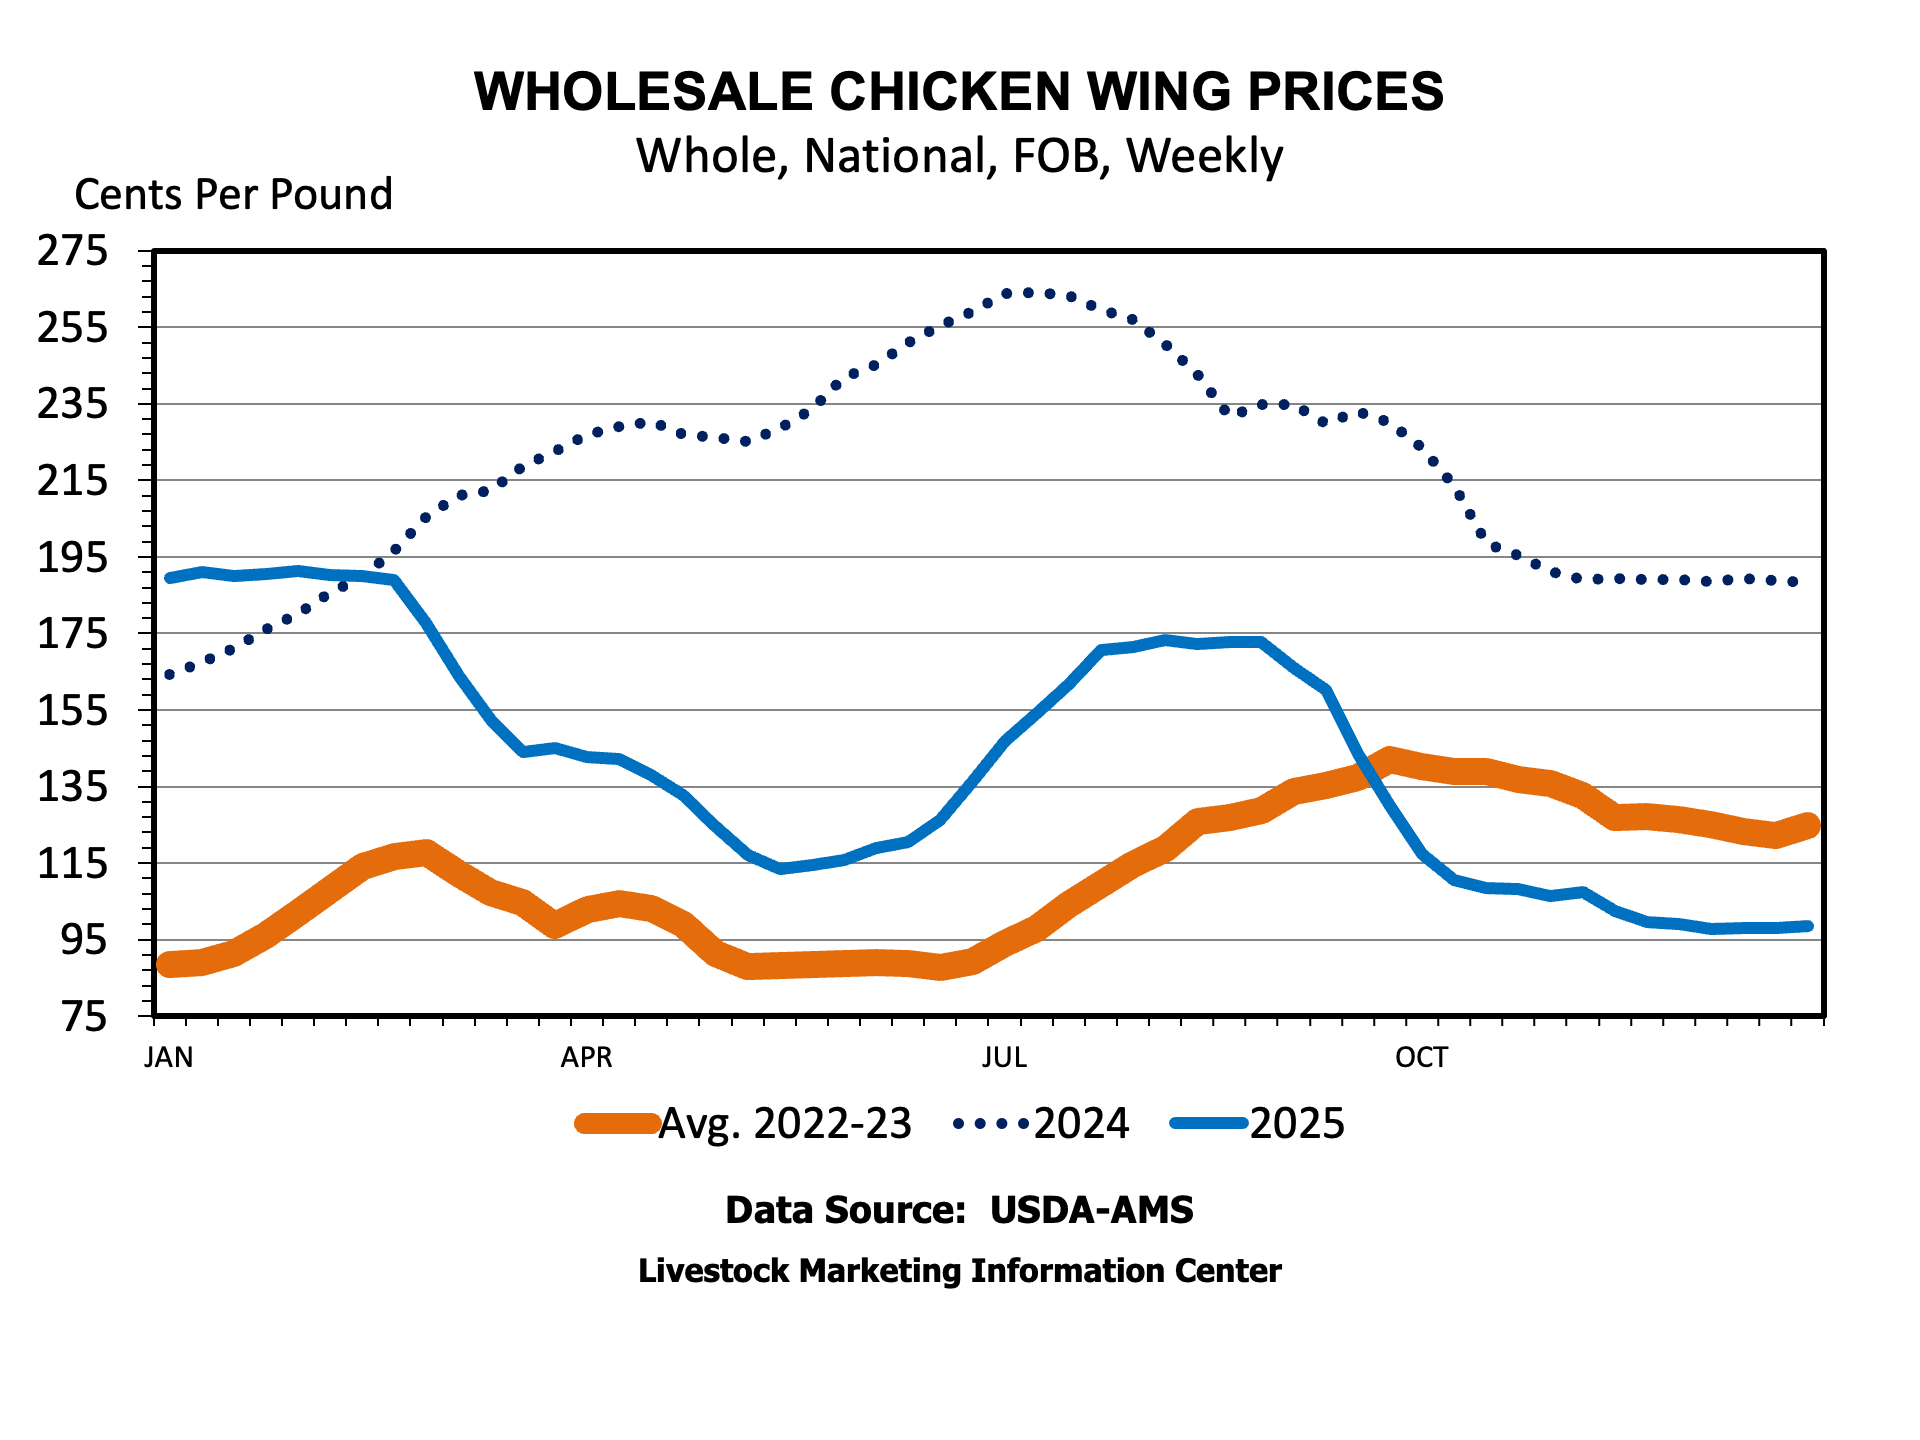
It’s playoff time for the NFL and for college football, and that usually leads to a discussion of chicken wings. It’s often noted that wholesale wing prices tend to increase leading up to the Super Bowl. In 2025, wing prices did increase leading up to the game, but they kept on climbing into mid-year, hitting a peak of $2.64 per pound. By the end of December, wholesale wings were down to $0.98 per pound, almost half the $1.88 per pound at the end of 2024 and lower than the 5-year average price of $1.24 per pound.
Several industry challenges are in place for 2026. The first is lower chicken meat prices, cutting into profits that would fuel more growth. HPAI continues to occur, recently hitting broiler farms and at least one broiler breeder facility. On the positive side, demand for chicken appears to be growing. The latest CPI report indicated that chicken prices declined compared to a year ago, making chicken even more affordable relative to beef. The number of eggs set and chicks placed in December 2025 were up 1.3 percent and 1 percent, respectively, compared to the year before. So, it looks like more broiler production is coming early in 2026.