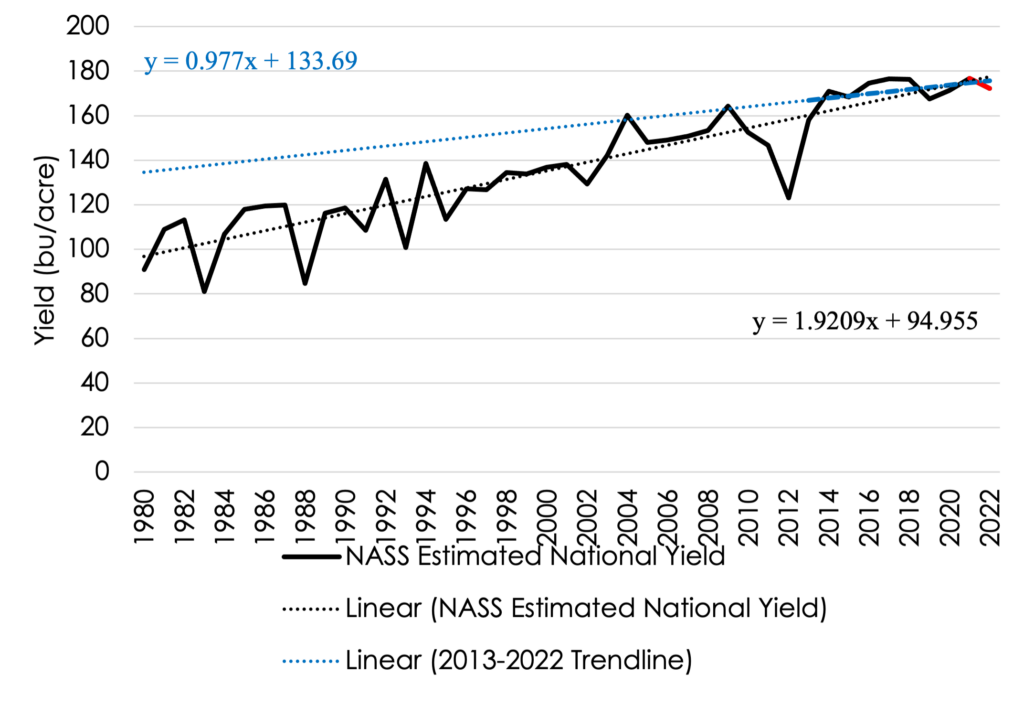
Producers face the challenge of when to sell or manage price risk during the growing season. Each growing season is different, but part of marketing and risk management is examining past data to improve the likelihood of making a decision that will increase the selling price received. Prices react to numerous factors. This article examines corn futures prices for years with above and below trendline national average yields. From 1980 to 2021, trendline yields have increased nearly two bushels per acre per year (Figure 1). In recent years, corn trendline yields have flattened, increasing less than one bushel per acre per year from 2013 to 2022. In general, actual national average yields above trendline indicate a mostly agreeable production year whereas below trendline yields indicate more widespread production challenges.
Figure 1. NASS Estimated National Average Corn Yield and Linear National Trendline Yield, 1980-2022.
What does trendline yield tell us about how corn futures prices react during and after the production year? Using the 1980-2021 trendline from 2010 to 2021, in years with annual estimated yields above trendline yields, December futures prices, on average, peak in May and June and decrease to a harvest low in September (Figure 2). In years with below trendline yields, the December futures price, on average, establishes a low in May / June before peaking in October (Figure 2). This time period coincides with when new crop production estimates, such as the USDA WASDE in May, are released. New crop estimates contribute to movements in the futures market as information is revealed and estimates are refined. Intuitively price movements in Figure 2 makes sense—lower yields contribute to prices increasing and higher yields contribute to declines in prices (all else being equal). Based on Figure 2, prices tend to break higher or lower in June / July, this is due to a greater likelihood of knowing whether the production year (or yield) has been mostly beneficial or has presented challenges to corn producers in the United States.
Figure 2. Monthly Average Daily Closing Price for the December Futures Contract in Years with Above and Below Trendline Yields, 2010-2021
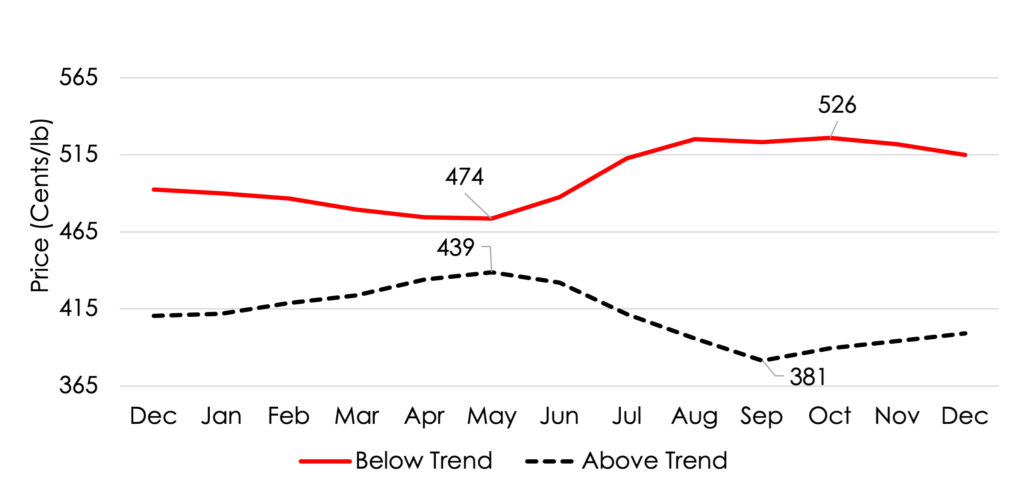
Data Source: Barchart
Moving outside of the preharvest through harvest interval, from 2010-2021, average March futures prices moved the same direction regardless of whether national average estimated yields were above or below trendline (Figure 3). On average, futures prices increased monthly from December through March. Years with below trendline yields had greater increases from December to March than years with above trendline yield.
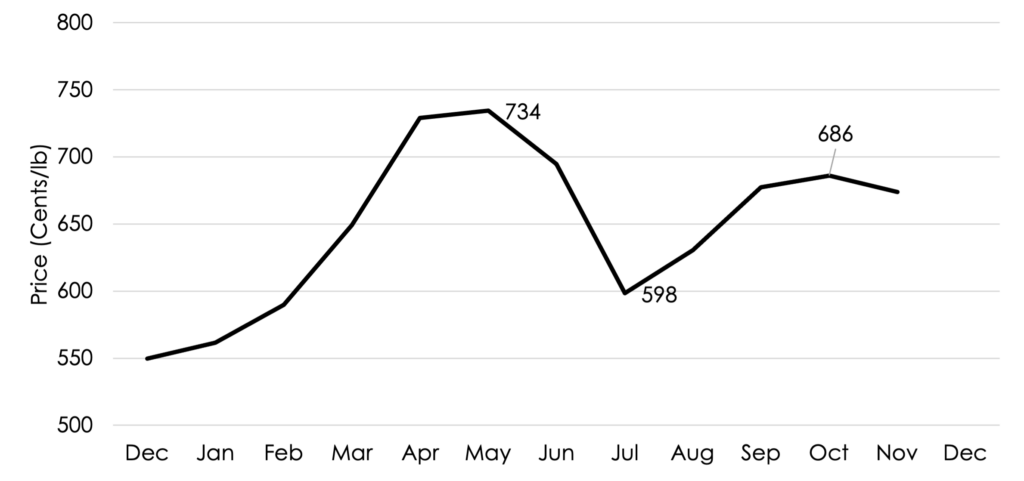
As mentioned above, all years are unique in the challenges that producers and markets face. So, how has 2022 compared to averages? Currently, USDA projects 2022 national average corn yield at 5.8 bushels per acre below the 1980-2021 trendline yield of 178.1 bushels per acre (2.4 bushels per acre below the 2013-2021 trendline). In 2022, monthly average closing prices for the December contract peaked in May, established a low in July before rebounding in the Fall (Figure 4). The spike in May can be partially attributed to the challenging start to the 2022 production year when national average planting progress was two to three weeks behind normal levels. The slow start to the corn production season combined with persistent drought later in the summer caused prices to rebound in the Fall. There are two key takeaways from this basic analysis: 1) producers need to be aware of factors affecting national yield (production) estimates and incorporate it in to price risk management decisions; and 2) while each year is unique, examining price trends for years with comparable yields can help inform producers’ decisions in corn futures markets.
Figure 3. Average Monthly Futures price for the March Contract from December to March following a production year with above or below trendline yield, 2010-2021 crop years
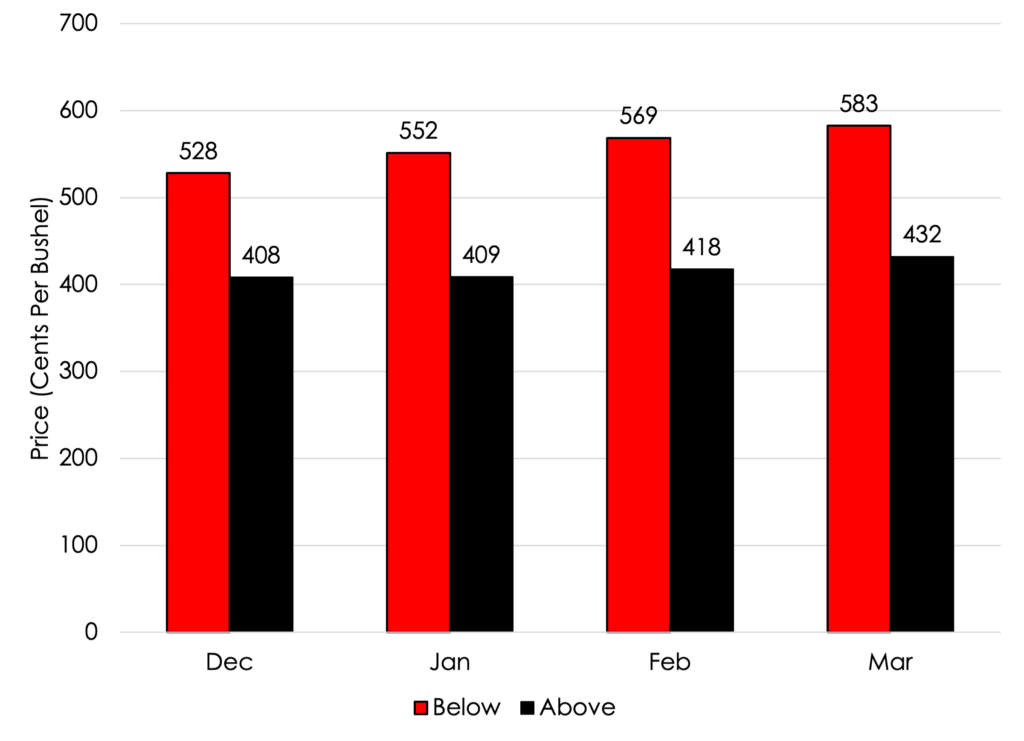
*Below trendline years included 2010, 2011, 2012, 2013, 2019, and 2020. Above trend line yields occurred in 2014, 2015, 2016, 2017, 2018, 2021.
Data Source: Barchart
Figure 4. Monthly Average Daily Closing Price for the December Futures Contract, 2022
Data Source: Barchart
References and Resources:
Barchart.com. December and March Corn Historical Daily Closing Prices. Accessed at: https://www.barchart.com/futures/quotes/ZCH23/historical-download
U.S. Department of Agriculture – National Agricultural Statistics Service (USDA-NASS). Quick Stats. Available on-line at: https://quickstats.nass.usda.gov/
Aaron Smith
Associate Professor, Crop Marketing Specialist
aaron.smith@utk.edu
Smith, Aaron. “What Does Trendline Yield Tell Us About How Corn Futures Prices React During and After the Production Year?” Southern Ag Today 2(48.1). November 21, 2022. Permalink