Blog

  • Financial Ratios to Consider for Measuring Financial Resiliency of Your Farm

    Financial Ratios to Consider for Measuring Financial Resiliency of Your Farm

    How can you recognize warning signs indicating financial distress on your farm? Although many farm proprietors and managers have a solid grasp of their farm business’s profit dynamics, they frequently overlook the critical aspect of assessing financial resilience. The financial resilience of a business can be gauged by examining liquidity and solvency ratios. In fact, a majority of agricultural lenders, including commercial banks and institutions within the farm credit system, actively consider these ratios as part of their evaluation during the farm loan approval process.

    To compute these ratios, you should initially create financial statements, such as the balance sheet and income statement. While the manager and/or owner might not be the ones directly creating these statements, it’s crucial for them to comprehend the insights these statements offer regarding the business’s financial health and ways to enhance weak financial performance. Emphasizing the importance of maintaining accurate records and regularly producing these statements is strongly recommended, as they prove beneficial during tax filings, loan applications, and gaining insights into the current financial status of the business.

    Liquidity

    Liquidity metrics assess a debtor’s capability to settle existing debt commitments without seeking external funding. These metrics are primarily derived from components of the balance sheet’s current assets and current liabilities. Current assets comprise assets easily converted into cash, like cash, bank accounts, investments, and inventories. Current liabilities consist of obligations due within a year, such as accounts payable, production loans, and current portions of noncurrent debt. The most commonly employed liquidity metric is the current ratio, expressed as:

    Current Ratio = Current Assets/Current Liabilities

    A higher liquidity ratio indicates that the dollar value of current assets surpasses the value of short-term debt obligations, which is favorable.

    Solvency

    While liquidity ratios focus on the present timeframe, solvency ratios assess a farm business’s capacity to cover all liabilities with its total assets. Unlike liquidity ratios, it is necessary to consider the dollar values of both long-term and short-term assets and liabilities on the balance sheet. This includes the dollar value of farmland (a long-term asset) and farmland loans (a long-term liability), which often represent a significant portion of a farm’s balance sheet. The most widely utilized solvency metric is the debt-to-asset ratio, expressed as:

    Debt to Asset Ratio = Total Liabilities/Total Assets

    In contrast to the current ratio, one must divide the dollar value of total liabilities (financial obligations) by the dollar value of total assets. A high debt-to-asset ratio may indicate insolvency, signaling that the value of total liabilities surpasses total assets.

    Compare Your Numbers with Benchmarks

    The Farm Financial Standards Council (FFSC) establishes benchmarks for these ratios, which are periodically updated, although not significantly. According to the FFSC, it is considered favorable to have a current ratio exceeding 2 and a debt-to-asset ratio lower than 0.6. It is highly recommended that farmers and ranchers assess their liquidity and solvency measures against these benchmarks and take corrective measures if their figures fall short. These can be done through, but not limited to, selling of farm assets that are not in use, raising equity capital through ownership restructuring, and renegotiating on long-term debt. 

    Additionally, it is wise to compare these numbers with national, regional, and specialty-specific averages, as some lenders may evaluate an applicant’s information in relation to other peer groups when deciding on approvals. Individuals can compare their figures with peers based on specialty, region, size, and age group using the USDA Economic Research Service’s report, accessible through the following link: https://my.data.ers.usda.gov/arms/tailored-reports

    Also, it is a good idea to keep track of these ratios over time, to see whether the financial resiliency of one’s business is improving or deteriorating. 


    Kim, Kevin, and Brian E. Mills. “Financial Ratios to Consider for Measuring Financial Resiliency of Your Farm.” Southern Ag Today 4(2.3). January 10, 2024. Permalink
  • More Pigs

    More Pigs

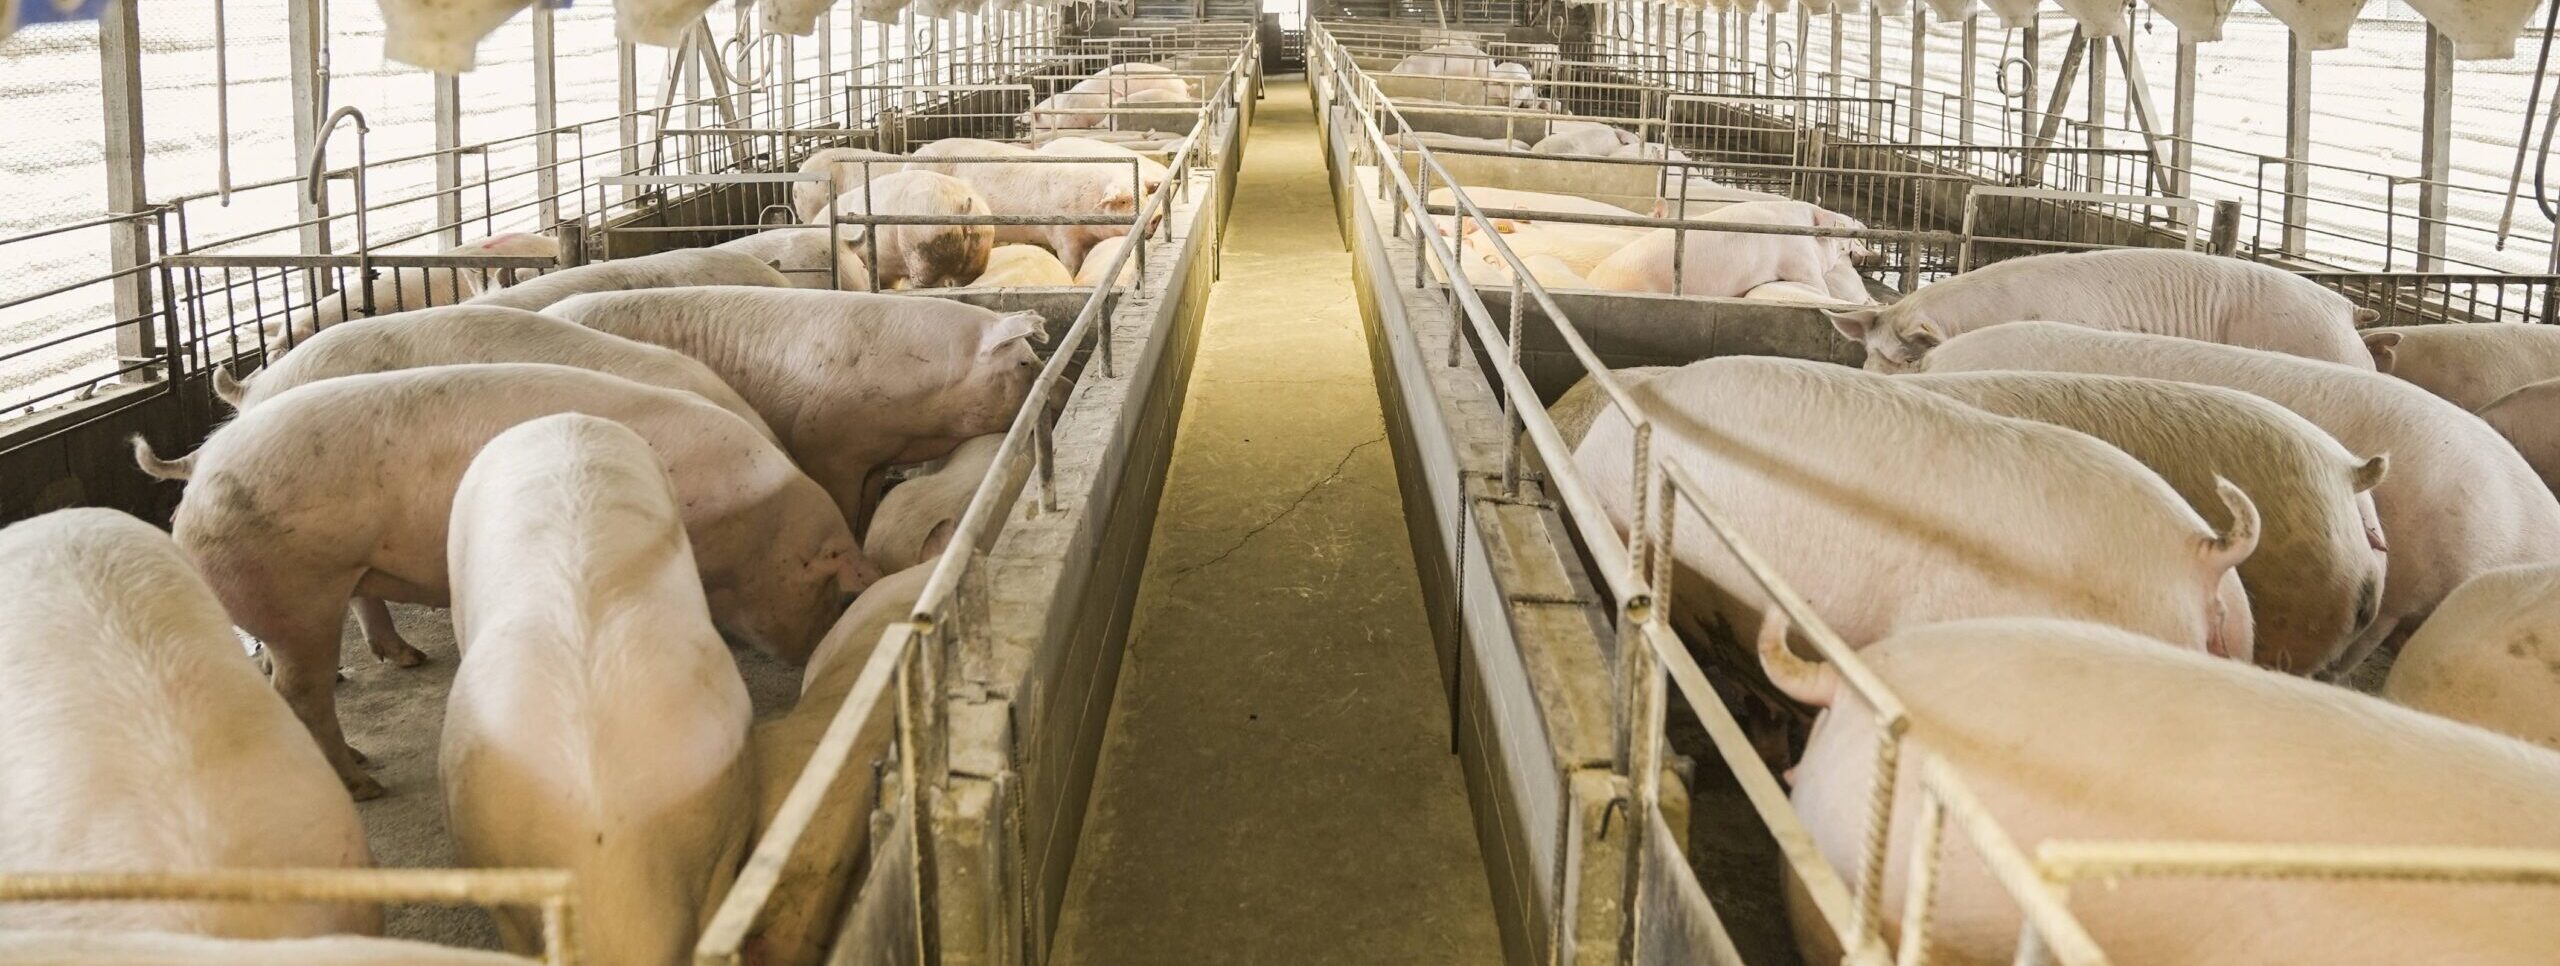
    USDA released its Hogs and Pigs report at the end of December.  In addition to breeding and market hog inventories and farrowing intentions for early 2024 the report includes data on pigs per litter and litters per breeding animal.  The pork industry has experienced tremendous productivity gains over the last several decades.  Among those gains are nutrition and genetics, feed efficiency, dressed weights, but also those related to the sow productivity, like litters per year and pigs per litter.  Last week’s SAT mentioned dressed weights as a source of beef production efficiency gains.  This week’s will examine pigs per litter and its contribution to production and prices for the coming year.  

    In 1998, the average litter of pigs included 8.7 pigs.  A boom in productivity followed with the latest Hogs and Pigs report indicating pigs per litter at 11.7 pigs.  The rapid growth through the early 2010’s was halted by porcine epidemic diarrhea virus (PEDv) that cut pigs per litter by about 0.75 head, or 7.6 percent.  Growth began again after the worst effects of PEDv passed but at a lower plane for several years.  Pig per litter growth remained fairly flat from about 2019 through 2022 but, jumped rapidly in 2023.  A variety of disease factors combined to limit growth but as those pressures have lessened pigs per litter has spiked higher.

    So, what does this mean for the hog market over the next few months?  Estimated farrow-to-finish returns have been mired in large losses for 10 of the last 12 months.  In fact, hog producers have been losing money and reducing herds worldwide for some months.  The U.S. breeding herd was estimated to be 5.999 million head, the fewest since December 1, 2014.  Farrowing intentions for the December through May period are expected to be the fewest since 2015.  But, the increase in pigs per litter is large enough to keep projected commercial hog slaughter and pork production above a year ago in 2024.  More pork production will keep the pressure on hog prices and may limit upside potential.

    Anderson, David. “More Pigs.” Southern Ag Today 4(2.2). January 9, 2024. Permalink

  • Peanut Cost of Production, the Farm Bill, and Need for Risk Management

    Peanut Cost of Production, the Farm Bill, and Need for Risk Management

    Marketing peanuts can be challenging for producers due to the lack of a futures market and relatively concentrated first buyers. This makes it even more important for producers to evaluate their cost of production to help control input costs and make strategic risk management decisions. 

    According to the USDA Commodity Cost and Returns for peanuts, the cost of production increased in 2022 and has stayed at this new higher level, much like other commodities. Figure 1 shows the 2024 forecasted operating cost of production at $336/ton. This covers such items as seed, chemicals, fuel, repairs, and interest. Meanwhile, allocated overhead includes general farm expenses that are allocated to the peanut operation, such as labor, the cost of machinery, and the opportunity cost of land. When including allocated overhead, the total cost of production is forecasted for 2024 at $598/ton, a 28% increase from 2014. These costs are slightly lower than the $648/ton total cost peak forecasted for 2023, but nowhere near the levels seen in earlier years.

    Source: Calculated using annual yields and costs of production from USDA Economic Research Service Commodity Costs and Returns, November 2023.  2023 yields are based on November USDA estimates.  2024 yields are an average of the previous five years.

    In a Southern Ag Today article on December 4, 2023, it was shown that peanut prices are continuing to rise since the low in 2015. It was noted that the USDA expects prices to be about $550/ton for the 2023-2024 marketing year. This is still below the cost of production shown above. 

    The farm bill provides for a safety net for peanut producers with base acres through the ARC/PLC and Marketing Loan programs. These programs have statutory price levels that have not changed since the 2014 Farm Bill. For the PLC program, the statutory reference price is $535/ton. While the 2018 Farm Bill allowed for an escalation through the Effective Reference Price, that has not triggered for peanuts. Meanwhile, the Marketing Loan has been set at a rate of $355/ton. This does not provide a safety net at these higher cost levels. 

    While Congress continues to debate the next farm bill, producers need to look at alternative marketing strategies and other ways to help mitigate the rising costs of growing peanuts. Cross hedging is a popular marketing strategy used to mitigate risk, but there is little empirical evidence that it is effective for peanuts. That leaves contracting, cost control, and crop insurance as the most viable risk management tools for peanut producers.


    Rabinowitz, Adam. “Peanut Cost of Production, the Farm Bill, and Need for Risk Management.Southern Ag Today 4(2.1). January 8, 2024. Permalink

  • Citrus Greening, Hurricanes, and the Decline of the Florida Citrus Industry

    Citrus Greening, Hurricanes, and the Decline of the Florida Citrus Industry

    Citrus greening, also known as Huanglongbing (HLB), is a plant disease affecting citrus production. Citrus greening is caused by the bacterium Candidatus Liberibacter asiaticus and spread by the Asian citrus psyllid. This disease affects plant tissue, specifically the phloem, and reduces nutrient uptake (Burrow et al. 2018). 

    In the United States, citrus greening was first observed in South Florida’s non-commercial citrus in August 2005. By February 2010, citrus greening had spread throughout the traditional citrus areas of the state: Central Florida, Southwest Florida, and Indian River. Elsewhere in the U.S., citrus greening was detected in Louisiana in 2008, and then detected in Georgia and South Carolina in 2009. In 2012, HLB was detected in Texas and residential areas of California (APHIS 2022). 

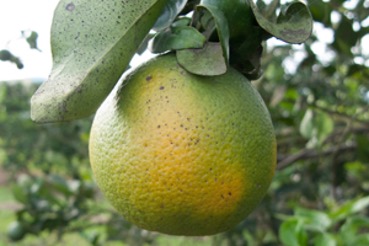
    The economic effects of citrus greening on commercial citrus production manifest in three primary ways. First, the disease increases the mortality rate of citrus trees. Second, symptoms reduce the marketable yield per tree by affecting the quantity, size, visual attributes, and flavor of the fruit (Figure 1). Third, greening increases production costs as growers implement practices such as applying additional insecticides and fertilizer to mitigate damage from greening (Dewdney, Vashisth, and Diepenbrock 2023).

    Florida citrus production has significantly decreased since the introduction of greening. In the last 20 years, Florida citrus production has declined from nearly 300 million boxes in the 2003-04 season to under 20 million boxes in the 2022-23 season (Figure 2). The United States Department of Agriculture’s Animal and Plant Health Inspection Service (2022) estimates that citrus greening has reduced Florida citrus production by 75% and more than doubled production costs. Further, consumer demand for citrus products has decreased during this period, import competition has increased, and major hurricanes have markedly reduced citrus production (Blazejczyk 2020). 

    In the 2004-05 season, citrus-producing regions of the state were impacted by four hurricanes within a six-week span, devastating citrus production (Albrigo, et al. 2005). Citrus losses from Hurricane Irma in 2017-18 season were estimated to be $490 million (Hodges et al. 2018). More recently, citrus losses from Hurricane Ian in 2022-23 season were estimated to be $247 million (Court et al. 2023). These hurricanes significantly reduced citrus production (Figure 2).

    The sharp declines in citrus production due to hurricanes combined with falling citrus yields due to citrus greening have greatly diminished the size of the Florida citrus industry since the detection of citrus greening in 2005 (APHIS 2022). Major orange juice brands that once sourced exclusively from Florida now blend their juice with imports from Mexico and Brazil (Figure 3) (Bohman 2023). Nevertheless, researchers and growers continue to seek solutions to bring back the Florida citrus industry. There has been extensive research into nutritional supplements, reflective mulch, heat treatments, insecticides, and bactericides to combat the disease. Researchers are also attempting to breed a greening resistant tree, and some citrus growers have taken the prevention route by growing their citrus under protective screens (Florida Department of Citrus 2017). However, implementing these practices requires significant financial investment, meaning a low-cost comprehensive solution to the problem of greening does not yet exist.

    Figure 1: Photo of citrus fruit infected with citrus greening

    Source: APHIS (2022)

    Figure 2: Florida Citrus Production, Boxes (2001-23)

    Disclaimer

    The findings and conclusions in this publication are those of the authors and should not be construed to represent any official USDA or U.S. government determination policy.


    References

    Albrigo, L G, R S Buker, J K Burn, W S Castle, S Futch, C W McCoy, R P Muraro, et al. 2005. “The impact of four hurricanes in 2004 on the Florida citrus industry: Experiences and lessons learned.” Proceedings of the Florida State Horticultural Society 118: 66-74.

    Animal and Plant Health Inspection Service. 2022. Citrus Greening. United States Department of Agriculture. https://www.aphis.usda.gov/aphis/ourfocus/planthealth/plant-pest-and-disease-programs/pests-and-diseases/citrus/citrus-greening.

    Blazejczyk, A. 2020. Citrus Fruits Accounted for 14 Percent of Fresh Fruits Available for Americans to Eat in 2018.Amber Waves, Economic Research Service, United States Department of Agriculture. https://www.ers.usda.gov/amber-waves/2020/august/citrus-fruits-accounted-for-14-percent-of-fresh-fruits-available-for-americans-to-eat-in-2018/.

    Bohman, D. 2023. Orange juice brands no longer making juice from 100% Florida-grown oranges. WPTV, Scripps Media, Inc. https://www.wptv.com/news/region-indian-river-county/vero-beach/orange-juice-brands-no-longer-making-juice-from-100-florida-grown-oranges#:~:text=Then%20in%20May%202022%2C%20Florida’s,outside%20of%20the%20Sunshine%20State.

    Burrow, J D, M M Dewdney, T Vashisth, and L M Diepenbrock. 2108. Citrus Greening (Huanglongbing): A Serious Threat to the Florida Citrus Industry. https://edis.ifas.ufl.edu/publication/CH198.

    Court, C D, X Qiao, B B Saha, F He, and K McDaid. 2023. Estimated Agricultural Losses Resulting from Hurricane Ian.Economic Impact Analysis Program, Food and Resource Economics Department, Institute of Food and Agricultural Sciences, University of Florida. https://fred.ifas.ufl.edu/media/fredifasufledu/economic-impact-analysis/reports/FRE-Final-Hurricane-Ian-Report.pdf.

    Dewdney, M M, T Vashisth, and L M Diepenbrock. 2023. 2023–2024 Florida Citrus Production Guide: Huanglongbing (Citrus Greening). https://edis.ifas.ufl.edu/publication/CG086.

    Florida Department of Citrus. 2017. “Potential Citrus Greening Solutions.” https://www.floridacitrus.org/grower/fdoc-citrus-411/potential-citrus-greening-solutions/.

    Florida’s Natural. 2023. Our Family of Juices. https://floridasnatural.com/our-juices/orange-juices.

    Hodges, A W, C D Court, R L Clouser, J J Vansickle, and S E Stefanou. 2018. Economic Losses of Hurricane Irma on Agriculture. Economic Impact Analysis Program, Food and Resource Economics Department, Institute of Food and Agricultural Sciences, University of Florida. https://fred.ifas.ufl.edu/destudio/t4/pdf/Economic%20Losses%20of%20Hurricane%20Irma%20on%20ag%20in%20Florida%20counties%2010-26-2018.pdf.

    National Agricultural Statistics Service. 2023. Citrus Summary Reports, 2001-2023. United States Department of Agriculture. https://www.nass.usda.gov/Statistics_by_State/Florida/Publications/Citrus/index.php.


  • Shouldn’t the Farm Safety Net Target Those Feeding the Country?

    Shouldn’t the Farm Safety Net Target Those Feeding the Country?

    In remarks during a March 16, 2023, hearing before the Senate Committee on Agriculture, Nutrition, and Forestry, Secretary Vilsack testified that while “our policies have ensured an increasingly abundant food supply, growth in farm size and consolidation has put extreme economic pressure on small and medium sized farms and our rural communities…. We must ask ourselves: do we want a system that continues to force the big to get bigger and the small and underserved to get out or do we want a build a more innovative system?”

    The United States has grappled with this small-farm versus large-farm debate for decades.

    While many claim that the safety net is targeted toward large farms, it should be noted that (1) the safety net is provided to producers on a per-acre basis regardless of size and (2) Congress has invested a significant amount of resources in helping small, beginning, socially disadvantaged, limited resource, and veteran producers get started in production agriculture. Congress has also significantly curtailed access to the farm safety net for larger farm operations via means testing, actively engaged determinations, and payment limits.

    The U.S. has been on this path of fewer but larger farms since the beginning of the last century.  Data from the 1920 Census indicated there were 6,448,343 farms with an average farm size of 148.2 acres.[1]  According to the 2017 Census of Agriculture, in 2017 there were 2,042,220 farms with an average farm size of 441 acres.[2]  Not only has average farm size been growing, it is also resulting in a shift in the composition of farms.  Figure 1 illustrates that about one-half of U.S. production comes from large-scale family farms that only make up 3.2 percent of farms, versus 94.7 percent (small and moderate size farms) accounting for 26.2 percent of production.  The USDA Economic Research Service (ERS) also noted that small-scale operators depend on off-farm income while large-scale farms derive almost all of their income from the farm. 

    These results have significant policy implications: namely, who is the farm bill – and the farm safety net in particular – intended to benefit?  Washington think tanks argue that Title I benefits in the farm bill should be redirected to smaller farms. This ignores economic reality on the ground, where full-time family operations are putting enormous amounts of capital at risk. We applaud Congress for continuing to focus on full-time family producers who are actually trying to make a living from their operation – all while doing the most to feed the country. 

    Figure 1. Median income of farm households, by income source and farm type, 2021.


    This paper summarizes the farm size part of a paper by these authors entitled “Examining Farm Size & Payment Limits” commissioned by the Southwest Council of Agribusiness.

    [1] 1920 Census of Agriculture. Accessed at h#ps://agcensus.library.cornell.edu/census_year/1920-census/

    [2] 2017 Census of Agriculture. Accessed at

    https://www.nass.usda.gov/PublicaKons/AgCensus/2017/Full_Report/Volume_1,_Chapter_1_US/usv1.pdf


    Outlaw, Joe, and Bart L. Fischer. “Shouldn’t the Farm Safety Net Target Those Feeding the Country?Southern Ag Today 4(1.4). January 4, 2024. Permalink