Blog

  • What Should I Do With My Heifers?

    What Should I Do With My Heifers?

    A common question asked each year by cattle producers is, “What should I do with my heifers? Should I raise them as replacements or sell them as weaned heifers?” This question is especially relevant in today’s market of high prices and the inevitability that expansion will have to start at some point. The answer involves penciling out the expenses and deciding which option best suits an operation in the current market. Costs of developing heifers include the current value of weaned heifers (opportunity cost), variable expenses, breeding costs, fixed expenses, and absorption costs. The Replacement Heifer Calculator discussed in this article aims to serve as a guide in organizing each of these costs and can be used as an estimation tool to calculate what it may cost to develop heifers on a specific operation and if it is economical to do so.  The calculator includes several key cost concepts, including:

    1. The opportunity cost of selling weaned heifers must be recognized. “What revenue will be forfeited if I decide to raise these heifers rather than selling them now?” Understanding the opportunity costs allows for comparisons at the end of the estimation process to see which option is the most economical for an operation. 
    2. Variable expenses (feed, medications, and pasture management) and fixed expenses (land rent, labor, and interest) are important for calculating what each heifer needs so that she will be 60-65% of her mature body weight at the time of breeding. A way to remember what costs will go into these sections is to ask: “What is needed for the health and nutrition of the heifer?” Variable expenses will vary across operations and from year to year due to fluctuating input costs. Fixed costs should remain roughly the same year to year but will vary across different operations. Interest is included to account for the time between the opportunity to sell them as weaned heifers until they are developed. 
    3. Breeding costs are just that: “What is it going to cost to breed each heifer?” Whether you are using bulls or artificial insemination (AI), there are costs associated with both. Using natural service involves the costs of purchasing and maintaining the bull or bulls. Annual cost is determined using the following formula: ((purchase cost – useful years in the herd)/value at culling). A bull’s maintenance cost is his total variable costs, similar to a heifer’s variable cost: “What are the costs associated with maintaining the health of a bull?” The annual bull cost plus the maintenance cost divided by the number of heifers he will be expected to breed is his total cost. This total cost is then multiplied by the number of bulls needed, and then divided by total number of heifers to calculate the breeding cost of each heifer.
    4. Absorption costs represent the cost of developing open heifers.  These costs are absorbed by the bred heifers that remain in the operation.  However, absorbed costs can be offset by the revenue from selling those developed, open heifers. The cost to develop all heifers is multiplied by the number of open heifers and then divided by the number of bred heifers to assign additional development cost to each bred heifer (cost absorbed). The revenue received by the sale of open heifers is then divided by the number of bred heifers to offset the additional development cost (revenue absorbed). All totals from each section can now be summed to estimate the cost of developing heifers. 

    As an example, current prices for weaned heifers in Florida have been well above $2.00 per lb. since April 2023 and are continuing to rise. Prices for replacement cattle, open or bred, can be expected to follow the same trend in Florida as the demand for and value of replacement cattle increases when expansion begins to occur. Understanding the full cost to develop heifers allows you to compare that cost to selling heifers at weaning and buying bred replacements.  If the price of bred heifers is greater than the total cost to develop bred heifers, a potentially profitable investment has been made in your heifers. Of course, also important to the decision is your strategy for genetic development, which must be weighed against the value of weaned heifers, development costs, and the cost of purchased replacements. These decisions are all about the goals and risk management strategies of each operation. According to the example in Table 1, the total cost to develop 100 heifers is $172,250 or $1,722.5/hd.  However, after considering the revenue of selling 10 open culls, the net development cost is reduced to a total of $150,650 or $1,673.89/hd for each of the remaining 90 bred heifers. The current value of young, bred replacement cattle with an average weight of 1,100 pounds is $1.54 per lb. or roughly $1,700/hd in Florida. Using the results of the example, you would save approximately $27/hd or a total of $2,430 if you raised your replacements (90) rather than buying them. Even though the price you would have received for selling weaned heifers is higher than the cost of development, the long-term outcome in this scenario suggests that the cost of development was worth the investment. With the value of female cattle expected to rise in the coming months due to inevitable expansion, raising your own replacements to rebuild your herd may be a more economical decision. Expenses can be overwhelming when looked at as a short-term lump sum. So, it is important to look at them as long-term investments when possible. To download the Replacement Heifer Cost Estimation Tool click here. The file will be located under ‘calculators’. 

    Table 1. Raising Replacement Heifers in Florida


    Baker, Hannah. “What Should I Do With My Heifers?Southern Ag Today 4(1.3). January 3, 2024. Permalink
  • Weight Gain

    Weight Gain

    The title of this article is not meant to incite regret over our holiday excesses but, instead, to take a look at cattle dressed weights in late 2023 that set new record highs.  Heavier weights contributed to more beef production than expected helping to pressure prices late in the year.  

    Fed cattle weights have a distinct seasonal pattern through the year.  They usually hit their seasonal lows in May-June and their highs late in the year.  Days on feed, placement weights, weather, and prices all effect dressed weights.  Dressed weights were below 2022 until early May contributing to some tighter beef supplies.  Steer dressed weights climbed seasonally, about equal to the year before until late in the year when they climbed to a record 940 pounds.  The increase in steer dressed weights contributed an additional more than 3 million pounds of beef per week in November and December.  

    Record high dressed weights should not be a surprise to long-term participants in the cattle market.  The steady growth in weights over time has been one of the remarkable achievements in productivity growth of the industry.  In 1964, steer dressed weights averaged 662 pounds per head.  In 2023, steer dressed weights were an estimated 907 pounds per head.  Weights in 2022 hit an annual record high of 910 pounds.  The 3 pound annual decline in 2023 is largely due to lower weights in early 2023.  Bigger cattle, feeding efficiency gains, and economics have driven this long-term trend of heavier weights.

    What’s to come in 2024?  We should expect the seasonal pattern to continue.  But, the seasonal pattern will be impacted by days on feed.  We entered December 2023 with more cattle on feed over 120 days than the year before, likely meaning some heavier weights are ahead at least early in the year.  Lower feed costs than the year before implies some heavier weights.  Winter weather will be important in coming months.  A series of severe storms would pull down weights.  Beef demand will be a major factor in weights.  A boost in consumer demand resulting in higher cutout values, boosting margins and fed cattle prices would speed up fed cattle marketings and pull down weights.  Fed cattle weights will be something interesting to watch in the coming year.  

    Happy New Year!


    Anderson, David. “Weight Gain.Southern Ag Today 4(1.2). January 2, 2024. Permalink

  • Federal Crop Insurance and the False Claims Act

    Federal Crop Insurance and the False Claims Act

    The False Claims Act, enacted in 1863, is intended to safeguard honesty and fair dealing with federal governmental programs.[1] Given that private crop insurers sell and service multi-peril crop insurance policies that are reinsured by the federal government,[2] the federal crop insurance program comes within the scope and ambit of the False Claims Act as well.  Under the False Claims Act, liability can be imposed upon any person “who knowingly presents, or causes to be presented, a false or fraudulent claim for payment or approval.”[3] The False Claims Act statute provides a provision for relators to file qui tam lawsuits on behalf of the United States government to recover damages in cases in which materially false or fraudulent claims were paid by the United States government.[4]

    The case of United States ex. rel. Kraemer v. United Dairies, L.L.P. presented a qui tam relator filing a False Claims Act claim against a dairy farm, its partners and agents after payment of a federal crop insurance claim.[5] The claim involved the “coarse grain” insurance provisions.[6] While corn may be planted for use as either grain or silage, the insurance coverage for grain differs for both.[7] The Risk Management Agency’s Crop Insurance Handbook requires insured to “report insurable acreage by unit and by type (grain or silage) according to the intended method of harvest; however, a variety of corn adapted for use as silage only is not insurable as grain and must be insured as silage.”[8] The dairy farm in the case insured all of the brown mid rib corn[9] it planted as grain, although it harvested a substantial percentage of the grain as silage.[10] The decision to insure the brown mid rib corn as grain was completed on the advice of the dairy farm’s insurance agents.[11]

    The United States District Court for the District of Minnesota held that although the dairy farm submitted materially false claims, the relator failed to prove the “knowledge” element required for False Claims Act claims.[12]

    On appeal. the United States Court of Appeals for the Eighth Circuit focused heavily on the relator’s argument that the dairy farm fraudulent submitted false Acreage Reporting Forms with their crop insurance applications in order to obtain crop insurance proceeds.[13] The definition of a “claim” under the False Claims Act is “any request or demand … for money or property.”[14] The Eighth Circuit Court of Appeals in Kraemer observed that an insurance application is not the same thing as a claim under the False Claims Act.[15] In addition, the Eighth Circuit Court of Appeals noted that although the dairy farm insured the corn crop as grain when some or all of the crop is intended to be harvested as silage, this purported misrepresentation was not “material” for purposes of the False Claims Act since no insurance claim form was presented into evidence for the trial court.[16] As the court noted, “If an insurance claim was filed, the appraisal became part of a thorough audit by the AIP. Each Defendant passed every audit and the claim was paid.”[17]

    The Kraemer case is thus an excellent illustration of the interaction between the federal crop insurance program and the False Claims Act, especially the limitations of the False Claims Act in crop insurance cases.

    Nothing in this article is intended to create an attorney-client relationship and does not constitute legal advice.


    [1] See The False Claims Act, U.S. Department of Justice (Apr. 4, 2023), available at: https://www.justice.gov/civil/false-claims-act

    [2] See About the Risk Management Agency, United States Department of Agriculture Risk Management Agency (2023), available at: https://www.rma.usda.gov/About-RMA/

    [3] See 31 U.S.C. § 3729(a)(1)(A) (2023).

    [4] See 31 U.S.C. § 3730(b) (2023).

    [5] See United States ex. rel. Kraemer v. United Dairies, L.L.P., 82 F.4th 595 (8th Cir. 2023)

    [6] See United States ex. rel. Kraemer v. United Dairies, L.L.P., 82 F.4th at 599; see also 7 C.F.R. § 457.113 (2023).

    [7] See United States ex. rel. Kraemer v. United Dairies, L.L.P., 82 F.4th at 599.

    [8] Id.

    [9] Id. Brown mid rib corn (“BMR”) is “a seed variety developed and marketed as highly digestible when chopped as silage, which significantly increases the milk output of dairy cows. However, BMR also produces quality grain yields, so BMR can be combined for grain if it is not chopped for silage.”

    [10] Id.

    [11] Id.

    [12] See United States ex. rel. Kraemer v. United Dairies, L.L.P., Civ. No. 16-3092, 2022 WL 959771 at *2 (D. Minn. Mar. 30, 2022).

    [13] See United States ex. rel. Kraemer v. United Dairies, L.L.P., 82 F.4th at 602.

    [14] See 31 U.S.C. § 3729(b)(2)(A) (2023).

    [15] Id. at 603.

    [16] Id. at 604.

    [17] Id.

    Marzan, Chad, and Paul Georinger. “Federal Crop Insurance and the False Claims Act.Southern Ag Today 3(52.5). December 29, 2023. Permalink

    Photo by Sora Shimazaki: https://www.pexels.com/photo/close-up-photo-of-wooden-gavel-5668473/

  • American Whiskey Gets Extended Tariff Reprieve in the EU…Just Weeks Before the Deadline

    American Whiskey Gets Extended Tariff Reprieve in the EU…Just Weeks Before the Deadline

    Earlier this year (June 29, 2023) I wrote an article about U.S. whiskey exports rising even as agricultural exports declined overall.[1] The main point of that article was that whiskey sales to foreign markets have been continually increasing, in terms of both volume and value, and that the European Union (EU) stood out as a major destination, accounting for a large share of this recent rise. Currently, the EU accounts for over 50% of total U.S. whiskey exports (Figure 1).[2] This could have all been wiped away due to the lingering effects of the trade war.

    Between June 2018 and January 2022, the EU imposed a 25% retaliatory tariff on American whiskey in response to the tariffs the Trump Administration imposed on foreign steel and aluminum. Consequently, U.S. whiskey exports to the EU decreased by over 30% between 2018 and 2020 (from $552 million to $368 million). The Biden Administration was able to negotiate a temporary tariff suspension starting in January 2022. Whiskey sales to the EU increased to $565 million that year and are expected to reach nearly a billion dollars by the end of 2023 (USDA, 2023) (Figure 1). The tariff suspension was set to expire this December, and as of January 2024 the EU would have imposed a 50% tariff on imports of U.S. whiskey if the suspension deadline was not extended. Fortunately, on December 19, 2023, the Biden Administration was able to secure an extended suspension of the retaliatory tariffs until March 31, 2025 (DISCUS, 2023).    

    This pending 50% tariff raised questions about its potential impact on U.S. whiskey sales to the EU. This question is now academic since the tariff reprieve was extended last week. It is important to note that whiskey is the leading U.S. distilled spirits export, accounting for more than two thirds of all distilled spirits sales to foreign markets in 2022 and 2023. Thus, any decline in whisky exports will have had a significant impact on the U.S. distilled spirits sector overall. If the 25% tariff experience is an indication how the EU market would have responded to an even higher tariff, it is safe to say that U.S. distilled spirits sector dodged a major bullet. Hopefully, all of this will get resolved before March 31, 2025.

    Figure 1. U.S. Whiskey Exports to the EU and World: 2018-2023

    Note: Whiskey is the generic term that includes whiskey of all types (e.g., malt, corn, rye) and bourbon and is defined according to the Harmonized System Classification (HS) HS 2208.30 whiskies.  
    Source: USDA (2023)

    References

    Distilled Spirits Council of the United States (DISCUS). 2023. Statement on the U.S. and EU Agreement to Extend the Suspension of EU Tariffs on American Whiskey until March 31, 2025

    https://www.distilledspirits.org/news/discus-statement-on-the-u-s-and-eu-agreement-to-extend-the-suspension-of-eu-tariffs-on-american-whiskey-until-march-31-2025/

    U.S. Department of Agriculture (USDA). 2023. Global Agricultural Trade System (GATS). Foreign Agricultural Service, Washington, DC.


    [1] Whiskey is the generic term that includes whiskey of all types (e.g., malt, corn, rye) and bourbon.

    [2] The EU-27 countries are Austria, Belgium, Bulgaria, Croatia, Republic of Cyprus, Czech Republic, Denmark, Estonia, Finland, France, Germany, Greece, Hungary, Ireland, Italy, Latvia, Lithuania, Luxembourg, Malta, Netherlands, Poland, Portugal, Romania, Slovakia, Slovenia, Spain and Sweden.


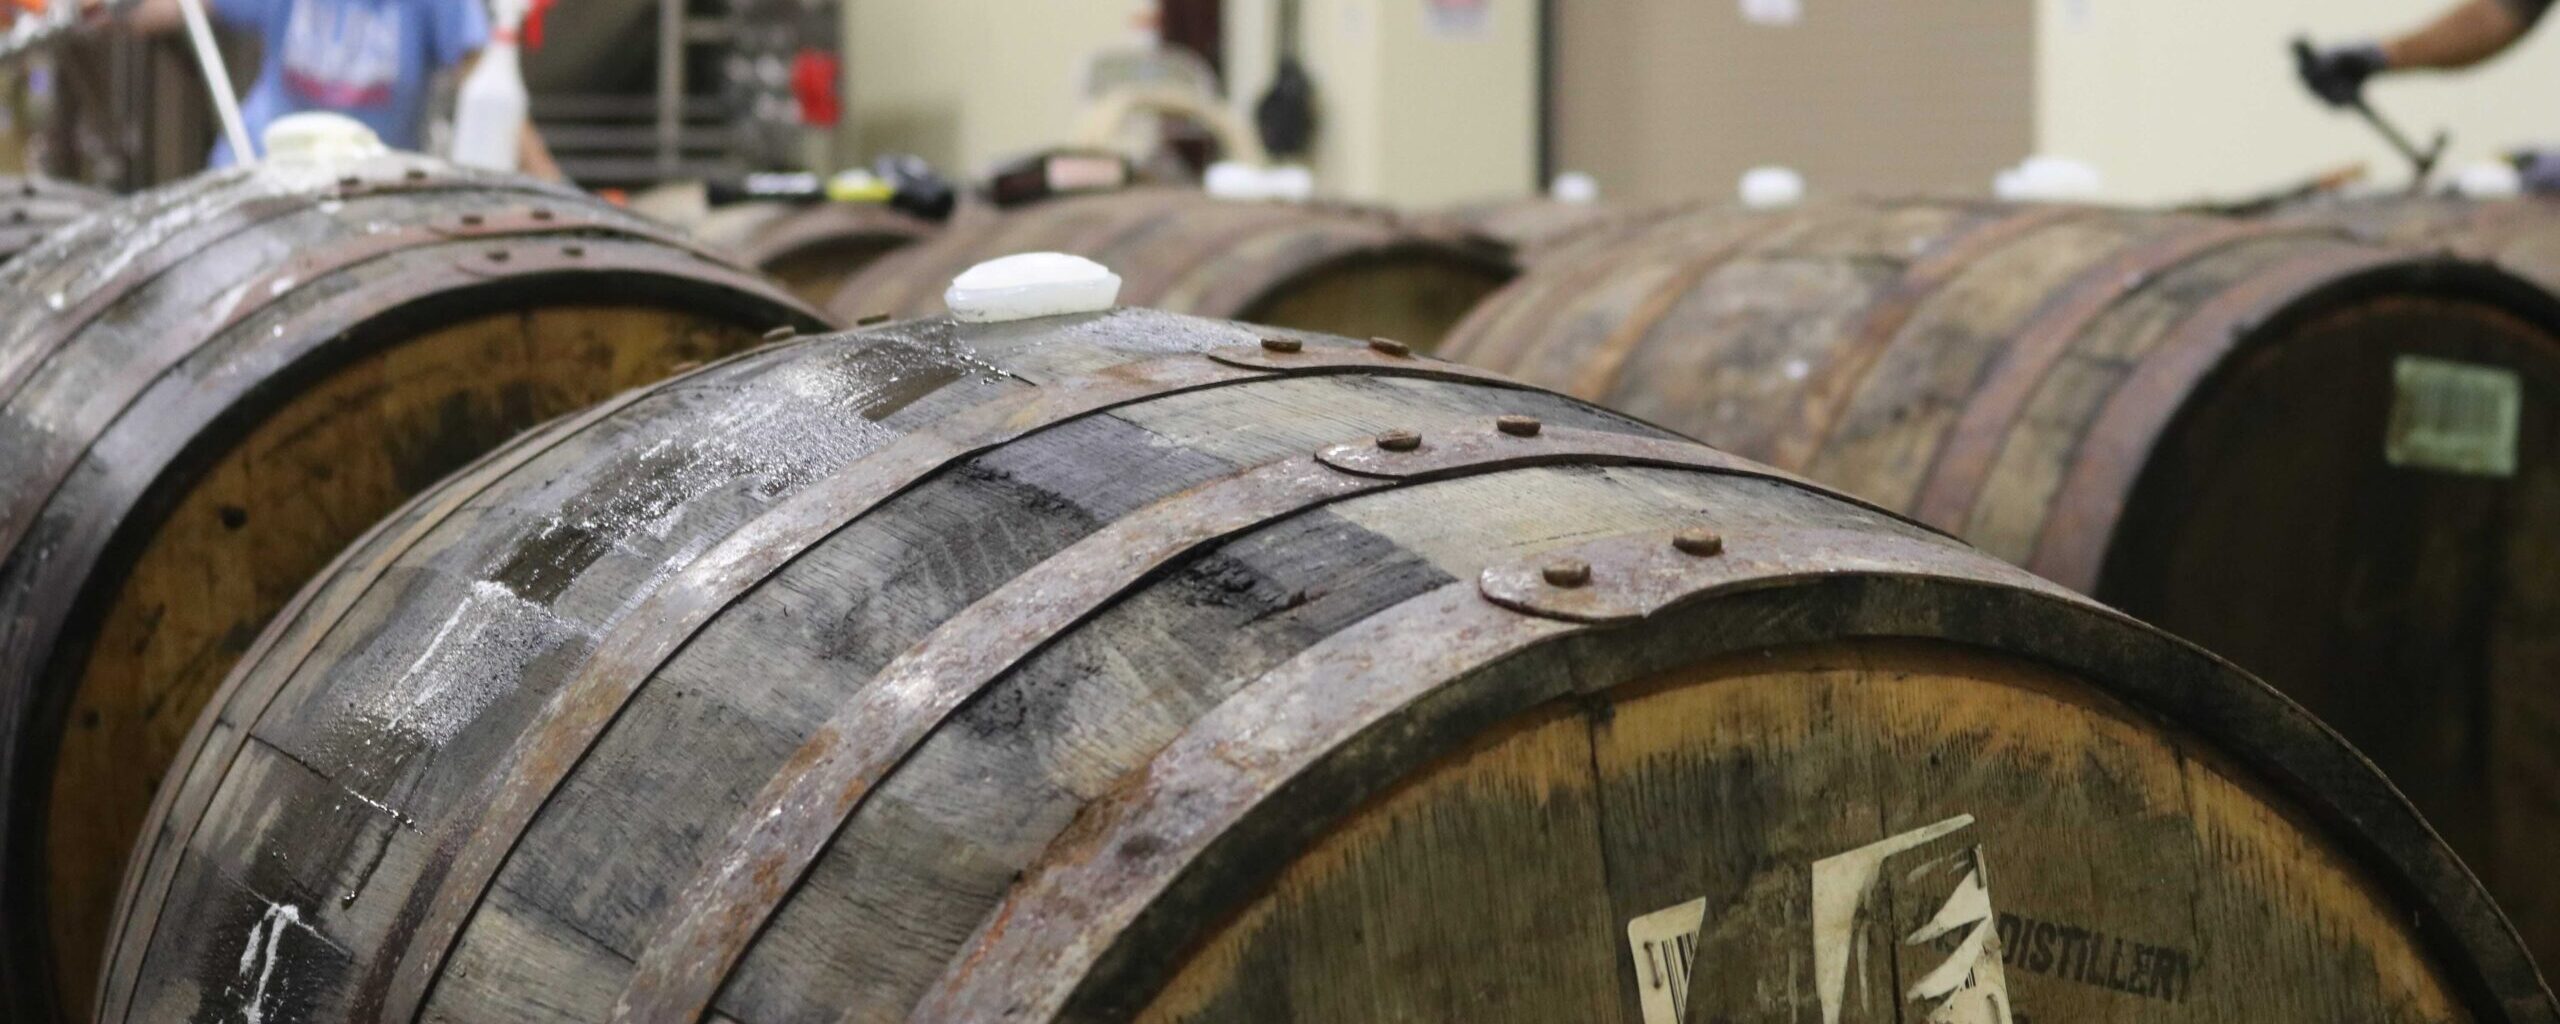
    Photo by ELEVATE: https://www.pexels.com/photo/brown-wooden-barrel-inline-inside-room-1267311/

    Muhammad, Andrew. “American Whiskey Gets Extended Tariff Reprieve in the EU…Just Weeks Before the Deadline.Southern Ag Today 3(52.4). December 28, 2023. Permalink

  • Look Out Overhead

    Look Out Overhead

    An important financial consideration for any business is the costs they incur during the year. Ultimately, it affects the amount of profit or loss that will be realized by the business. There are certain “costs of doing business” known as overhead. These are things that an organization will have to pay for but are not designated to any one activity. An example might be property taxes. The taxes are owed and necessary for the business to maintain its property and obligations but typically could not be solely attributable to one activity like raising livestock or producing a crop. Usually, the costs are known but sometimes take a backseat to direct input costs when it comes to evaluation. For a true look at profitability, overhead must be factored in. The good thing is it may present opportunities for the business to cut down on its overall spending. 

    Overhead expenses occur once a year, several times a year, or even more sporadically. The first step is making sure they are logged in the books and records of the business. They can be reviewed to make sure they are necessary, reasonable, and have ultimately been paid. Common overhead expenses include insurance, taxes, depreciation, utilities, office expenses, and salaries. This list may not be all-encompassing, and it is important to mention that any personal expenditures for these items are not included in farm profitability.  Often, the business will have a bill or receipt that includes the amount. For others, it may be more of a calculation like depreciation or extracting the business use of utilities. The main goal is to account for all “costs of doing business”. 

    Determining total overhead is the first step. Once that has been completed, a producer may want to allocate the overhead costs to their different enterprises. This is not necessarily a precise calculation but is up to the owner or business manager. Some may approach it from a revenue perspective. For instance, if cotton is 50% of total farm revenue, then 50% of overhead will be allocated to it. Another method may be according to labor hours. If the time spent on a particular crop is 50% of the total hours worked (by everyone on the farm), then 50% of the overhead will be allocated to that crop. Product mix and profit margins will be different on each farm, so it is up to them to determine what is most appropriate. 

    In reviewing the information, a farm may realize that there are opportunities to cut costs. While not advocating for a farm to run without its necessary expenditures, overhead may be where some costs can be scrutinized. Checking insurance rates every couple of years can provide the same coverage at a lower cost from a different carrier. Computer software and other subscription services may have promotions or discounts for being a continued customer. Perhaps there are subscription services that are going unused and could be cut out completely. If computer equipment is upgraded every couple of years, extending that out an additional year or two can defer the expense. Often, farmers may attend trade shows or conferences to pick up new information. Sometimes, the conference host or other farm organizations will provide a cost share for travel or reimbursement for the conference. 

    The above are only a few ideas of cutting overhead costs. Individually, the costs may not account for much, but an effort to manage overhead can provide significant combined savings in the long run. If a farm is operating fairly lean from an input perspective, overhead may provide other opportunities to affect profitability. At the end of the day, revenues minus expenses determines net returns. Which expenses are reduced does not matter for the overall equation.


    Burkett, Kevin. “Look Out Overhead.” Southern Ag Today 3(52.3). December 27, 2023. Permalink