Blog

  • Tariff and Non-Tariff Barriers Affect U.S. Agricultural Exports to the ASEAN Market

    Tariff and Non-Tariff Barriers Affect U.S. Agricultural Exports to the ASEAN Market

    The U.S. has established itself as a prominent exporter of agricultural and food products to the Association of Southeast Asian Nations (ASEAN), which includes major U.S. trading partners like Vietnam, the Philippines, and Malaysia. According to USDA, from 2010 to 2022, there was a notable upward trend in agricultural and related products exports to ASEAN, reaching a high of $15.80 billion in 2022. The U.S. consistently holds the position of the second-largest agricultural exporter to ASEAN. The average annual growth rate for U.S. agricultural exports to the region stood at more than 4% over this period, far outpacing the less than 2% percent growth for exports to other regions.

    In the present landscape of global trade, the U.S. encounters significant trade barriers in the ASEAN region. The U.S. has a free trade agreement (FTA) with Singapore, but with no other ASEAN country. U.S. agricultural exports are subject to substantial applied average tariff rates in the remaining member states of ASEAN, ranging from 2.7% in Malaysia to 27.7% in Thailand. Notably, the Philippines, Vietnam, Indonesia, and Thailand, which impose import duties exceeding 10% on U.S. agricultural goods, are key export destinations. Specific product categories, such as beverages, tobacco, dairy, fruits and nuts, and sugar products are subjected to effective ad valorem average tariff rates exceeding 10%, thereby diminishing the competitiveness of these U.S. commodities in the ASEAN marketplace. Additionally, the proliferation of non-tariff measures (NTMs) has a substantial impact on U.S. agricultural exports to ASEAN. These NTMs range from import licensing mandates, health and safety regulations, and technical standards, to sanitary and phytosanitary measures, including the complexity of bureaucratic procedures. Such impediments escalate the cost of doing business, thereby hindering U.S. exports to ASEAN.

    The network of bilateral and regional FTAs that ASEAN economies have established with their trading partners, such as the Regional Comprehensive Economic Partnership (RCEP), further complicates U.S. competitiveness. ASEAN countries have engaged in extensive FTA networks, offering their partners considerable tariff and non-tariff benefits, which include significant tariff reductions. For instance, Vietnam has enacted various bilateral and regional FTAs, including RCEP and the EU-Vietnam FTA. Indonesia has fortified its trade links with thirteen bilateral and regional FTAs, demonstrating its dedication to global trade. The Philippines (10 FTAs), Thailand (14 FTAs), and Malaysia (16 FTAs) have expanded their global trade relations. These widespread agreements, present challenges for U.S. agricultural exporters as ASEAN countries deepen trade with countries that compete against U.S. exports.

    Figure 1. Applied tariffs and U.S. agricultural export to ASEAN

    Source: USDA Foreign Agricultural Service and WTO

    Hossen, Md Deluair. “Tariff and Non-Tariff Barriers Affect U.S. Agricultural Exports to the ASEAN Market.” Southern Ag Today 3(48.5). December 1, 2023. Permalink

  • Evaluation of the Recent Government Accountability Office Sugar Program Report 

    Evaluation of the Recent Government Accountability Office Sugar Program Report 

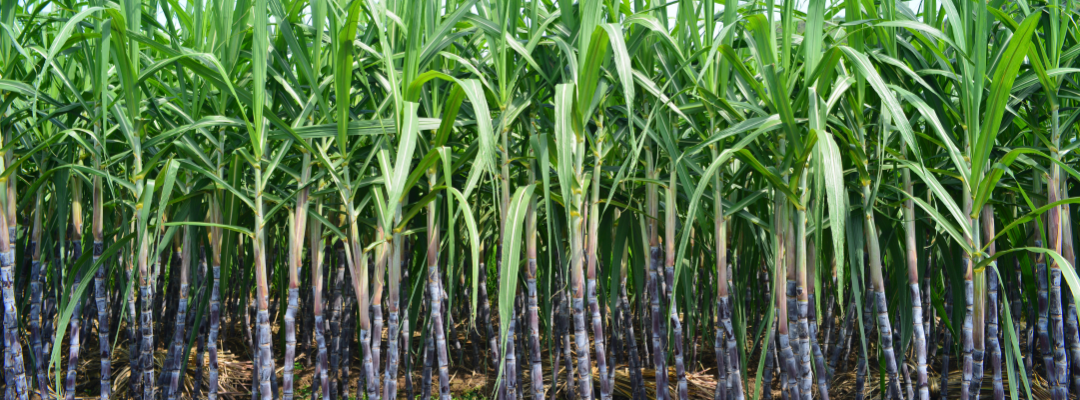
    In the lead up to the 2018 Farm Bill expiration, U.S. Representatives Blumenauer (D-OR) and Kuster (D-NH) requested that the U.S. Government Accountability Office (GAO) study the effects of the U.S. sugar program. In this latest GAO report, rather than providing an objective and comprehensive overview of the effects of the program, it seems GAO was most interested in doubling down on its previous work. Importantly, despite decades of criticism from GAO, both Congress and the USDA have repeatedly rejected calls for wholesale changes to the U.S. sugar program. Sugar is the most highly supported agricultural good worldwide and the global sugar market is the most distorted commodity market, a point acknowledged by GAO. That factor and others, which we outline below, help explain why Congress has, with only a few brief exceptions, maintained a strong sugar program since 1789 regardless of which party has been in power. Had GAO considered some of those points, it would have resulted in a considerably more objective and well-balanced report.

    GAO devoted a considerable amount of its report to examining the extent to which food companies are harmed by the sugar program. While it is not surprising the GAO report repeats the complaints of sugar-using groups regarding prices paid for sugar, it is surprising that GAO would not note (much less attempt to quantify) any benefits that those users receive from the sugar program. For one, research has shown that U.S. consumers prefer domestically sourced sugar rather than foreign sugar (Lewis et al., 2016). The U.S. sugar program establishes and maintains a strong domestic sugar supply chain, which accrues benefits to sugar-using companies and consumers, as well as promotes a reliable domestic supply of beet and cane sugar. Because of the U.S. sugar program, sugar-users can count on a reliable supply of sugar whenever and wherever they desire it and in the form that meets their specific needs. Such just-in-time delivery of an essential input to their production lines without having to invest in costly sugar storage facilities is extremely valuable to those companies. GAO does not provide any comparison to alternative scenarios in which those companies have to pay to invest in their own sugar supply chain logistics and where those companies are reliant on their main sugar supply being shipped to them from countries such as Brazil or India.  

    The GAO report also neglected to include several recent articles that indicate the success of sugar-using firms that operate within the contours of the U.S. sugar program (i.e., Trejo-Pech et al., 2020; DeLong and Trejo-Pech, 2022; Trejo-Pech et al., 2023). For example, Trejo-Pech et al. (2023) demonstrates that food companies that are large sugar purchasers financially outperform other agribusinesses as well as other publicly traded companies in the United States. 

    The GAO report briefly discussed how the effects of the U.S. sugar program are passed from food manufacturers to end-consumers. However, they referenced a GAO report from 2000 rather than using more recent studies. For example, DeLong and Trejo-Pech (2022) found that sugar-using companies in the United States do not pass on savings from changes in sugar prices to consumers, raising questions about GAO’s statements regarding which groups bear the costs of the sugar program. History unequivocally shows that food manufacturers and retailers pass no savings along to consumers when the price they pay producers for their sugar drops. DeLong and Trejo-Pech (2022) found no correlation between the price of sugar in the United States and the retail product prices charged to American households by sugar-using companies. In other words, any benefit in a decrease in U.S. sugar prices is likely captured by food manufacturers as increased profits and are not passed along to their customers (DeLong and Trejo-Pech (2022)). 

    While GAO did not repeat its earlier recommendation from twenty years ago for Congress to lower the loan rate for sugar, it has missed an opportunity to compare the sugar loan levels in the farm bill – which have remained virtually unchanged over the past several farm bills – to the actual costs of producing sugar. Had GAO done so, the report would have added to the current farm bill discussion by showing how much costs of production have increased relative to the loan rates established in the 2018 Farm Bill. While that topic will be addressed more thoroughly in a subsequent Southern Ag Todayarticle, current costs of sugarbeet and sugarcane production are roughly 30% higher than they were in 2018 when the last farm bill was enacted.

    GAO spent most of their report simply summarizing results from selected welfare economic studies (similar to their previous reports) that ultimately provides only a one-sided view of the sugar market in the United States and other countries. Indeed, many of their selected studies do not include more recent developments in the U.S. sugar market, such as the current Suspension Agreements with Mexico for sugar trade. Moreover, welfare economic studies do not capture the real-world benefits of ensuring a strong domestic supply chain, and they will continue to inadequately quantify the threat posed to U.S. producers by foreign governments in response to changes in U.S. sugar policy. For example, in just the past decade, there have been disputes involving the aforementioned dumping of subsidized sugar from Mexico into the United States and a WTO violation in the case of Indian subsidies to its sugar industry (USDA Economic Research Service, 2023; USDA Foreign Agricultural Service, 2023).

    Notably absent from GAO’s report are the many studies that document the importance of the economic activity generated by sugar production to many rural and urban communities around the United States. For example, a recent study by researchers at Texas A&M University found that the sugar industry contributes an estimated $23.3 billion annually to the U.S. economy, supporting more than 150,000 jobs across two dozen states.

    What is perhaps most interesting in the GAO report is their recommendation to USDA and the U.S. Trade Representative (USTR) to analyze alternative mechanisms for administering preferential-quota access to our trade partners. Improving the efficiency of government administration is always laudable. With that said, that is virtually the same recommendation GAO made nearly 25 years ago. After decades of observing how this has worked in practice, actually analyzing the potential gains from changing how USDA and the USTR administer sugar quotas would have been an interesting contribution by GAO to the discourse surrounding the new farm bill. GAO’s report did not add anything new to the discussion of the U.S. sugar program, and it missed an opportunity to finally provide a balanced report which includes the benefits provided by the U.S. sugar program.

    References:

    DeLong, K.L. and C. Trejo-Pech. 2022. “Factors Affecting Sugar-Containing-Product Prices.” Journal of Agricultural and Applied Economics, 54(2): 334-356. https://doi.org/10.1017/aae.2022.12

    Lewis, K.E., C. Grebitus, and R. Nayga, Jr. 2016. “U.S. Consumer Preferences for Imported and Genetically Modified Sugar: Examining Policy Consequentiality in a Choice Experiment.” Journal of Behavioral and Experimental Economics, 65:1-8. https://doi.org/10.1016/j.socec.2016.10.001

    Trejo-Pech, C.J.O., K.L. DeLong, D.M. Lambert, and V. Siokos. 2020. “The Impact of US Sugar Prices on the Financial Performance of US Sugar-Using Firms.” Agricultural and Food Economics, 8(6): 1-17. https://doi.org/10.1186/s40100-020-00161-5

    Trejo-Pech, C.J.O., K.L. DeLong, and R. Johansson. 2023. “How Does the Financial Performance of Sugar-Using Firms Compare to other Agribusinesses? An Accounting and Economic Profit Rates Analysis.” Agricultural Finance Review, 83(3): 453:477. https://doi.org/10.1108/AFR-08-2022-0103

    USDA Economic Research Service. 2023. Mexico Remains Significant Supplier of U.S. Sugar Despite Limits Imposed on Mexican Sugar Imports. Retrieved from: https://www.ers.usda.gov/data-products/chart-gallery/gallery/chart-detail/?chartId=103093#:~:text=In%202014%2C%20after%20the%20U.S.,been%20applied%20to%20Mexican%20sugar. USDA Foreign Agricultural Service. 2023. India: WTP Rules Against India’s Sugar Export Subsidies and Domestic Price Support. Retrieved from: https://fas.usda.gov/data/india-wto-rules-against-indias-sugar-export-subsidies-and-domestic-price-support#:~:text=On%20December%2014%2C%202021%2C%20the,obligations%20under%20the%20multilateral%20agreement


    DeLong, Karen L., Michael Deliberto, and Bart L. Fischer. “Evaluation of the Recent Government Accountability Office Sugar Program Report.Southern Ag Today 3(48.4). November 30, 2023. Permalink

  • Comparing Liquified Propane to Natural Gas for Heating Fuel Cost Management in Poultry

    Comparing Liquified Propane to Natural Gas for Heating Fuel Cost Management in Poultry

    As winter approaches the broiler belt, it brings with it increased heating fuel bills for poultry growers. Most modern poultry houses in the southeast use liquified propane (LP) or natural gas (NG) to keep birds warm during the winter months, as well as during brood phases year-round. In many areas of the southeast, growers can choose one fuel over the other. However, this is a long-term choice requiring equipment conversions and plumbing changes. The cost of heating their poultry houses is usually a primary driver of this choice. LP and NG prices have proven to be volatile at times. Historically, LP price lags but roughly follows crude oil price changes, as it is a by-product of crude oil production. NG prices also have a crude oil production component but react more to international events and trading. The development of domestic gas fracking has made it more available and advanced NG as a competitor to LP in the U.S. However, access to NG pipelines is a limiting factor for many poultry producers. Also, NG customers generally do not have the ability to lower costs via pre-purchase agreements, volume purchases, or other negotiated price strategies that LP users have. Natural gas users simply pay the provider’s price at the time of billing. LP users must monitor fuel stocks and schedule deliveries to maintain adequate supplies at the farm. NG users do not have this worry as they always have pipeline access to gas. Hence, there is also no storage cost to consider when using NG. Farm trials have shown that, if NG is readily available, and prices are at their normal comparative levels, it is generally less costly to heat a poultry house with NG. But with recent NG price volatility, this could vary. 

    When comparing the costs of these two fuels, it is important to compare them on an equal basis in terms of heat energy output per unit. For this, British Thermal Units, or btu’s per unit is used. (One btu is roughly equivalent to the heat of a single matchstick flame.) LP is traded and sold to growers by the liquefied gallon and contains approximately 91,452 btu’s per gallon, with slight variations in actual product delivered. NG is traded and reported in one thousand cubic feet (MCF) units, which equals one million btu’s. It is often sold to retail customers by the “therm” or CCF (one hundred cubic feet), which is 100,000 btu’s of energy. For a quick comparison, you can take the LP price, multiply that by 1.093 and get the rough equivalent price of NG on a per btu basis. For example, if NG is priced at $1.17/CCF or $11.70/MCF (current trend price in Fig 1a), LP would need to be priced at approximately $1.07 per gallon to be equal in cost per btu. LP has not been at that low of a price in the southeast in recent history. Conversely, $1.20/gallon LP (trend forecast price in Fig 2b) is roughly equal to $1.31/CCF natural gas. Recent history has shown that NG prices are trending below that level, but from the spring of 2022 to the spring of 2023, prices were well above the trend, with commercial rates hitting a high of $1.45/CCF in September ‘23. LP prices at that time were approximately $1.52/gal ($1.66/CCF equivalent). These were the national averages; some users may have paid higher local rates for either fuel. Some local providers have varying rates for farms versus residential or commercial for LP or NG. Although NG has generally stayed on the less expensive side of this relationship, it may not always be the case for a specific farm or specific providers. 

    When looking at these variations, it is important to note that LP prices tend to react more to locally occurring events like weather and the short-term impacts of those events on supply than NG. However, the overall U.S. supply of propane does affect the market prices nationwide, as seen in figures 2a and 2b below. Luckily for poultry growers using LP, the current U.S. supply is strong and suggests lower winter prices are possible this year. NG is widely traded internationally, and prices are more reactive to international events like the war in Ukraine or Chinese economic strength and purchasing of the commodity. Even so, NG prices are forecast to remain soft for the coming winter as U.S. production looks strong and growing (fig 1b). Overall, with propane stocks high and natural gas production strong, U.S. poultry growers may be getting a welcome relief this winter from the high fuel costs of recent years, no matter which fuel source they choose. 

    NOTE: Any poultry grower considering making a switch from one heating fuel source to another needs to consider all costs, both short and long term, like equipment changes, plumbing upgrades, and pricing flexibility. Click HERE  for detailed information on NG conversion in poultry houses.

    Fig. 1a & b: Natural gas prices have been volatile recently in response to international events and trading. However, long-term forecasts are lower than the high prices of 2022. U.S. production looks to be strong and increasing over time.


    Brothers, Dennis. “Comparing Liquified Propane to Natural Gas for Heating Fuel Cost Management in Poultry.Southern Ag Today 3(48.3). November 29, 2023. Permalink

  • Lamb And Mutton Production Shrinks This Year 

    Lamb And Mutton Production Shrinks This Year 

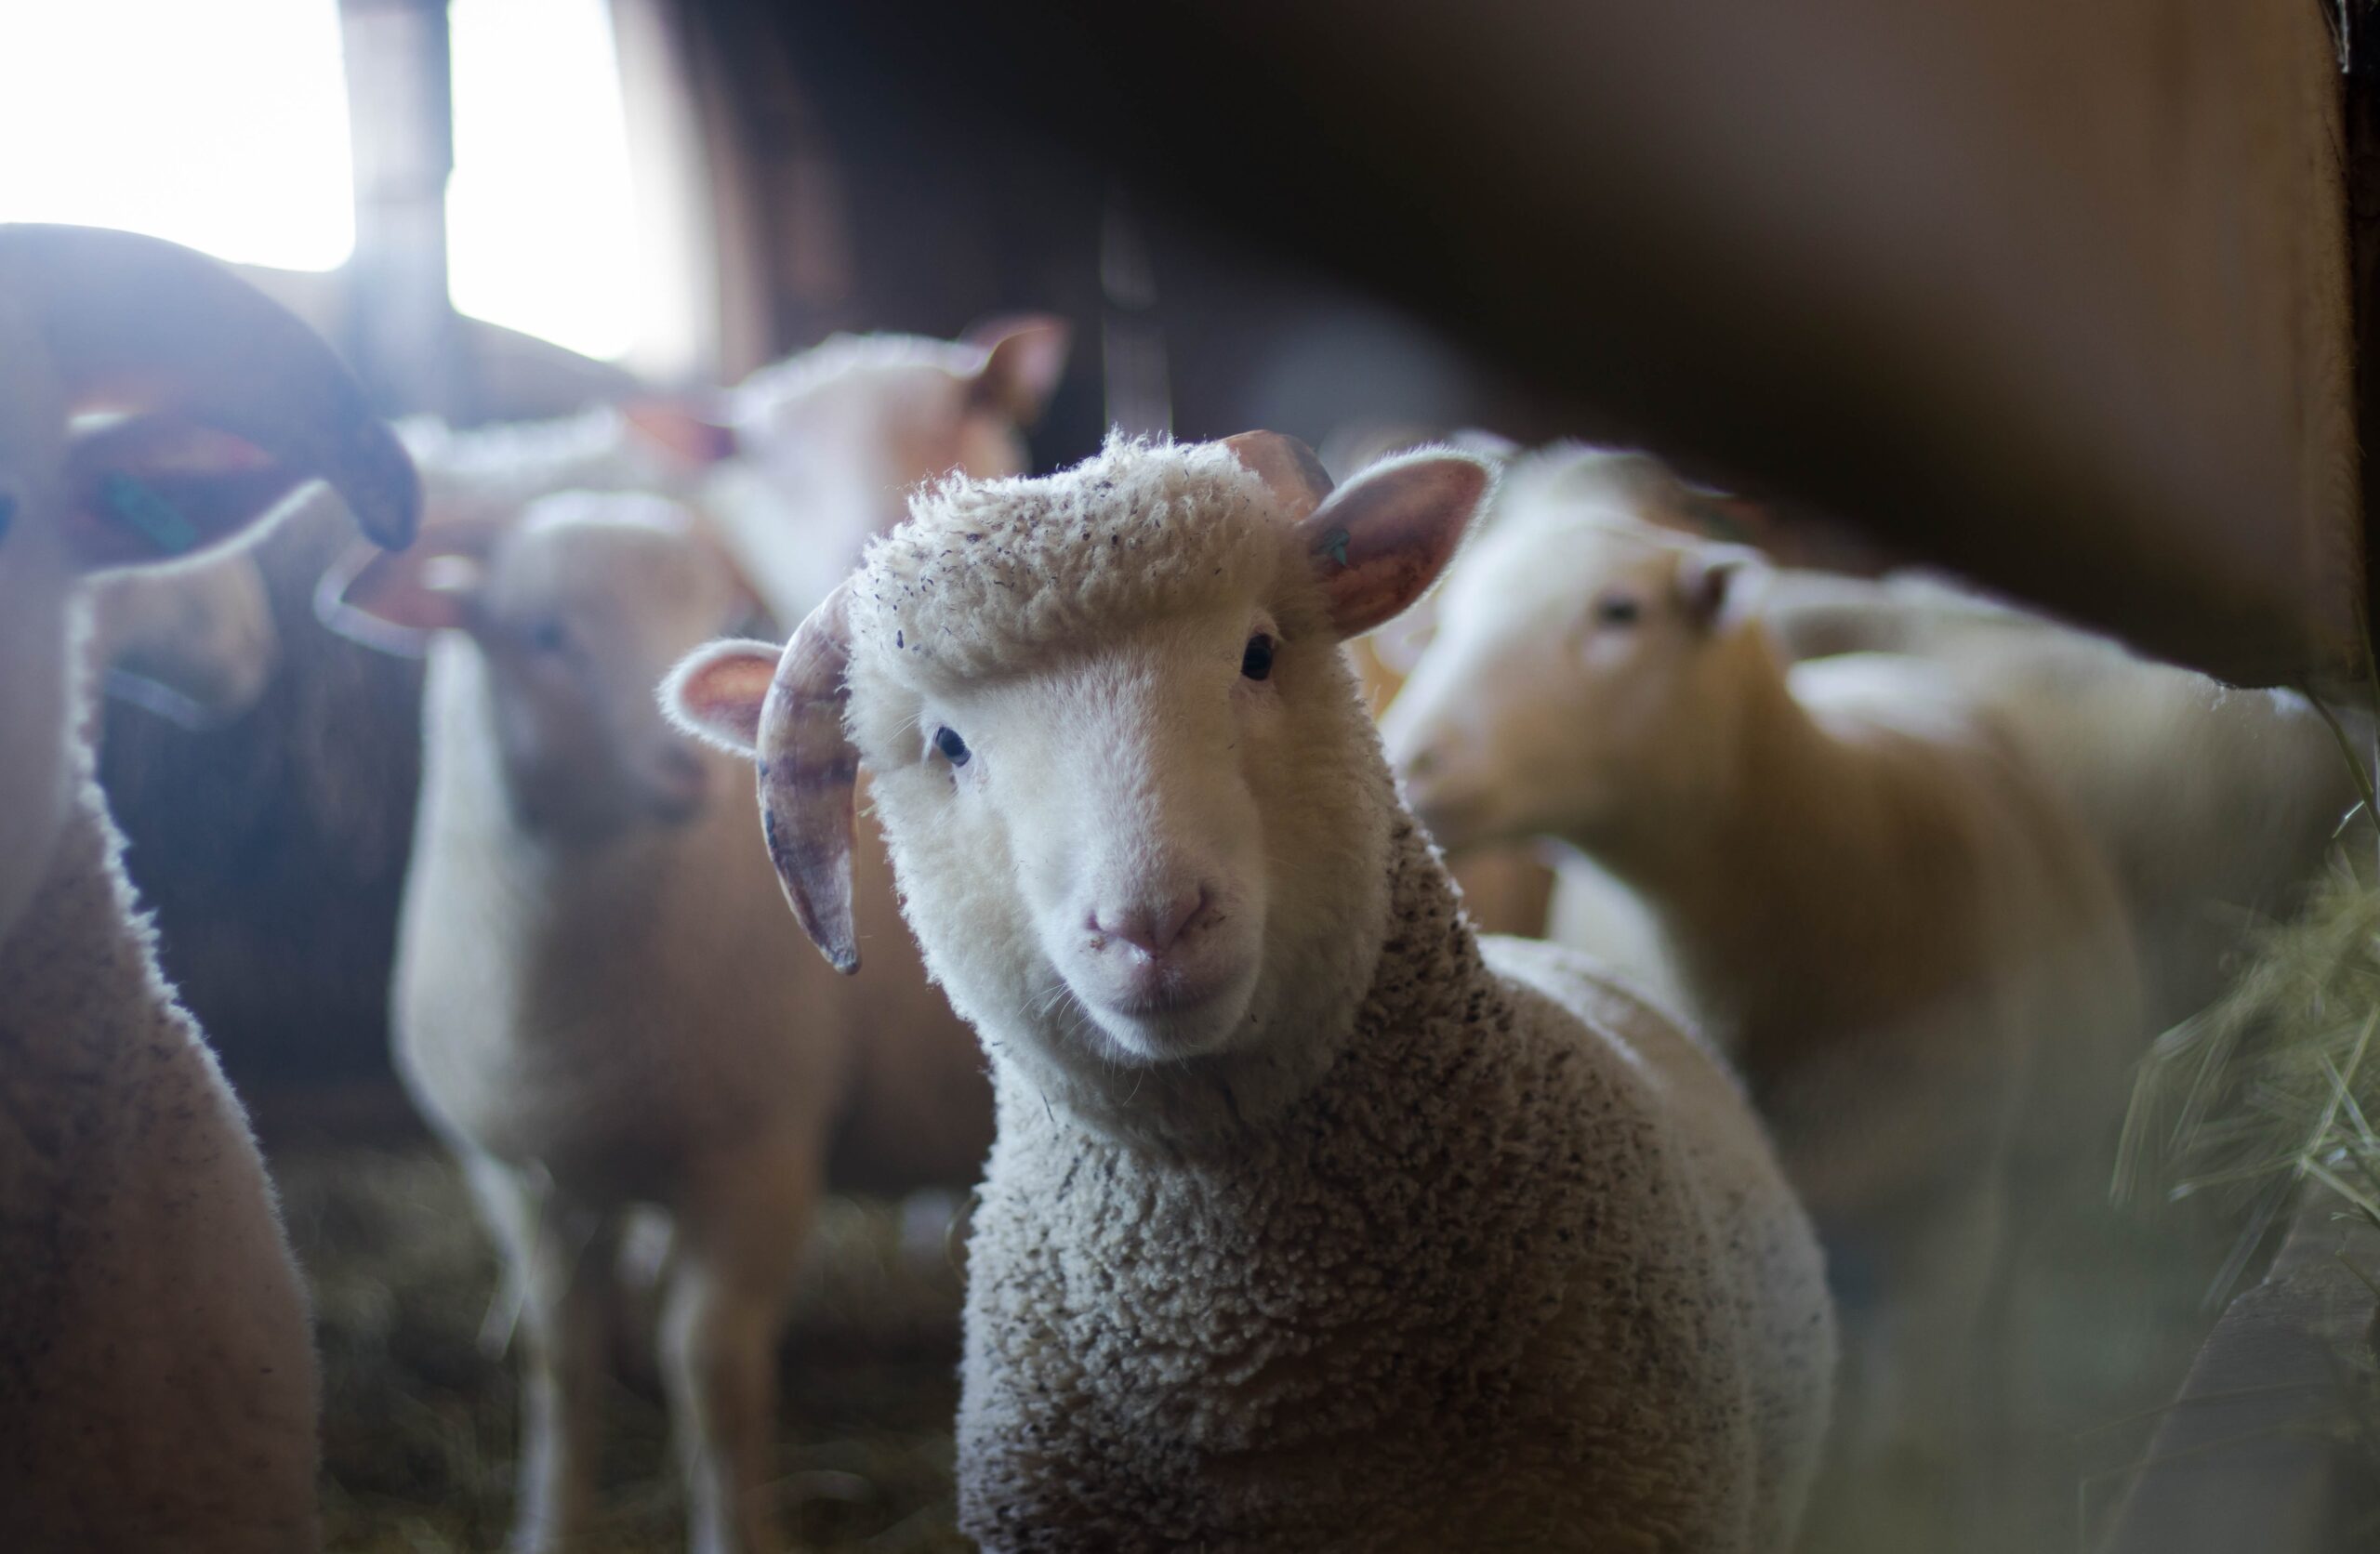
    Lamb and mutton production has followed the usual historical pattern this year, hitting a peak in Spring and increasing from Summer lows this Fall. Production peaked at the end of the first quarter, outpacing 2022 numbers. Then, production declined, reaching a low in July. In recent weeks production has exceeded that of 2022.  You’ll notice the sharp production decline in the chart indicating the Thanksgiving shortened work week.

    From January to November 2023, federally inspected (FI) lamb and mutton production totaled 102.1 million pounds. This represents a 2.7 percent drop compared to the same period of 2022. Despite that production decline, the number of sheep and lambs slaughtered jumped 3.4 percent, from 1.38 to 1.63 million head. Weight is the crux of the matter. Average FI live weight declined by 6.3 percent. Over the abovementioned period, the average sheep and lamb live weight dropped from 132.7 to 124.3 pounds. Likewise, dressed weight has decreased, on average, by 6%. Lighter weights reflect more, lighter hair sheep, lambs going to non-traditional markets at lighter slaughter weights, and likely fewer fed in feedlots this year.

    Total supplies include imports and cold storage stocks. The cold storage reached 26.1 million pounds in October, 9 percent less than the same month in 2022. Lamb and mutton imports plummeted 17.4 percent so far this year. From January to September 2023, the U.S. imported 174 million pounds. The country brought in 211 million pounds during the same period last year.

    Live lamb prices collapsed midway through 2022 and have spent most of this year trying to recover.  By mid-year 2023 lamb prices had recovered to exceed those of 2022. After that, national negotiated live prices have hovered at around $200 per cwt.  Even though prices have begun to decline in recent weeks, tighter overall supplies from domestic production, reduced imports, and less in cold storage have boosted prices above year ago levels.

    There appears to be renewed interest in lamb production in the South, based on questions some of us livestock economists here at SAT receive.  Price recovery should continue that interest over time and provide a boost to those who have started production.


    Clemets Daglia Calil, Yuri. “Lamb And Mutton Production Shrinks This Year.” Southern Ag Today 3(48.2). November 28, 2023. Permalink

  • Bridging the Price Risk Gap

    Bridging the Price Risk Gap

    At the end of the calendar year, many producers prepay for inputs to reduce taxes and potentially avoid higher prices in the spring. To prevent the risk of profit margin reductions (from a decline in commodity prices), producers may want to consider obtaining downside price protection for a portion of their anticipated 2024 production at the same time as inputs are purchased. One strategy is purchasing put options on the yield required to pay for the input purchased, and carrying the put option position until the projected crop insurance price is determined.

    Table 1 shows a simple budget for Tennessee corn production (target yield of 180 bu/acre), and the number of bushels of production required to cover the specified expense at different corn prices. This is computed as the cost of the production input per acre divided by the harvest price.  For example, a fertilizer expense of $181.80/acre would require 40.4 bu/acre to cover the fertilizer expense at a corn price of $4.50/bu, 38.3 bu/acre at a corn price of $4.75/bu, or 36.4 bu/acre at a corn price of $5.00/bu. A producer can mitigate financial risk by using put options to cover the amount of production needed to cover that input cost, thus bridging the price risk gap until crop insurance prices and revenue protection are determined. 

    A producer with 260 acres of corn, seeking to set a futures price floor at $4.75/bu and provide sufficient price protection on the bushels needed to pay the fertilizer expense, could purchase two put options (5,000 bushels each covering 260 acres x 38.3 bu/acre = 9,958 bushels). On November 21st a $5.20 December 2024 corn put option could be purchased for 45 cents, setting a $4.75 futures floor. The put option could be carried until March 1, at which time projected crop insurance prices are established and revenue protection for the upcoming crop are determined. At that time, the option purchaser can evaluate the price protection their crop insurance provides and decide to maintain the put option position or exit. If the December corn futures contract is below $4.75, the purchaser can maintain the put option position for additional price protection or exercise the option for a financial gain. If the December corn contract is above $4.75, the purchaser can maintain the position or exit the put option position and recoup a portion of the premium based on the time value remaining.  

    Producers should examine times during the year when they are exposed to price and financial risk and seek strategies to mitigate those risks. Using put options can be an effective tool to remove some price risk when prepaying for fertilizer, and other inputs, until crop insurance prices and revenue protection are determined. 

    Table 1. Tennessee Corn Budget for 2024 and Number of Bushels to Cover a Specified Expense at Three Corn Prices

    References:

    Barchart.com. December 2024 Corn Options Prices. Accessed at:  https://www.barchart.com/futures/quotes/ZCZ24/options   University of Tennessee Field Crop Budgets – https://arec.tennessee.edu/extension/budgets/