Blog

  • Leading Change in Your Cooperative

    Leading Change in Your Cooperative

    Organizations, particularly agricultural cooperatives, are facing changes from all directions. As legacy cooperatives retire managers and directors, and potential succession prospects take the reins, changing times are knocking on the door requiring greater leadership skill. Now more than ever, powerful macroeconomic forces are pushing businesses to reduce costs, improve quality of products and services, find new opportunities for growth, and increase productivity to avert catastrophic change. Change is inevitable and how leaders address this change will define what the outcome will be. Will they succeed in adapting or fail by ignoring it?

    To overcome organizational change, it is incumbent upon leaders to develop a plan thoughtfully and carefully with realistic expectations. Failure to do so may lead to frustrated employees, wasted resources and disappointing results. Whenever people are forced to adjust to a new paradigm, the organization runs the risk of chaos. Therefore, leaders should roll out improvement plans in a committed and orderly fashion that avoids several errors. 

    According to John Kotter, leadership expert and Harvard Business School Professor, there are eight errors organizations commonly make in trying to transform their businesses effectively to meet imminent change. What many leaders overlook is the fact that change can be good. Change can transform us, and force organizations to reassess their purpose by reengineering, strategizing, and reorganizing. Although it is common for cooperative members and employees to experience a certain amount of pain with organizational change, good leadership can temper feelings of uncertainty and rescue the organization from a downward spiral into uplifting renewal.

     Identifying eight common errors help leaders understand where leading and managing change can go awry. Each mistake obstructs a path forward and slows the process of positive change. Common errors in leading change are:

    1. Allowing too much complacency – lacks urgency and fails to achieve objectives.
    2. Failure to create a strong guiding coalition – top to bottom “Buy-in” is required.
    3. Underestimating the power of vision – vital role in helping direct, align and inspire actions.
    4. Under communicating the vision – It must be credible communication and a lot of it!
    5. Permitting obstacles to block the vision – proclaiming failure is not an option.
    6. Failing to create short-term wins – real transformation takes time. Be patient, celebrate baby steps.
    7. Declaring victory too soon – Changes need to sink into the organization’s culture. New and innovative approaches are fragile, so reinforce them frequently. Communicate the milestones but keep eyes on the end goal.
    8. Neglecting to anchor the change into the organization’s culture – Until new behaviors are rooted in the organization’s shared values, they are always subject to falling back to old ways. Anchoring means building the change into the next generation of management and leadership.

    None of these leadership mistakes would be that costly in a slower moving and less competitive and complicated world. Handling changes quickly is not imperative in a relatively stable economy or controlled environment. But the problem for most organizations today is that stability is no longer the norm. And most experts agree that over the next few decades the business environment will be more volatile than most of us want to believe or deal with. Change is inevitable, but errors in leading change are not. With awareness and skill, leaders can guide their organizations by instituting mitigation efforts designed to embrace the change and meet it head on. Agricultural cooperatives have met the needs of many over the years by offering consistent and reliable services. But if they are to survive change, leadership must drive the process forward in a socially and economically healthy way. Leading change means that “change” will not deter progress. And when it raises its ugly head, change will not dismantle a business model that does so good for so many. 

    References:

    Kotter, J.P. (2012). Leading Change. Harvard Business Review Press. Boston: MA


    Friend, Diane. “Leading Change in Your Cooperative.Southern Ag Today 3(47.5). November 24, 2023. Permalink
  • Historic Research Yields Modern Solutions

    Historic Research Yields Modern Solutions

    The Land Grant University System has a historic tradition of the combined missions of teaching, research, and extension.  In fact, Southern Ag Today was born out of a collaboration of Extension Economists across the Southern region.  The Old Rotation at Auburn, is a great example of Land Grant history and continued relevance.  As cited from the National Register of Historic Places, January 14, 1988:

     The Old Rotation

    Established in 1896 by Professor J.F. Duggar, the Old Rotation at Auburn University is: 

    • The oldest, continuous cotton experiment in the U.S.
    • The 3rd oldest continuous field crop experiment in the U.S.
    • The 1st experiment to demonstrate the benefits of rotating cotton with other crops to improve yields and utilize nitrogen-restoring legumes in a cotton-production system. It continues to document the long-term effect of these rotations in the same soil.

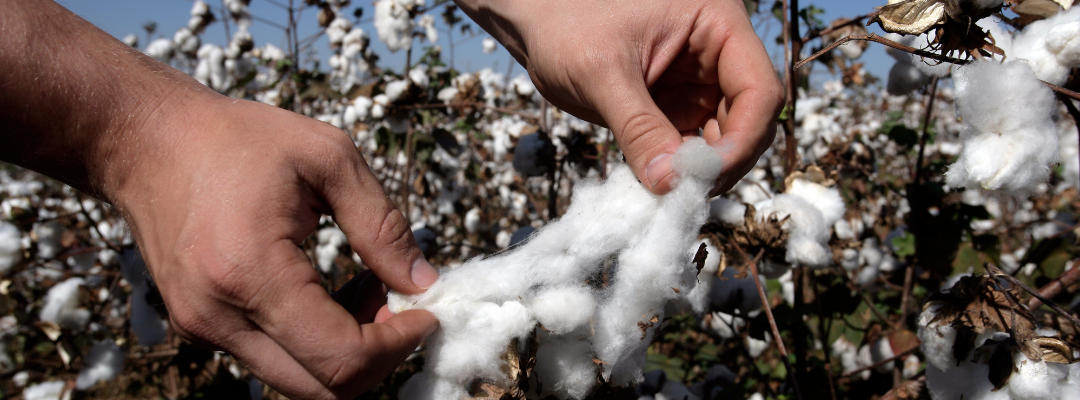
    The Old Rotation has had 128 years of cotton planted in the same soil and provides valuable insight into cover crops and crop rotation, and one of the original objectives of utilizing legume cover crops is significant today.

    Table 1 shows yields from 1896 through 2023 from plot # 6 and plot # 8  (there are a total of 13 plots with different treatments). Plot # 6 has been planted to continuous cotton with no additional Nitrogen (N) fertilizer and no cover crop.  Plot # 8 was also planted in continuous cotton with no added N, but included a winter legume cover crop consisting of crimson clover and hairy vetch.  The plots have otherwise been treated the same over the research period.  It is also important to note that these are non-irrigated plots; there are years with very low or no yields; and the yields have increased significantly due to improved management practices and genetics. 

    The yield difference over the last 100 years is clear and substantial.  However, the yields between 1896 and 1921 were virtually the same, so it took some time for the net benefit of the practice to accumulate.  Much has changed about cotton production in 128 years, but the history of The Old Rotation suggests the reasonable conclusion that good soil and fertility management (or the lack of) is a long term game.    

    With more emphasis on improving soil health and reducing fertilizer costs in the Southern region, looking at long term research helps to provide solutions.

    More information about the Old Rotation can be found at: https://agriculture.auburn.edu/research/cses/the-old-rotation/


    Runge, Max. “Historic Research Yields Modern Solutions.Southern Ag Today 3(47.3). November 22, 2023. Permalink

  • It’s Turkey Time!

    It’s Turkey Time!

    We might not think much about turkey prices and production much of the year, until now.  Thanksgiving is when turkey gets all the center of the plate attention.  Record high turkey prices raised a lot of eyebrows last year.  High Pathogenic Avian Influenza (HPAI) cut supplies leading to higher prices.  The unexpected HPAI impact was on top of reduced production driven by a lack of profitable production.  

    Those record high prices spurred production increases in 2023.  Halfway through November, turkey production is 5.5 billion pounds, up 4 percent from the same period last year.  It’s worth pointing out that while production is higher than last year, third quarter production is the smallest since 2015 (not counting last year) which was the last time we had a major HPAI outbreak.  Production for 2023 will be higher than last year but is still likely to be the second smallest production year since 2000.

    Prices have responded to increased production by falling dramatically.  Frozen tom turkeys weighing 16-24 pounds were $0.88 per pound, 50 percent lower than last year in mid-November.  Smaller frozen hens were 44 percent lower than last year.  Fresh whole birds are normally higher priced than frozen birds.  Fresh hens were $1.47 per pound in mid-November compared to $1.88 last year. 

    USDA reports retail turkey prices featured or on special at more than 29,000 retail, grocery stores around the country.  Turkey item specials normally ramp up right before Thanksgiving and this year is the same with 72.5 percent of stores reporting some feature on a turkey item.  That is compared to 56.3 percent of stores last week.  Featuring is a little slower than last year when 86 percent of stores had some feature.  USDA defines specials as a sale with some kind of “no price” or a buy one, get one free special.  Twelve percent of stores had a special advertised this year compared to only 4 percent last year.  So, while there are slightly fewer features, there are more buy one, get one free specials this year.  Grocery stores often use turkeys to boost sales throughout the store, so, you may pay a lot less for your turkey than quoted wholesale prices.  

    Us livestock economists at SAT have a lot to be thankful for this year.  We hope you have a great Thanksgiving!

    Anderson, David. “It’s Turkey Time!Southern Ag Today 3(47.2). November 21, 2023. Permalink

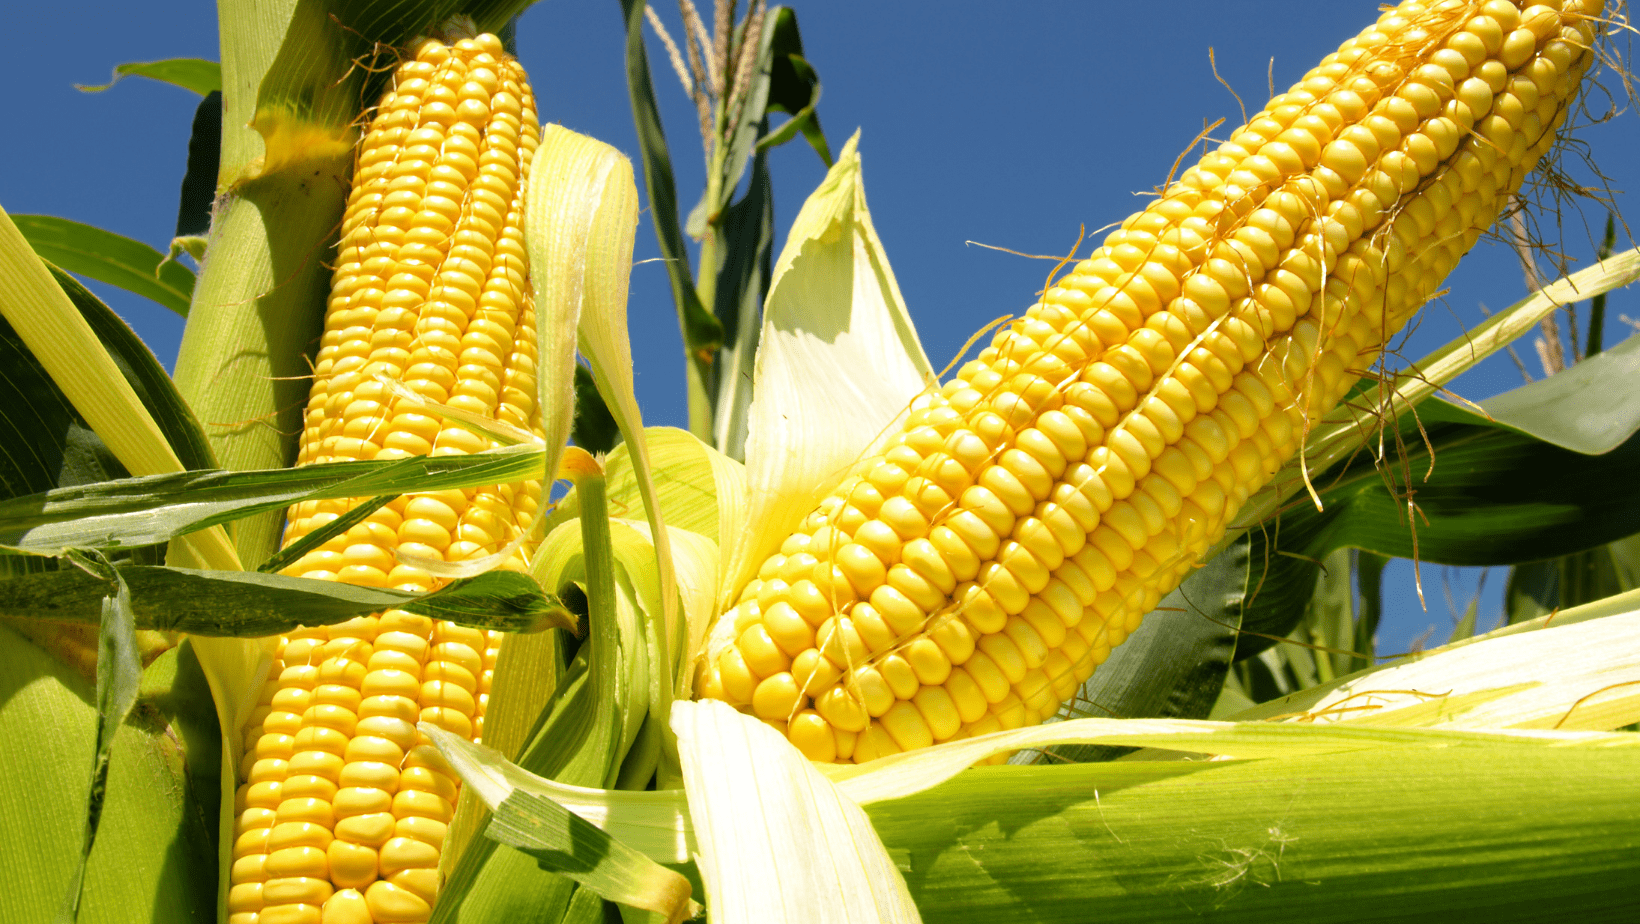
  • Corn Price Prospects When We Start the Year with a 2-Billion-Bushel Carryover

    Corn Price Prospects When We Start the Year with a 2-Billion-Bushel Carryover

    USDA’s supply and demand balance sheet for U.S. corn has a feature not seen in the corn market since the beginning of the 2019 growing season: carryover from the previous crop exceeding 2 billion bushels. That level of beginning stocks has a significant price moderating effect. In inflation adjusted 2023 dollars, the season average farm price has not been higher than $4.33 per bushel in the three years since 2006 during which beginning stocks exceeded 2 billion bushels. 

    Figure 1. Corn beginning stocks and that season’s average real cash farm price ($2023)

    Source: USDA, WASDE

    With a 2024 average yield of 180 bushels per acre (trend line estimate), planted acres could decline from about 95 million in 2023 to just over 87 million in 2024, and the total supply of corn from one season to the next would be little changed. 

    Table 1. 2023 U.S. corn supply forecast and 2024 alternative projection

    SeasonUSDA November 2023 Forecast 2024 Alternative ProjectionChange
    Planted, mil ac94.987.9-7.0
    Harvested, mil ac87.180.3-6.8
    % Harvested91.891.3-0.5%
    Yield, bu/ac174.91805.1
        
     Million bushels
    Beginning Stocks1,3612,156795
    Production15,23414,445-789
    Imports25250
    Total Supply16,62116,6265

    Of course, supply is only one side of the balance sheet. Lower corn prices could stimulate increased corn use.  But planted acreage above 87 million would also significantly augment the corn supply.  In the recently released long-term projections, USDA projects planted corn acreage in 2024 at 91.0 million, a yield of 181.0 bushels per acre, and ending stocks (beginning stocks for the 2025 growing season) of 2.616 billion bushels, the most since 1988 (USDA, 2023).

    We are just closing the bin door on the final bushels of the 2023 corn crop, but it is not too early to evaluate pricing opportunities for the 2024 corn crop given projections (what might happen) and forecasts (what we expect to happen) around acres, yield, and use. 

    References

    USDA, Office of the Chief Economist, World Agricultural Supply and Demand Estimates, November 9, 2023. USDA. Long-term Agricultural Baseline Projections, November 7, 2023, available online at https://www.usda.gov/oce/commodity-markets/baseline


    Welch, J. Mark. “Corn Price Prospects When We Start the Year with a 2-Billion-Bushel Carryover.Southern Ag Today 3(47.1). November 20, 2023. Permalink

  • What Is Driving Native Plant Sales?

    What Is Driving Native Plant Sales?

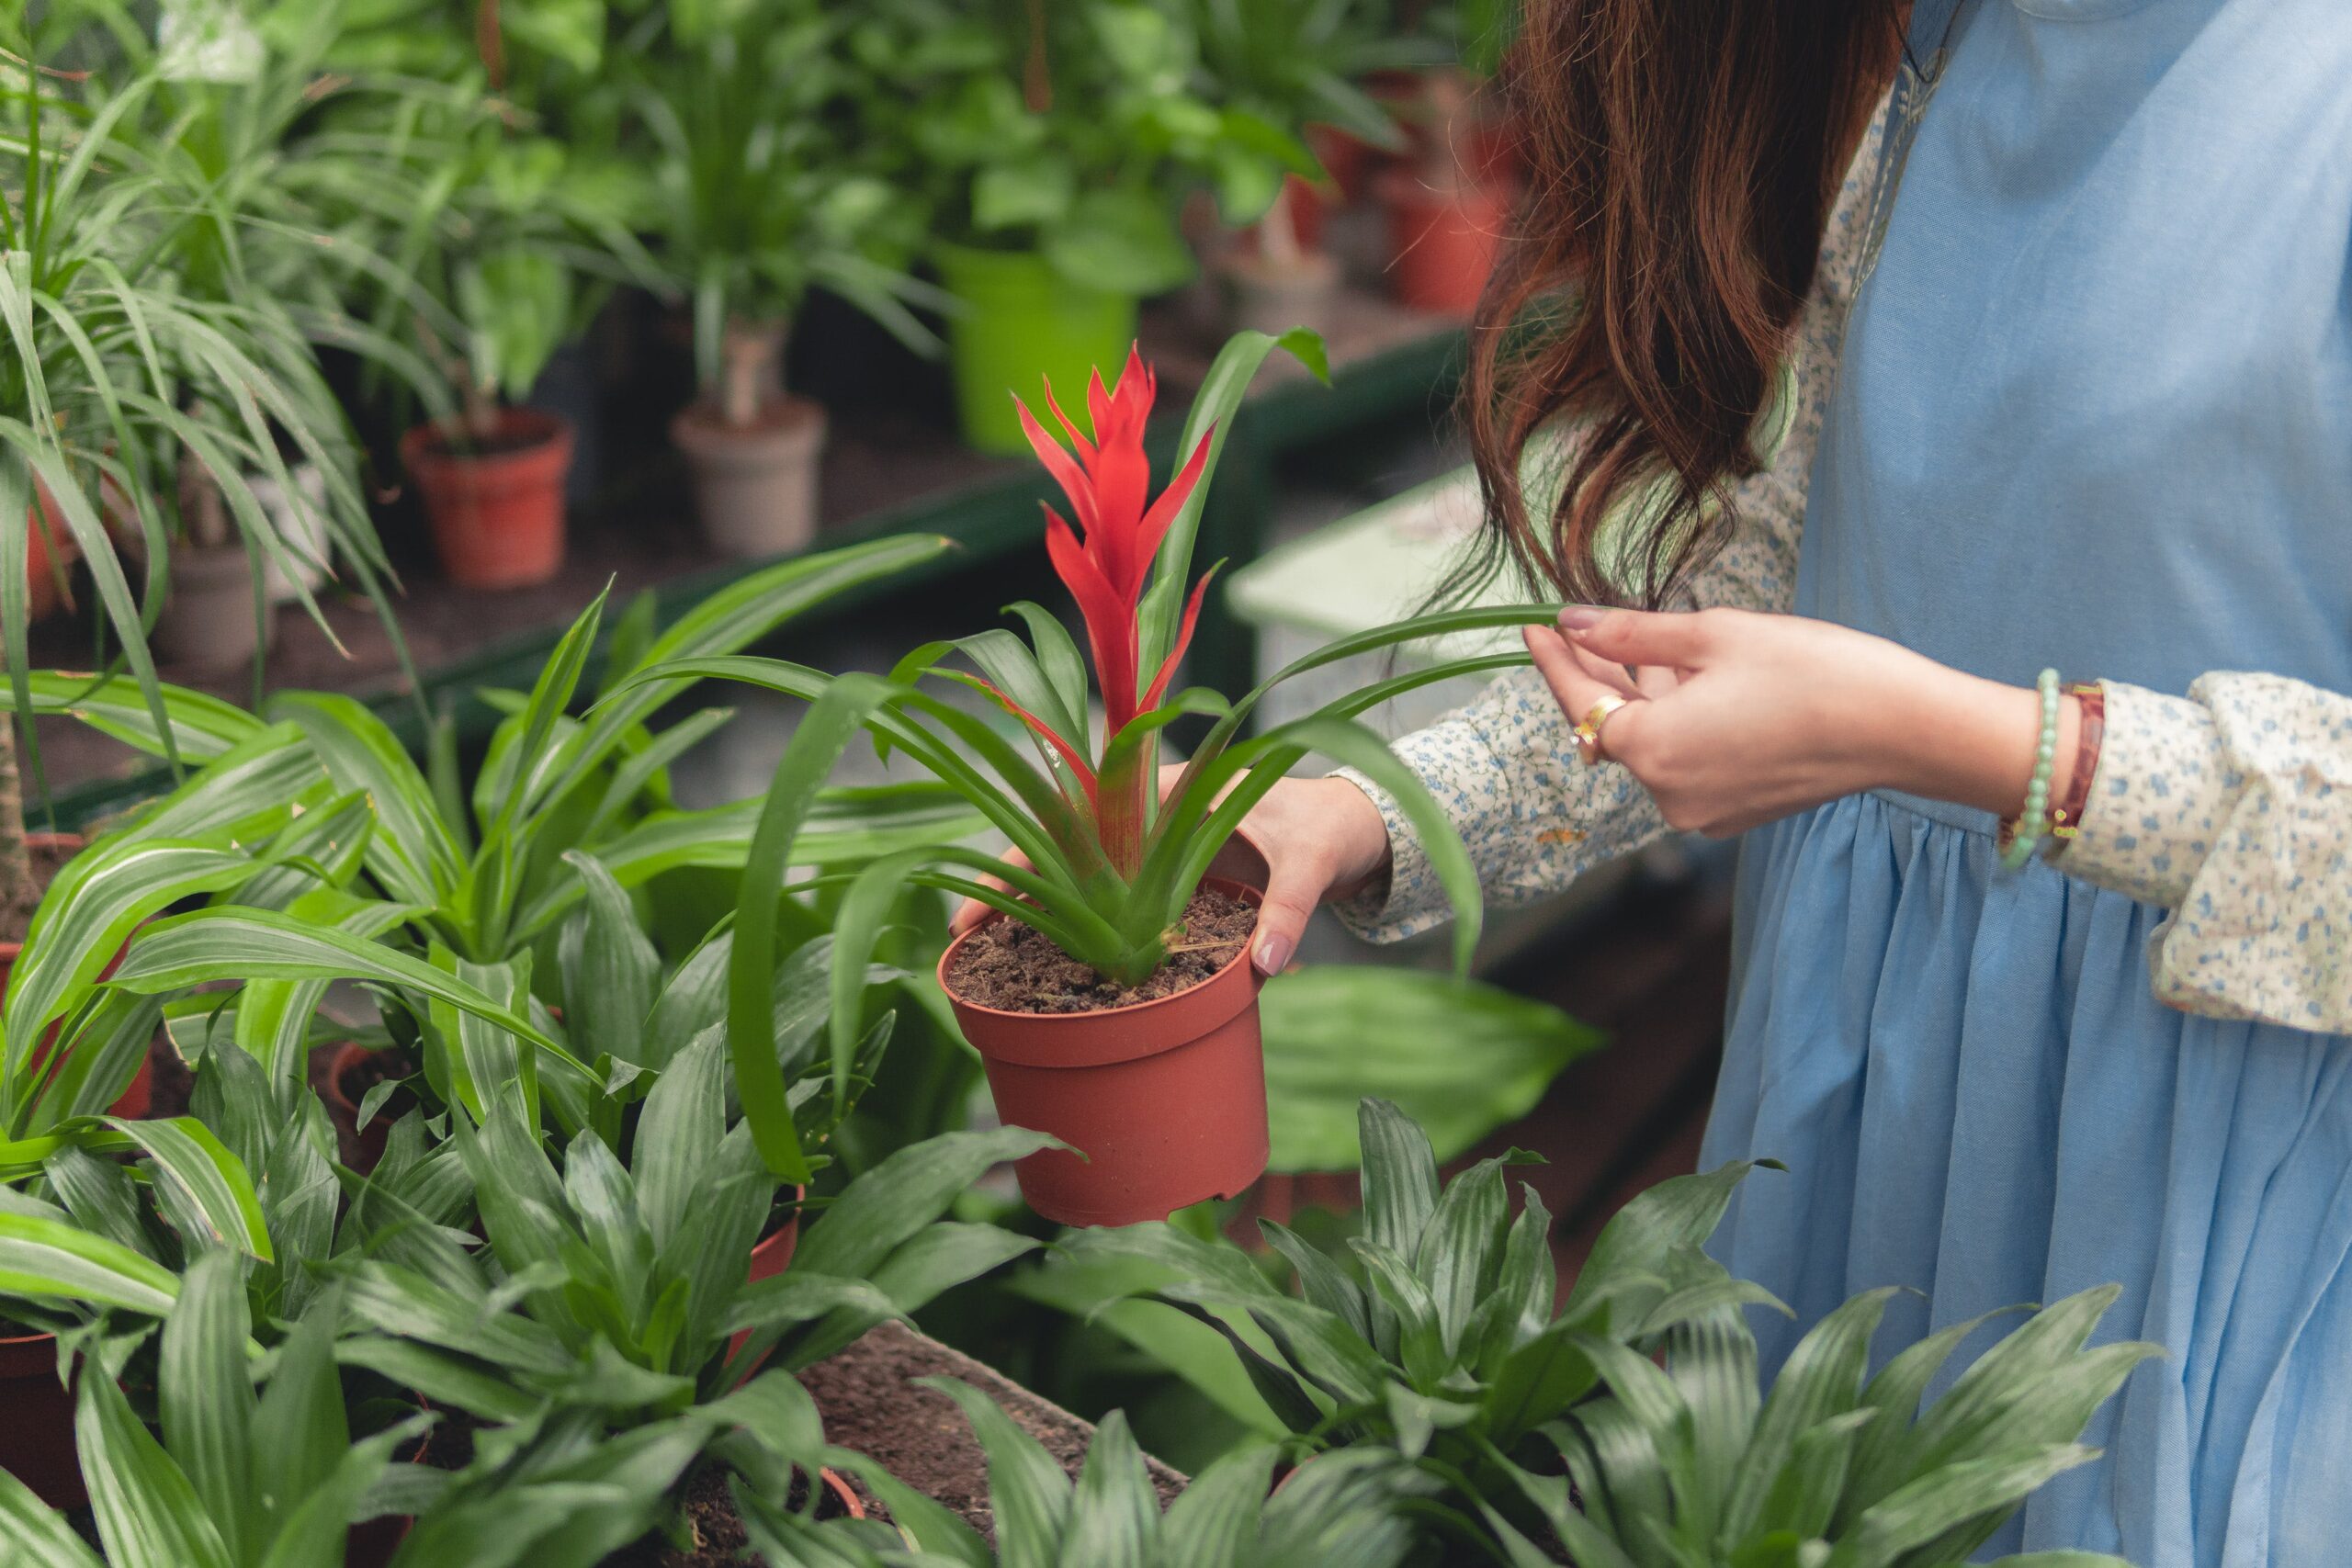
    In the U.S., native plants are defined as being present prior to European settlement and “have evolved and occur naturally in a particular region, ecosystem, and habitat” (U.S. Forest Service, 2023). As a result, native plants are often associated with numerous ecological and production benefits, including reduced inputs (fertilizer, irrigation, pesticides), improved biodiversity, increased pollinator foraging and habitat sources, and so forth. When considering the ornamental plant market, native plant sales and demand have increased. Consumers are actively seeking them in the garden center and will drive further distances to shop at native plant retailers. What makes these products so interesting to customers? In 2022, we addressed this question using an online survey of 2,066 U.S. consumers. 

    Most of the sample (58%) had purchased native plants in the previous year, 25% had not purchased native plants, and 17% did not know if they had purchased native plants. Of those participants who did not purchase native plants, their uncertainty was primarily driven by seeking other plant attributes (e.g., aesthetics, care requirements, availability), followed by lack of familiarity and knowledge. Regarding the motivations behind purchasing native plants, many of the motivations focused on ecological benefits or aesthetic preferences (Table 1). The largest portion of the sample indicated that benefiting pollinators was the primary reason they purchased native plants. For several years, consumers have identified pollinator friendly promotions as one of the top important benefits of plants (behind aesthetics and quality) that influences their purchasing behavior. Complementing the previous plantings/gardens was second, followed by natural habitat restoration, aesthetics, and wildlife benefits. Motivations that were selected less frequently were related to marketing (recommendations, availability, media exposure, social media) and solving problem areas in the landscape (water gardens, difficult planting sites).

    Table 1. U.S. Consumer Motivations to Purchase Native Plants in 2022 (n=2066)

    Consumers are also actively seeking native plants using different retail outlets than those traditionally used by gardeners. Historically, home improvement centers have dominated the ornamental plant retail market, followed by mass merchandisers, garden centers, and hardware stores (Whitinger and Cohen, 2021). These are still the primary players when considering ornamental plants in general. However, when purchasing native plants, participants indicated they frequent stores that specialize in ornamental plant sales. Specifically, they seek native plants at single-location retail garden centers the most, followed by directly from nurseries or greenhouses, home improvement centers, multiple-location garden centers, and then mass merchandisers. This may indicate that they view native plants as niche products and need to visit specialty stores to find natives and have a wider selection of products. Industry trends have identified an uptick in sales from these outlets relative to years past (Whitinger and Cohen, 2021). 

    Moving forward, as consumers are spending their money on items (including plants) that they perceive as more sustainable, focusing on production methods and products that meet those needs will be increasingly important. There is also an opportunity to improve traffic to retail garden centers through promoting the availability of these products to the end consumer.

    References:

    Whitinger, D. and P. Cohen. 2021. National Gardening Survey 2021 Edition: A Comprehensive Study of Consumer Gardening Practices, Trends, and Product Sales. National Gardening Association. 

    U.S. Forest Service. 2023. What Are Native Plant Materials? Available online at https://www.fs.usda.gov/wildflowers/Native_Plant_Materials/whatare.shtml, accessed 20 August, 2023.

    Acknowledgements: Funding for the project was provided by the Horticulture Research Institute (HRI). Its contents are solely the responsibility of the authors and do not necessarily represent the views of HRI. Collaborators include Ariana Torres (Purdue Univ.), Sue Barton (Univ. of Delaware), and Bridget Behe (Michigan State Univ.).


    Photo by Hassan OUAJBIR: https://www.pexels.com/photo/woman-wearing-blue-dress-holding-flower-pot-2232566/

    Rihn, Alicia . “What Is Driving Native Plant Sales?Southern Ag Today 3(46.5). November 17, 2023. Permalink