Blog

  • Angola: U.S. Chicken Exports Facing Increasing Competition in this Leading Market 

    Angola: U.S. Chicken Exports Facing Increasing Competition in this Leading Market 

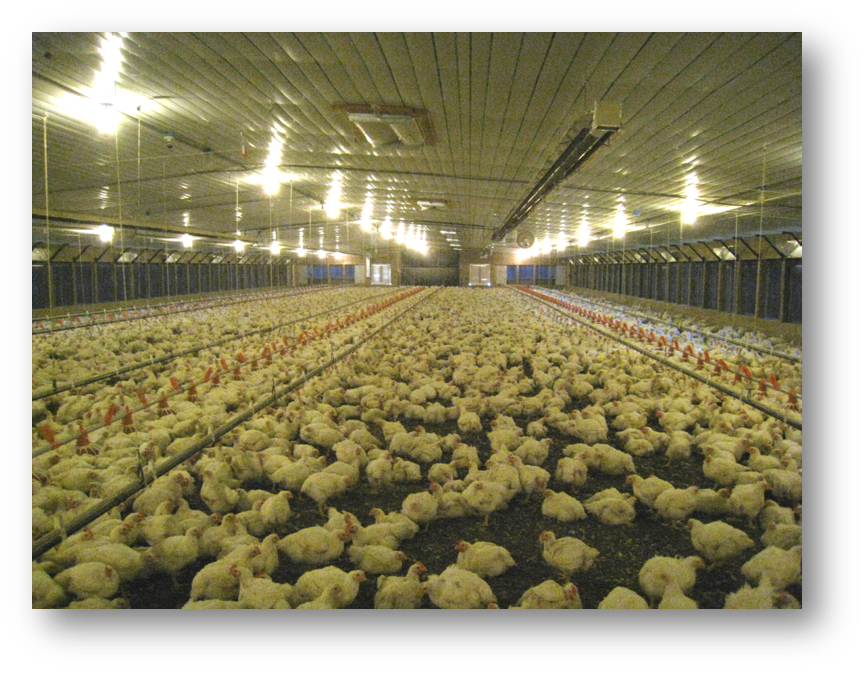
    The U.S. is the largest chicken meat producing country in the world. According to the U.S. Department of Agriculture, production in 2022 was almost 21 million metric tons (MT) (ready to cook equivalent), with the next largest country (Brazil) producing around 14.5 million MT. While most of this production is consumed domestically, between 10% and 20% of total production is exported each year (USDA, 2023a). In 2022, U.S. exports of poultry products – including chicken, turkey, and other fowl – accounted for $6 billion in global sales, making poultry products a top ten U.S. agricultural export. The leading poultry export for the U.S. is frozen chicken leg quarters (henceforth leg quarters), which accounted for $1.9 billion in export sales in 2022, nearly a third of all U.S. poultry exports (USDA, 2023b).

    Important to U.S. poultry exports is the country of Angola, which is located on the western Atlantic coast in the South African region. In 2022, Angola was the leading foreign destination for U.S. leg quarters in terms of value ($219 million) and the second largest foreign market in terms of volume (168 thousand MT). However, U.S. leg quarter exports to Angol have varied significantly over the last decade (See Figure 1), decreasing from a peak in 2014 ($243 million) to only $83 million in 2016. After 2016, U.S. exports recovered but immediately fell again during the pandemic in 2020. Since 2020, U.S. leg quarter exports to Angola significantly increased to $219 million in 2022. However, as Figure 1 shows, this was mostly due to higher chicken prices.

    Unfortunately, the U.S. is facing increasing competition in Angola from rising domestic production as well as competition from Brazil. In 2022, for instance, Angola’s imports of frozen chicken cuts (including leg quarters, other cuts, and offal) from the U.S. were up 23% (volume) in 2022, whereas imports from Brazil were up 32% (UN Comtrade, 2023). Despite U.S. leg quarter exports to all destinations being down by only 8% in terms of volume in 2023 (year-to-date as of August), exports to Angola were down 25% (USDA, 2023b). Figure 2 shows Angola’s frozen chicken cut imports in 2021 ($201 million) by exporting source. The U.S. was the leading supplier, accounting for 63%; Brazil accounted for 22%. 2023 year-to-date data for the U.S., as well as 2022 data for Angola, suggest that Brazil will likely account for more than a third of total imports by the end of 2023, while the U.S. share will likely decrease to slightly more than 50%.

    Figure 1. U.S. frozen chicken leg quarter exports to Angola: 2010 – 2022

    Source: U.S. Department of Agriculture (USDA, 2023b).

    Figure 2. Angola frozen chicken cuts imports (including leg quarters, other cuts, and offal) in 2021 by Source ($201 million)

    Source: Observatory of Economic Complexity (OEC) (2023).

    References

    Observatory of Economic Complexity (OEC). 2023. https://oec.world/en

    United Nations Comtrade Database (UN Comtrade). 2023. https://comtradeplus.un.org/

    U.S. Department of Agriculture (USDA). 2023a. Livestock and Poultry: World Markets and Trade. Foreign Agricultural Service, Washington, DC.

    U.S. Department of Agriculture (USDA). 2023b. Global Agricultural Trade System (GATS). Foreign Agricultural Service, Washington, DC. https://apps.fas.usda.gov/gats/default.aspx


    Muhammad, Andrew, and Md Deluair Hossen. “Angola: U.S. Chicken Exports Facing Increasing Competition in this Leading Market.Southern Ag Today 3(44.4). November 2, 2023. Permalink

  • South-Wide Timber Market: Pine Sawtimber Prices Stabilize as Pulpwood Prices Continued to Decline 

    South-Wide Timber Market: Pine Sawtimber Prices Stabilize as Pulpwood Prices Continued to Decline 

    The South-wide average pine sawtimber stumpage price has held steady during the third quarter of 2023, showing no significant fluctuations when compared to the levels observed in the previous four quarters. Pine sawtimber prices in the region averaged $25.98/ton. ranging from approximately $20/ton in Virginia to $32/ton in Florida (TimberMart-South, 2023). The figure was roughly $2/ton lower than the recent high in early 2022 but remained $2/ton above the pre-pandemic level. South-wide average hardwood sawtimber price rebounded slightly to $32.39/ton after three consecutive quarters of decline. 

    The recent decline in pine sawtimber prices can be attributed primarily to the softened demand for lumber. Pine sawtimber prices had a rally from mid-2020 to early 2022, primarily driven by robust demand for lumber. However, factors such as rising interest and mortgage rates, deteriorated housing affordability, and worries of an economic slowdown have cooled the general housing market since then. Single-family housing starts —a major driver for lumber and structural panel products— in September were at a seasonally adjusted annual rate of 963,000 units, falling below the long-term average of 1.1 million units.  

    The South-wide average stumpage prices for both pine pulpwood and hardwood pulpwood fell sharply over the past four quarters. Pine pulpwood stumpage prices averaged $7.59/ton in the third quarter of 2023. This represented a significant 21% year-over-year decline and a substantial 31% drop from the recent high recorded in early 2022. The decrease in wood fiber prices can be attributed to several factors, including the product shift in the paper sector, a rise in the utilization of recycled fiber, and a surge in the supply of mill residues resulting from recent expansions in lumber mills. The decline was even more pronounced in certain timber regions (e.g., South Carolina and Western North Carolina) due to the recent closure of paper mills. 

    The average delivered prices for sawtimber and pulpwood products fared relatively better than their stumpages prices, with only slight year-over-year declines in the range of 2% to 5%. Notably, the gap between delivered and stumpage prices for all timber products has significantly widened since 2020. The widening gap can be attributed to multiple factors, including inflation in fuel and material prices. Furthermore, the persistent decline in the logging crew of the region has played a significant role in the margin increase. Employment in the logging industry dropped 34% from 38,200 in 2000 to 25,300 in 2022 (U.S. Census Bureau, 2023). While improvements in productivity have helped mitigate some of the losses, this ongoing downward trend has left a lasting impact on the industry and the delivered prices.

    Looking forward, pine sawtimber prices in the South are expected to continue its slow recovery from the 2008-2009 recession, driven by the anticipated growth in single-family housing starts and the expanding lumber production in the region. The historical low in existing housing inventory, coupled with homeowners maintaining their properties with low-rate financing, highlights the pressing need for the expansion of the new housing market in the foreseeable future. 

    Softwood lumber production capacity in the South has increased 25% since 2017 and reached 26.9 billion board feet (bbf) in 2022 (Forisk, 2022a). Announced greenfield construction and existing mill expansion suggest that the capacity could reach 28.5 bbf by 2025 (TimberMart-South, 2023; Forisk, 2022b). However, the 10-year accumulation of underbuilding and the resulting oversupply of sawtimber will likely continue to put downward pressure on pine sawtimber prices. Pine pulpwood prices are likely to remain flat or trend lower as lumber production increases and the structure change in the paper sector continues. 

    It is important to note that timber markets are largely local. Timber prices for a specific timber stand are influenced by various factors, including the timber species, quality and size of the trees, site accessibility, local timber inventory, mill types and capacities, logging capabilities, transportation capacity, and many other local considerations. 

    References

    Forisk. 2022a. Forisk North American forest industry capacity database.

    Forisk. 2022b. Forisk Research Quarterly: Fourth Quarter 2022.

    TimberMart-South. 2023. Market news quarterly. 

    U.S. Census Bureau. 2023. QWI Explorer. 

  • Producers Embrace USDA’s Livestock Risk Protection Program

    Producers Embrace USDA’s Livestock Risk Protection Program

    Producers across the United States and the Southern States are increasingly adopting the Livestock Risk Protection Program, commonly known as LRP. This program, which is designed to protect ranchers against falling cattle prices, has witnessed a remarkable surge. From a mere 71 thousand head covered in 2017, the usage of LRP has increased rapidly to 5.2 million head by October 2023. In 2022, ranchers insured 3.4 million head, up from 1.8 million in 2021. Ranchers’ use of LRP in the Southern region has contributed significantly to this growth (Figure 1). As of October 2023, ranchers have insured approximately 1 million head annually through the LRP program, with Texas and Oklahoma insuring 56% and 34% of this total, respectively.

    Figure 1: LRP Usage in the Southern States

    This increase occurs alongside increases in subsidy levels and other changes to LRP and the significant improvement in the market feeder and live cattle prices (Figure 2). During 2019 and 2021, the USDA introduced several modifications to the LRP program. These changes not only reduced the producers’ portion of premium payments but also allowed them to defer premium payments until the end of the endorsement period. The option to pay premiums at the ending date offers ranchers a considerable cash-flow advantage. Another benefit of the LRP program is it doesn’t require a minimum number of cattle to be insured, meaning cow-calf or stocker producers with just a few head can use it.

    Additionally, the rise in cattle prices has emphasized the importance of implementing a solid price risk management plan. LRP can help minimize financial losses, secure profit margins, and reduce the risk of business failure, particularly in the face of higher investment levels. The increased adoption of LRP reflects a growing number of ranchers who are utilizing risk management plans in their operations.

    Figure 2: LRP Head per Year and Feeder and Live Prices per Month

    Source: USDA – RMA. Livestock Risk Protection Participation. https://www.rma.usda.gov/Information-Tools/Summary-of-Business/Livestock-and-Dairy-Participation


    Abello, Pancho. “Producers Embrace USDA’s Livestock Risk Protection Program.Southern Ag Today 3(44.2). October 31, 2023. Permalink

  • How Market Dynamics Separate World and U.S. Rice Export Prices

    How Market Dynamics Separate World and U.S. Rice Export Prices

    In the international rice arena, much of the attention has been focused on the Indian Government’s July 2023 decision to ban non-basmati white rice exports. This is significant to the global rice market as India is the world’s largest rice exporter. The USDA reports India’s 2022-2023 marketing year share of total global rice exports at 40%, as shown in Figure 1 (USDA ERS, FAS, 2023). India has dominated the international market for some time due to low domestic prices and high stocks – resulting from a bevy of trade-distorting subsidies – which allows India to offer rice at substantially lower prices to international buyers. Almost half of India’s exports are non-basmati parboiled rice, with the ban affecting approximately 15% of global rice trade. 

    The decision by India to ban rice exports was a means of countering rising food inflation and ensuring sufficient domestic supplies heading into an election year. Also factoring into the government’s decision were uncertain weather conditions attributed to El Niño (warming conditions and potential drought). Indian rice stocks remain plentiful, due in part to their much-scrutinized subsidization policy for rice.  The non-basmati rice ban has not been the only policy action on rice taken by India over the last year.  In September 2022, India banned exports of broken kernel rice and placed 20% tariffs on rough rice, brown rice, and regular milled white rice.  In August 2023, a 20% tariff was placed on parboiled rice exports through mid-October and a $1,200 per ton minimum export price was placed on basmati rice. 

    The Indian government has insulated Indian rice farmers from falling domestic rice prices. It sets market support prices and subsidizes crop inputs like fuel, fertilizer, and water to support farmer incomes and lower food prices. In April 2023, a consortium of grain exporting countries, including the U.S., filed a second counter notification at the World Trade Organization, formally challenging India for obscuring the true level of price supports and subsidies it provides for its wheat and rice producers (USA Rice, 2023).

    While policy decisions by the Indian government have had an impact on global rice prices, the question remains: Will U.S. rice prices see support from this policy-induced market shock? The short answer is ‘not immediately – but opportunity might exist later in the year.’ 

    Global rice prices can support the domestic market to a certain degree as a result of trade flows of both Indian and U.S. rice. Rice exports from India are primarily destined for African countries (e.g., Benin, Senegal, Kenya, Togo, Guinea, and the Ivory Coast). These countries predominantly import broken rice, which is much cheaper than milled rice. In addition, the Philippines, Malaysia, and Vietnam are also reliant on Indian rice exports. Whereas, for the U.S., major rice markets include Mexico, Canada, Haiti, and Latin America. Mexico is primarily a buyer of U.S. rough rice. The Middle East is a region that imports from both the U.S. and India. However, sales to the Middle East – while important – are not ‘core’ markets for U.S. rice. 

    The USDA FAS reports that Thai, Vietnamese, and Pakistani export rice prices have increased (Figure 2) because of the Indian ban as countries begin to cover their needs, raising concerns that other countries will also restrict or ban exports (notably, Myanmar recently announced that it was temporarily restricting exports). Thai export prices had risen rapidly from late July through mid-August, peaking at about $650 per ton. Currently, Thai prices are quoted at $595 per ton. Like Thailand, Vietnamese export prices rose quickly but have since retreated to $616 per ton. Asian buyers are holding off from making purchases in hopes that prices continue to fall. U.S. rice export prices for No. 2 4% broken long grain milled rice remain quoted at $760 per ton, unchanged since late January and the highest since October 2008. U.S. quotes for Latin American markets were also unchanged since late January at $725 per ton. Indian price quotes have been unavailable since the start of the export ban which came into effect on July 20th. Prior to the ban, India rice was quoted around $450 per ton.

    Expectations of a significant increase in U.S. rice supplies has helped keep U.S. rice prices stable. However, the export ban in India ultimately will benefit U.S. rice producers in the short run with stronger U.S. export demand likely developing in the Middle East (e.g., Iraq). U.S. rice may also be able to secure additional exports into the Caribbean and Central and South American markets which will contribute to capturing lost market share. U.S. rough rice sales to other Latin American markets are expected to increase in 2023/24. In the previous marketing year, the U.S. saw significant erosion of its market share in Mexico to South American suppliers, mostly Brazil, due to their more competitive prices. Long term, high global prices will increase global rice production. Growing stockpiles of rice in India – compounded by India’s extensive use of trade-distorting subsidies – will ultimately be dumped on the world market, thus causing world rice prices to over-correct (CoBank, 2023).

    Figure 1. Global Rice Exports, by Country Share (%), USDA FAS. 

    Figure 2. Weekly FOB Export Quotes ($/ton) for Long Grain Milled Rice, USDA FAS. 

    References

    CoBank. “India’s Rice Export Ban: Short-Term Benefit, Long-Term Challenge for U.S. Rice”. August 17, 2023. 

    USA Rice Federation. “India’s Rice Subsidies Under Fire at WTO by U.S., Thailand, and Others”. USA Rice Daily, April 6, 2023. 

    USDA Economic Research Service (ERS). “Rice Outlook”, September 2023. https://www.ers.usda.gov/webdocs/outlooks/107418/rcs-23h.pdf?v=8325.4  Date Accessed: September 14, 2023. 

    USDA Foreign Agricultural Service (FAS). PSD Online.  https://apps.fas.usda.gov/psdonline/app/index.html#/app/advQuery Date Accessed: September 25, 2023.


    Deliberto, Michael. “How Market Dynamics Separate World and U.S. Rice Export Prices.Southern Ag Today 3(44.1). October 30, 2023. Permalink

  • Wetlands Protection under Swampbuster 

    Wetlands Protection under Swampbuster 

    The recent U.S. Supreme Court ruling in Sackett v. EPA appears to settle the question of where water ends and land begins under Section 404 of the federal Clean Water Act (CWA). The ruling that the CWA only covers wetlands with a continuous surface connection to a traditionally navigable waterway has been heralded by farming interests for providing clarity to farmers, presumably on decisions whether to alter wetland features on their lands. However, farmers and landowners should be reminded that wetlands conversion still may carry risks under state and other federal law, and that Sackett should not be taken as an indication that other wetlands protections will not be enforced on wetlands no longer covered by the CWA.

    Importantly, the Sackett surface connection rule does not change the federal government’s wetlands policy and regulation authority under the Swampbuster provision of the 1985 Farm Bill. Swampbuster denies eligibility for federal subsidy programs to farmers and landowners who convert wetlands, carving out an exception for wetlands converted prior to 1986. Though the Natural Resources Conservation Service (NCRS) may refer to the Army Corps of Engineers’ Wetlands Delineation Manual (the guidance document on CWA 404 determinations)  in its own determinations, the Sackett decision does not restrict NRCS to the “surface connection rule’ when identifying wetlands for purposes of Swampbuster benefit determinations.

    NRCS wetlands authority under Swampbuster was recently addressed by the 9th Circuit in Foster v. USDA. The case supports the policy that farmers can apply for reconsideration of wetlands designation, which obligates NRCS to make a new determination.

    Additionally, non-CWA wetlands may still benefit from state protections. Most southern states have laws protecting isolated wetlands, though North Carolina recently aligned state wetlands definitions with the new post-Sackett rules (Tennessee has introduced a similar measure). In short, though Sackett will likely result in fewer determinations of wetlands for purposes of CWA 404 permits, the decision should not be taken by farmers as an invitation to self-determine wetland status and the resulting consequences of draining or filling habitually wet areas on their farms.


    Brannon, Robert Andrew. “Wetlands Protection under Swampbuster.Southern Ag Today 3(43.5). October 27, 2023. Permalink