Blog

  • Do Crop Insurance Payments Help with Economic Impacts of Drought Beyond the Farm Gate? 

    Do Crop Insurance Payments Help with Economic Impacts of Drought Beyond the Farm Gate? 

    Some of the most considerable negative impacts on agricultural production are from extreme weather events. Extreme weather events include prolonged drought, record-breaking floods, and extreme temperatures. Scientists predict that extreme weather events will occur more frequently and more intensely. Drought is particularly concerning because water is already a limited resource in many regions of the United States, and the cost of accessing water can prohibit irrigation. The immediate impacts of drought can include water restrictions, brush fires, loss of recreation days due to low lake levels, and economic losses in the crop and livestock sectors. Drought does not just impact agricultural producers. It impacts the entire local community to different degrees. 

    From 2011 to 2013, the Southern United States, including parts of Texas, Louisiana, Arkansas, Mississippi, Alabama, Georgia, South Carolina, North Carolina, Florida, and Oklahoma, experienced severe to exceptional drought conditions. Severe drought (D3) is defined as dryland crops being severely reduced, stressed pasture, stressed cattle, and burn bans. As conditions worsen, drought is categorized as extreme (D4) or exceptional (D5). Exceptional drought is characterized by cracking ground, failed and abandoned crops, high costs of hay and water, scarce input supplies, herd liquidation, and increased burn restrictions. 

    Producers feel drought losses first in crop and forage losses, livestock stress, and income loss. These losses affect businesses that provide agriculture with inputs or use agricultural production to make food for animals and people. When the drought outlook is unfavorable, crop and livestock producers may not spend as much on inputs to their operation, such as seed, water, machinery, and custom harvesting. During drought, producers may not need workers. Agribusinesses like local grain elevators or cotton gins may not run as many hours. Consequently, employment and income in supporting sectors will be negatively affected. Drought effects are also felt by downstream businesses, like feedyards and wheat mills. These outcomes eventually result in higher consumer prices at the grocery store. When these effects are combined, there are substantial losses to the value of agricultural sales, employment, and profits for businesses in the economy. However, disaster relief payments or crop insurance payments can mitigate some of these effects. These payments allow producers to pay off operating lines, purchase inputs for the next season, and patronize local businesses.

    Crop insurance use is higher today than ever, going back to the establishment of federal crop insurance programs in the 1930s and even immediately following crop insurance reform in the 1980s and 1990s. In recent years, the share of eligible US crop acreage enrolled in federal insurance has been 80% or higher for most crops. Federally authorized multi-peril crop insurance (MPCI) covers the loss of crop revenues or yields resulting from drought, damaging wind or rain, deep freezes, and other natural causes is common in more drought-prone areas. MPCI also helps offset the losses for agricultural producers. But how effective are these crop insurance payments at reducing producer losses and, more generally, local economic losses due to drought or other extreme weather events?

    This case study estimates drought impacts for Tillman County, Harmon County, and Jackson County, Oklahoma. These three rural, farming-dependent counties experienced exceptional drought (D5) from 2011 to 2013 and 2022. Over the 2011 to 2013 drought period, there was a total loss of $209 million in agricultural revenue or output value. The economic loss includes reduced crop acres harvested, reduced crop yields on acres that were harvested, and reduced value of livestock herds, reflecting significant culling. After accounting for the loss to sectors that provide inputs to and purchase outputs from the impacted agricultural sectors, the total revenue loss increases to $343 million. These three counties alone experienced a loss of 3,699 full-time equivalent jobs due to drought over this period. The job losses could have occurred in several ways. For someone who works a second job seasonally in the cotton gin, that seasonal job may not be available to supplement their annual income. This translates into a loss of economic activity in the local community of 172 million dollars of value added to the economy. 

    What impact does crop insurance have on the 3-county area? These indemnity payments moderated drought impacts by 65% in agricultural output value, 62% in employment, and 58% in value-added over the entire period. Crop insurance significantly reduced economic damages for the farmers in the area, reducing the drought agricultural output value loss to 121 million dollars. For the local economy, the job loss was also reduced by more than half to 1,400 jobs. While the cotton gin may not run the additional shift, the local supply store may still be able to keep their employees at full employment. Participation in crop insurance also reduced the losses to the local economy overall, moderating losses to 71.5 million dollars for that same period. Even with insurance, these rural, agriculture-dependent areas still experienced reduced profits, jobs, and local economic activity due to drought. However, insurance policies protect against the worst drought outcomes as it is designed to do. 

    What else can a producer do to protect themselves? Other management strategies beyond crop insurance can reduce drought loss severity. Producers who diversified their production activities garnered more protection against loss in addition to protection provided by crop insurance. For example, in 2012, Oklahoma experienced a bumper wheat crop. Higher crop yields on harvested acres helped offset other crop and livestock losses. For livestock producers, 2013 brought record-high cattle prices due to the smallest national cattle herd since 1951. Of course, we broke those cattle price and inventory records again in 2023 after another drought. The ability to counter losses in one farm business activity with higher revenue in another activity highlights the potential value of whole farm risk management plans that include but are not limited to crop insurance. Consider the bars shown in Figure 1, where the relatively lower drought impacts are shown in 2012 and 2013 when other sources of income offset drought production losses compared to 2011. However, the largest driver of loss reduction was from the indemnities paid out by crop insurance. Graphically, this is the decrease from the dark orange (potential loss without insurance) to the light orange (total loss with insurance indemnities). While this was a case study for only three counties and policy effectiveness likely varies over the southern region, crop insurance is shown to be vital to American producers in cases of drought.

    Figure 1. Drought Related Revenue Loss, Profit Loss (Value Added), and Employment Loss by Year and Insurance Assumption

    The total length of the bar for revenue loss (output) and profit loss (value added), including the light and dark orange, are in millions of dollars without accounting for crop insurance. The light orange area shows the loss after accounting for the mitigating effect of crop insurance. The employment bars are in numbers of jobs in the 3-county area, with the same interpretation of the bar colors. The vertical axis measures the loss due to drought. Each result would be interpreted as a change in the potential revenue (or value added to the economy) the affected industries could have received, with a value of 0 representing no loss or gain.

    Welch, Katherine, Amy Hagerman, Dayton Lambert, and Lixia H. Lambert. “Do Crop Insurance Payments Help with Economic Impacts of Drought Beyond the Farm Gate?” Southern Ag Today 3(43.4). October 26, 2023. Permalink

  • Crop Insurance as a Safety Net for Operating Loan Obligations

    Crop Insurance as a Safety Net for Operating Loan Obligations

    Using crop insurance to guarantee debt obligation coverage is one of many ways insurance can be used as a risk management tool. Additionally, adequate crop insurance will often be a lender requirement on operating loans. Operating loans are typically revolving lines of credit that assist in covering pre-harvest expenses (e.g., seed cost, fertilizer, fuel, etc.). Table 1 below contains example revenue and pre-harvest expenses that might be incurred by a soybean and cotton producer in the southern region. Assume an example soybean producer in Crittenden County, Arkansas and a cotton producer in Lubbock County, Texas, where the farm-level soybean and cotton Actual Production History (APH) yields are equal to the state average of 50 bushels per acre and 1,196 pounds per acre, respectively. Furthermore, we assume the Projected Price for the 2024 growing season to be $12.60 per bushel for soybeans and $0.87 per pound for cotton. 

    Table 1. Simplified Sample Budget for a Southern Soybean and Cotton Producer

    Revenue  SoybeanCotton
    APH YieldPer Acre501,196
    Projected Price (USDA-RMA)$12.60/bu$0.87/lb
    Expected Revenue (446 Acres)$280,980.00$464,072.00
    Pre-Harvest Expenses
    Expected Pre-Harvest Expenses (446 Acres)$144,058.00$247,084.00
    446-acre farm size was derived from Farms and Land in Farms, February 2023 Summary. Pre-harvest expenses are derived from budgets across the southern region.

    Consider a producer who finances an operating loan to cover their pre-harvest expenses (e.g., $145,000 based on a 446-acre soybean operation). Additionally, they elect to use Revenue Protection (RP) crop insurance to guarantee a level of revenue. For example, at a coverage level of 50%, a soybean producer would be guaranteed $140,490 based on an expected revenue of $280,980 ($280,980 * 0.50 = $140,490). The question becomes, at what level will the RP guarantee cover the entire operating loan obligation in the case of a complete loss? Additionally, we consider a producer taking Catastrophic Risk Protection Endorsement (CAT) coverage that triggers in the event of a yield loss of 50% or more. CAT coverage provides producers with low-cost coverage on 50% of APH yield and 55% of the RMA projected price (Biram and Coble, 2023). We assume total yield loss (e.g., 0 bushels per acre). Tables 2 and 3 below highlight realized returns to a soybean and cotton producer net of their operating loan obligation. Returns are compared over an interest rate range of 5% to 10% (.5% increments), and RP elected coverage levels from 50% to 65% (5% increments).

    Table 2. Returns Above $145,000 Operating Loan (Soybean)

    *Note: CAT coverage levels based on data in Table 1 for yield and projected price are 25 bushels and $6.93, respectively. CAT coverage administrative fees are $655.00 for each crop per county. Per acre RP premiums for Crittenden County, Arkansas Soybeans are $7.20, $9.06, $10.51, and $13.87 for 50%, 55%, 60%, and 65% coverage levels, respectively.

    Table 3. Returns Above $250,000 Operating Loan (Cotton)

    If the dollar value within Tables 2 and 3 is positive, then operating loan debt is covered with additional funds to pay other obligations. If the amount is negative, a producer would be unable to re-pay their entire operating loan only using RP or CAT indemnities. It’s important to note that pre-harvest expenses are only an estimate. We assume an annual interest rate with the producer paying the operating loan in one lump-sum at the end of harvest; that is, if the annual interest rate is 5% and payment is made at the end of harvest (assuming 9 months) with an operating loan of $145,000, the final payment will be $150,529 (principal plus $5,529 accrued interest).  

    Crop type plays an important role in this decision since positive cash flow is heavily dependent on coverage levels and operating loan interest rates for a specific crop. Also, under no circumstance does CAT coverage ensure either producer can cover their operating loan debt at the representative loan, farm size, and crop type. Tables 2 and 3 show that operating debt coverage based on a 50% RP coverage level will be negative regardless of crop type. Increasing coverage to 60% would mean a soybean producer could guarantee covering their operating loan, while a cotton producer needs at least 65% coverage to guarantee operating debt repayment in the event of a catastrophic loss.  

    References

    Biram, H.D. & Coble, K. H. (2023). A Brief History of Crop Insurance. University of Arkansas System Division of Agriculture, Cooperative Extension Service Fact Sheet No. FSA70. (Link)

    USDA-NASS. (2023, February). Farms and Land in Farms 2022 Summary. Retrieved October 12, 2023, from https://downloads.usda.library.cornell.edu/usda-esmis/files/5712m6524/bk129p580/2z10z2698/fnlo0223.pdf.

    USDA-NASS. (2023, January 12). Arkansas Crop Production. Retrieved October 12, 2023, from https://www.nass.usda.gov/Statistics_by_State/Arkansas/Publications/Crop_Releases/Annual_Summary/2022/arannsum22.pdf.

    USDA-RMA. (2023, October 1). RMA Price Discovery. Retrieved October 12, 2023, from https://prodwebnlb.rma.usda.gov/apps/PriceDiscovery/Reports/CurrentPeriods.


    Loy, Ryan, and Hunter Biram. “Crop Insurance as a Safety Net for Operating Loan Obligations. Southern Ag Today 3(43.3). October 25, 2023. Permalink

  • More Heifers Continue to Head to Feedlots

    More Heifers Continue to Head to Feedlots

    The latest Cattle on Feed Report raised some eyebrows, showing a slight (0.6 percent) increase in feedlot inventory from last year. Placements of cattle on feed were up about 6 percent driven by higher 700-900 pound placements. In the current setting of tighter supplies and smaller calf crops, many might be rightfully surprised to see an increase in cattle inventory numbers. However, there is plenty to unpack in this report that has both short-term and long-term implications for cattle markets. 

    My first big takeaway is the strong number of heifers on feed. The quarterly breakdown of steers vs. heifers on feed was released with this report and showed that 40 percent of feedlot inventories were heifers. This is the highest percentage in over 20 years and indicates that producers continue to send many heifers to feed instead of retaining for reproduction. There are two sides to this: (1) heifers are helping to boost inventories now which could be viewed somewhat negatively for prices in the short term but also (2) fewer heifers retained means a smaller calf crop next year which can be viewed as supporting high price levels in the longer term. To me, this report shut down any ideas that herd expansion is happening or will happen in 2023, that discussion will shift toward whether expansion occurs in 2024. 

    The increase in placements is interesting because it likely reflects producers selling now to take advantage of strong markets but also some producers being forced to sell feeder cattle a little earlier than expected due to expanding drought in many areas. Looking ahead at price expectations, it is worth noting that the current strong market prices have not really reflected herd rebuilding efforts yet. The rebuilding phase will include holding back more heifers which will mean fewer heifers sold as feeder cattle. Combined with smaller calf crops as a whole, this will be the point when feeder cattle supplies get really tight and prices have the strongest supply-side support. 

  • River Levels and Off-Farm Storage Disbursement

    River Levels and Off-Farm Storage Disbursement

    This article examines how low river levels impacted off-farm storage utilization last year for the five Southern states bordering the Mississippi River (Kentucky, Missouri, Tennessee, Arkansas, and Louisiana). In particular, we look at changes in corn held in off-farm storage. USDA-NASS (2023) reports off-farm stock numbers quarterly, including bushels stored on and off-farm. Net off-farm storage disbursement can be calculated by subtracting off-farm stocks in the previous quarter. For 2022/23, corn disbursements trailed the 5-year average in the five southern states bordering the Mississippi River. Lower net disbursement was likely caused by low river levels, which increased barge freight and caused the corn basis to widen (Gardner, Biram, and Mitchell, 2023). Once river levels returned to normal, elevators tended to barge soybeans as they have a higher value on a per-bushel basis, further delaying corn shipments (USDA-NASS, 2023). Figure 1 shows aggregate corn disbursement rates for all five states compared to the 5-year average. Figure 2 further breaks down the data by state. Typically, most corn is put in off-farm storage in Quarter 1 (Q1) of the marketing year, which consists of September, October, and November. Corn is then disbursed as the marketing year progresses. 

    Figure 1 indicates that in Q2 of last year, negative disbursement occurred. Negative disbursement percentages indicate that corn was added to off-farm storage. Additional corn storage in Q2 was likely driven by river level declines, which slowed corn shipments through the Mississippi River. The bulk of corn added to off-farm storage in Q2 occurred in Louisiana and Mississippi (Figure 2). As elevators in Mississippi could not move corn downriver, they filled their storage space and stopped taking delivery, causing producers to delay harvest and “store” corn in the field. Louisiana could still utilize the river for transport. Thus, the increase in off-farm supplies in Q2 was likely driven by producers in surrounding states delivering to Louisiana from more northern states. In Q3, the basis neared normal. On a percentage basis, the states disbursed 40% (-1% less 39%; figure 1) of the corn stored in Q1, the same as the 5-year average (10% less 50%). In Q4, producers disbursed 5% (39% compared to 34% on average) more off-farm corn than average, likely allowing some producers to capture the high June prices induced by drought fears on new crop supply. Q4 disbursement rates trailed 6% below the average, indicating that close to 23.5 million bushels were carried into the new marketing year. 

    Looking ahead to the 2023/24 marketing year, river levels have again caused the basis to decline, and off-farm storage will be an important risk management tool in these five states. As river levels improve, the basis should rise to normal levels. However, slow disbursement in the first quarter of the 2023/24 marketing year may hinder basis improvement. 

    Figure 1. Aggregate Net Off-Farm Storage Disbursement for Mississippi River Bordering Southern States by Marketing Year Quarter (2022/23 vs. 5-Year average)

    Notes: States include Arkansas, Kentucky, Louisiana, Mississippi, and Tennessee. Q1 includes the months of September, October, and November. Q2 includes December, January, and February. Q3 includes March, April, and May. Q4 includes June, July, and August. Disbursement Percentages calculated in comparison to Q1.

    Figure 2: Net Off-Farm Storage Disbursement for Mississippi Bordering Southern States by Marketing Year Quarter (2022/23 vs. 5-Year Average)

    Notes: Q1 includes the months of September, October, and November. Q2 includes December, January, and February. Q3 includes March, April, and May. Q4 includes June, July, and August. Disbursement Percentages calculated in comparison to Q1.

    Sources:

    Gardner, Grant, Hunter Biram, and James Mitchell. “Low River Levels, Barge Freight, and Widening Basis.” Southern Ag Today 3(39.1). September 25, 2023. Permalink.

    USDA-NASS. 2023. Washington, DC  


    Gardner, Grant, and William E. Maples. “River Levels and Off-Farm Storage Disbursement.” Southern Ag Today 3(43.1). October 23, 2023. Permalink

  • Improving Ag Structures’ Resilience to Wind Damage

    Improving Ag Structures’ Resilience to Wind Damage

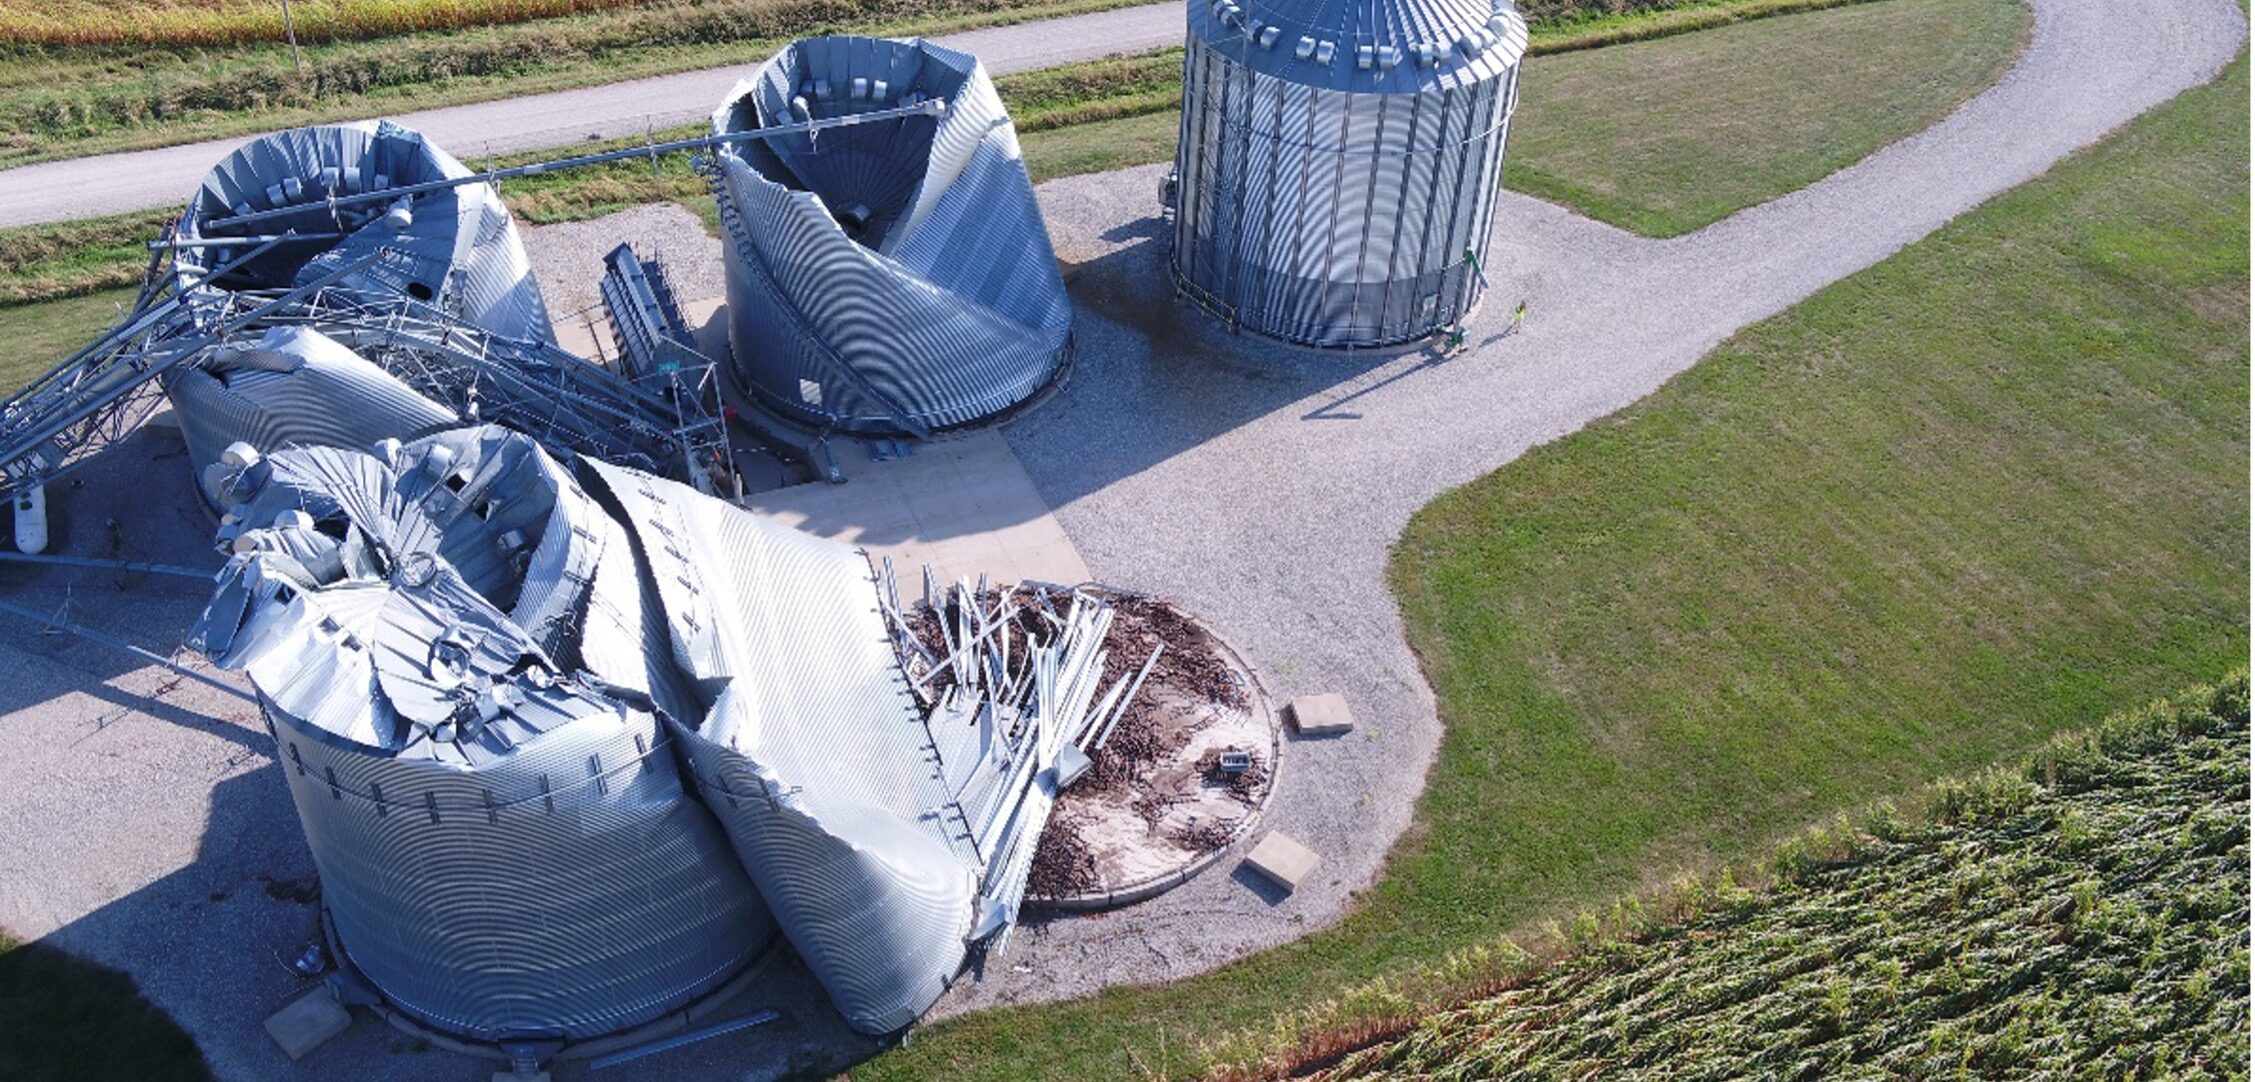
    Severe weather has long threatened farms and ranches. Such incidents, including high winds, are expected to become more frequent and more intense. Fortunately, farmers and ranchers can take steps to reduce the vulnerability of their agricultural structures to windstorms. Tips for reducing the vulnerability of existing structures include:

    • Annual inspections should include areas that may be rusted to the point of needing to be replaced as well as cracks in foundations.
    • Prior to storms, check structures for loose elements and vulnerabilities. Loose fitting lids, vents, etc. should be secured.
    • Doors and windows should be shut tightly. If they cannot be closed, they should be latched in a secure open position (e.g., metal building and Quonset hut doors should be latched closed or fully open). 
    • Structures such as movable carports used for livestock shade should be anchored for their own protection and the protection of nearby structures as well as livestock, if they are not moved to safer environments. 

    Our 2020-2022 study of farm wind damage found that only 43% of respondents’ farms had fully recovered after two years. The availability of builders and materials were most often cited for delays in construction, followed by cost and insurance coverage. On the other hand, most respondents said they and their insurance adjusters largely agreed on the level of wind damage for agricultural buildings, center pivot irrigators, and steel grain bins. Still, farmers and landowners should review their insurance policies to make sure the coverage meets current business needs.

    Most farmers surveyed in 2022 said they intended to rebuild structures with enhanced wind resistance. However, observations of their replacement structures indicate less enhancement. When replacing structures, businesses are usually balancing multiple objectives including cost, capacity needs, and availability of construction materials. Steel grain bins provide an example of trade-offs between capacity and structural integrity. Findings from our assessment of bins, computational modeling of wind loading, and review of other studies finds:

    • Taller bins and bins more exposed to wind speed (i.e., not near other buildings or other windbreaks) are more vulnerable.
    • Bins are most resilient when full of product distributed evenly throughout the structure. However, even full bins can fail at the wall-roof connection (roof damage or tear off) or experience non-structural damage (e.g., stair damage).
    • Vented bins were more vulnerable than bins without vents.
    • Steel grain bins with vertical stiffeners tend to perform significantly better during wind storms than unstiffened bins.
    • Wind rings around bins do not appear to be significantly more resilient.

    Wittich, Christine, Maria Watson, Rebekka Dudensing, Steven Klose, and Dean Mc Corkle. “Improving Ag Structures’ Resilience to Wind Damage.Southern Ag Today 3(42.5). October 20, 2023. Permalink