Southern Ag Today has recently published several articles on why producers should consider joining, starting, or becoming more involved with a cooperative in their state. An annual publication from the US Department of Agriculture’s Rural Development[i] (USDA RD) offers solid financial reasons to do the same. How does a return on investment (allocated equity in the case of a cooperative) of 11.3% to 45.2% sound? It appears that cooperatives offer a distinct advantage to farmers in their state.
How Does the South Stack Up?
The readership might be interested in a little competition (or some light post-holiday reading) – how does the US Southern Region[ii] stack up with the rest of the US? Table 12 in the report cited above provides information on cooperatives represented in each state, which are illustrated with the heat map graphics below and ranked[iii].
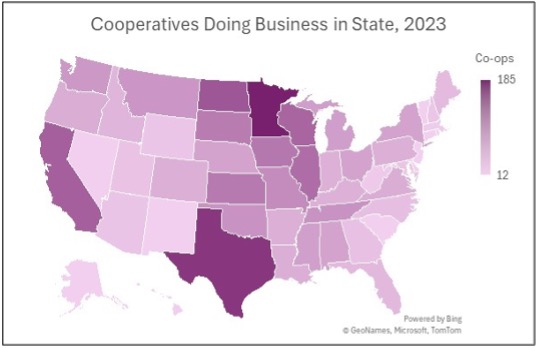
Cooperatives Doing Business in Each State
Texas (#2) pulls its weight, ranking behind Minnesota in the number of cooperatives doing business in the state. Oklahoma (#11), Tennessee (12th), Mississippi (16th), and Alabama (17Th) also make the top 20.
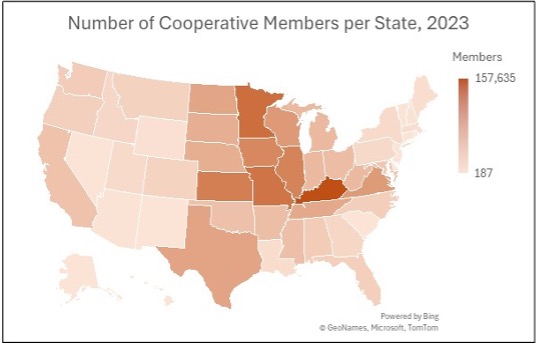
Number of Cooperative Members in Each State
Kentucky comes in first place! Virginia (#8), Texas (#9), Tennessee (#11), Arkansas (#18), Mississippi (#19), and Oklahoma (#20) combine forces to propel the Southern US into just over one-third of the top 20 placements.
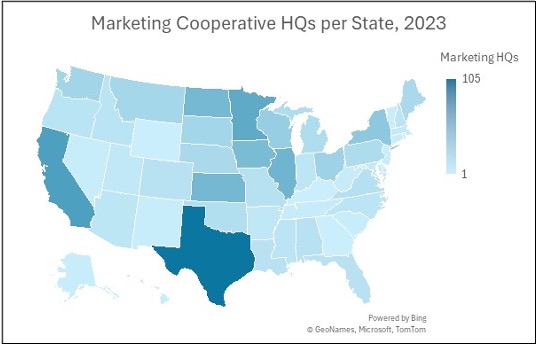
Marketing Cooperatives Headquartered in Each State
Marketing cooperatives generate their revenue from the sale of members’ products. Texas again takes the #1 spot, but only Virginia in the Southern Region makes the top 20 at #19. These results, however, may not reflect next-generation cooperatives and cooperatives organized as LLCs (i.e., peanut cooperatives in Georgia)[iv].
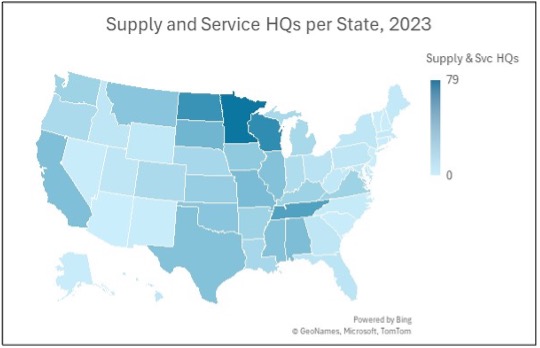
Supply and Service Cooperatives Headquartered in Each State
Supply and service cooperatives provide farmer members with what their name suggests. Southern states claim nine of the top 20 spots, with Tennessee (#4), Alabama (#6), Mississippi (#9), Texas (tied for #9), Oklahoma (#12), Arkansas (#16), Kentucky (tied for #16), Virginia (tied for #16), and Louisiana (#20).
And the Winner Is….
Honestly, anyone who is a member of a well-functioning cooperative! In terms of sheer numbers, the North Central Region is first, followed by the Southern Region in second. However, the presence of more cooperatives, their members, and specific types of cooperatives in various regions of the US is largely influenced by the types of commodities grown and the number of different commodities that can be cultivated in each region. Farm size and the density of farming operations in each location also play a role. Finally, farmers’ willingness to collaborate with other farmers seems basic, but refers to the willingness of farmers from two or three generations in the past. Many cooperatives have been around for a long time, with 78% of all cooperatives operating for more than 50 years[1].
The “well-functioning” part of a cooperative is largely due to the engagement of its members. If your farm is part of a cooperative, strive to be engaged with it by attending meetings, voting in elections, serving as a board member, and encouraging the next generation to do the same.
If you are looking to start a cooperative or improve a cooperative’s performance, many land-grant universities have specialists who help cooperatives succeed by training and developing cooperative board members and staff.
[ii] The US Southern Region, as defined by the Southern Risk Management Education Center, comprises 13 states, which account for approximately 26% of the US states (and a larger proportion of the land mass). The other regions are also defined, based on the types of crops grown in each region.
[iii] To keep things simple, this article just compares the number of states each region has in the Top 20, as the acres of farmland, number of farmers, and the volume of business through each cooperative in each region may vary significantly.
[iv] The report excludes cooperatives that deviate from the one-member, one-vote model, as well as those that handle more than 50% of their volume from non-members.
From October 1, 2025, to November 12, 2025, the U.S. federal government was largely shut down until a congressional stalemate was resolved involving appropriations legislation. The 43-day duration of this shutdown was unprecedented, but some of its effects are taking even longer to resolve.
The agricultural marketing implications of the federal shutdown included the suspension of important public agricultural data, especially near term (i.e., weekly) data. Such data are important for characterizing near term influences on cotton prices. For example, the USDA Foreign Agricultural Service (FAS) publishes a weekly export sales report for cotton (and other row crops) which serves as a useful indicator of export demand. As displayed in Figure 1, cotton weekly export sales in relation to nearby ICE cotton futures are helpful in explaining or predicting export quantities demanded.
USDA FAS weekly export sales reports resumed on November 13, but export data picked up where it left off (i.e., for September 18). Even with issuing semi-weekly reports to catch up, the normal one-week lag schedule won’t be achieved until January 8, 2026. The one-week lag schedule has the most value as a current demand indicator. But instead of a 43-day delay, we are really dealing with a 112-day delay (September 18 to January 8) until a full return to normal reporting. Thus for over a hundred days, the only market participants with knowledge of the current export demand picture were the merchandizers.
For another example, the Commodity Futures Trading Commission (CFTC) publishes weekly “Commitment of Traders” (COT) data on the positions of index funds and hedge funds in agricultural futures markets (Figure 2). The changes in these speculative futures positions have near term value in explaining fluctuations in ICE cotton futures. Like the cotton export sales data, the COT data have little explanatory power outside of a week old.
The 2025 Commitment of Traders (COT) report schedule saw significant revisions due to the federal funding lapse, leading to catch-up publications throughout the end of 2025. Reports for late October and November 2025 were pushed to December 2025, with the CFTC increasing frequency until a return to the normal reporting schedule on December 29, 2025. Beyond the direct shutdown (7 to 8 weeks) the CFTC near term publication schedule won’t be fully restored until after a 17-week period.
Thus, the disruption of valuable near-term cotton marketing data flow has been quite long, but as we enter the new year, we are finally back to a normal reporting period.
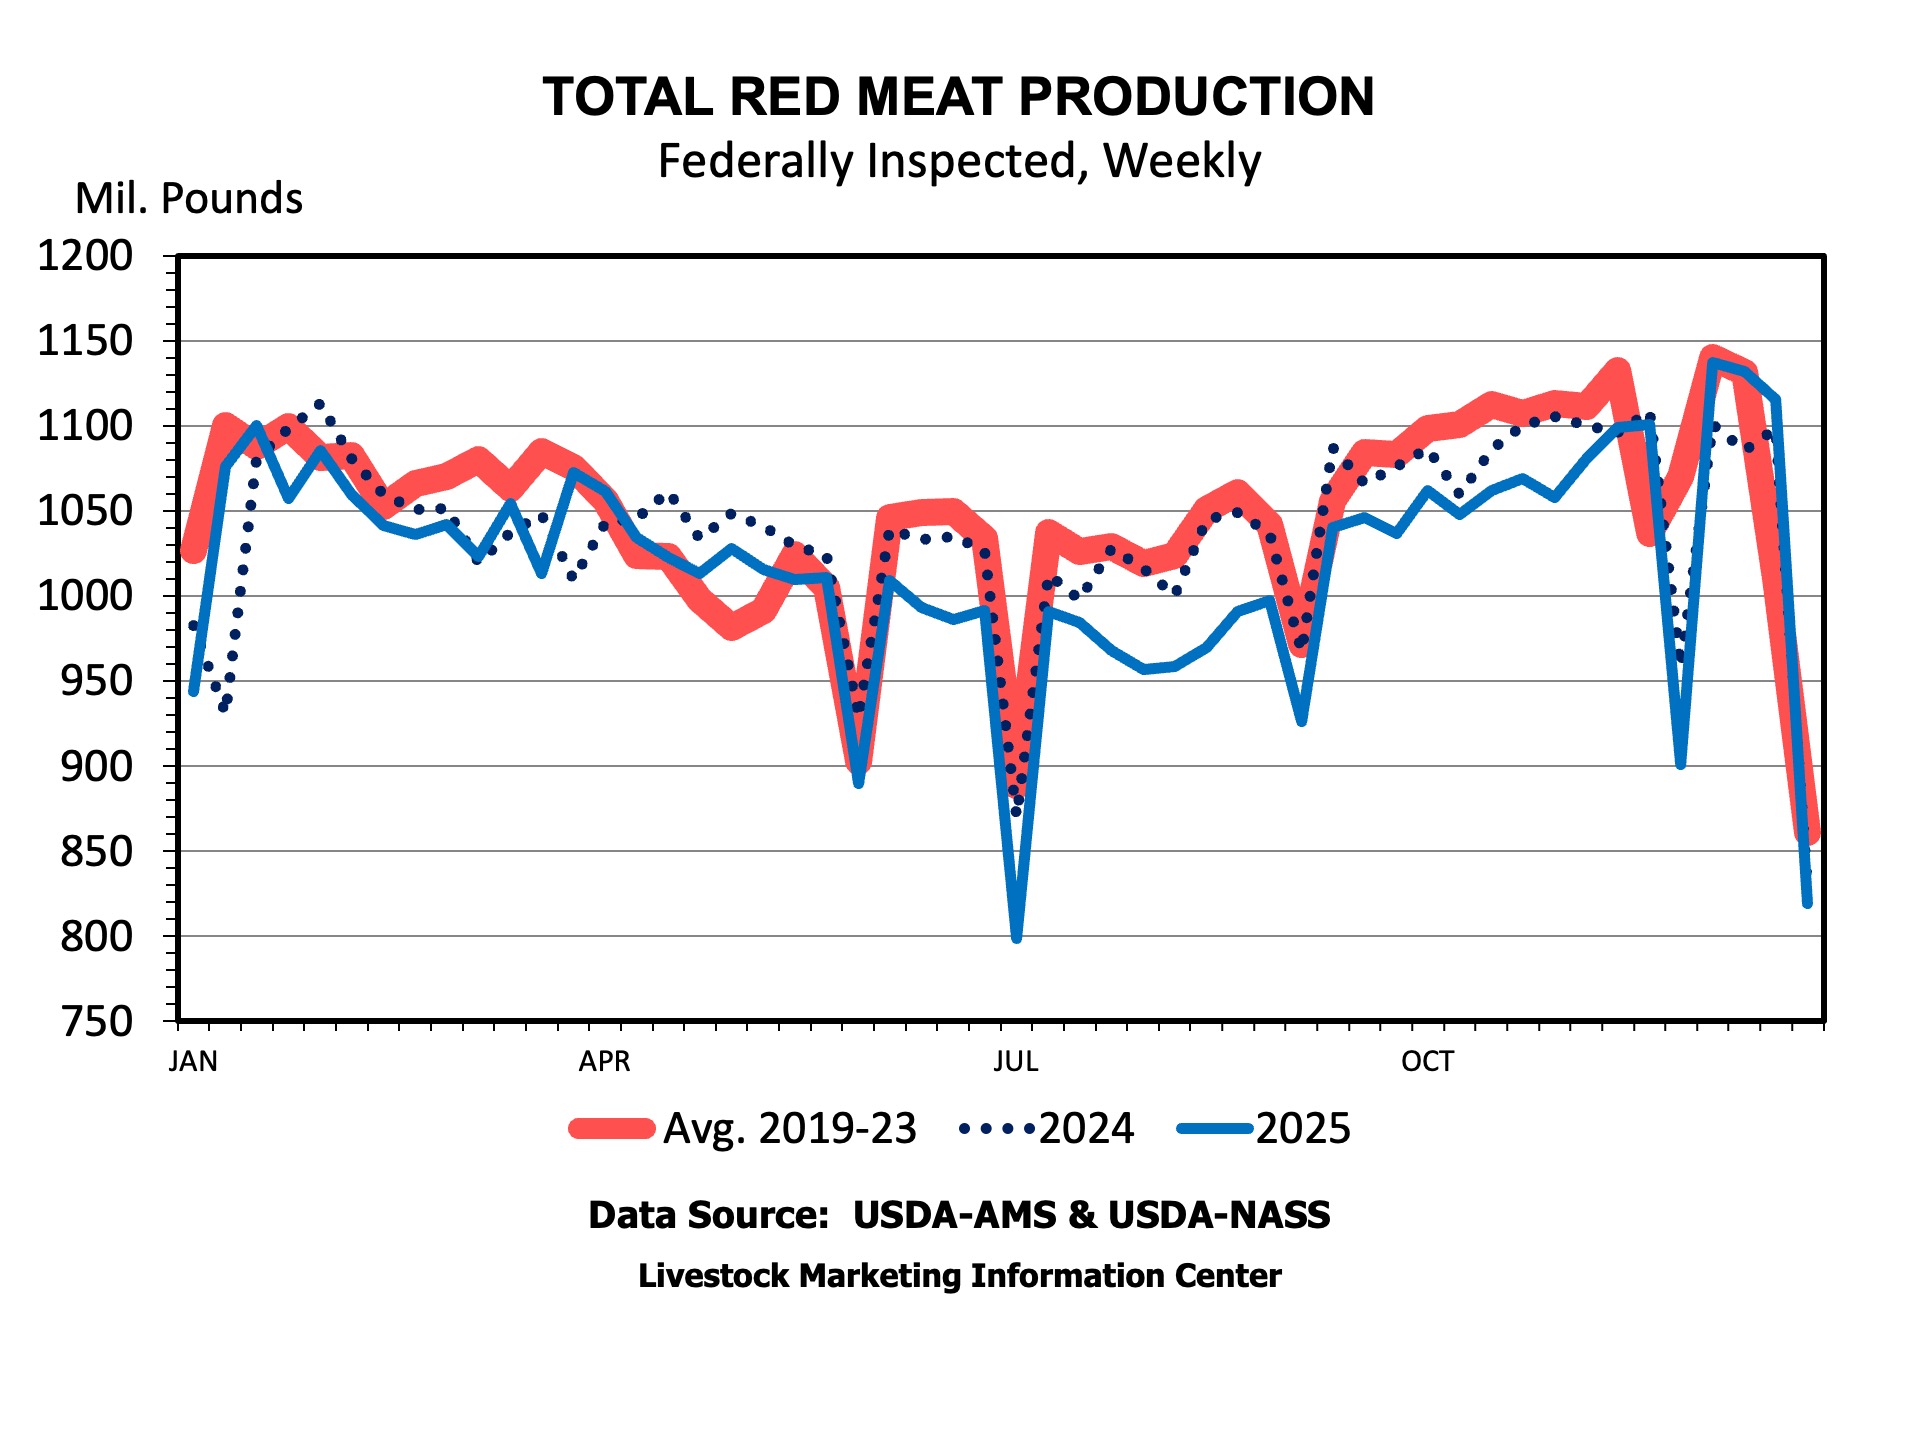
Total meat production surged in December, with production of all major meat species higher than the year before. It was a sharp contrast to the rest of the year, in which less beef and pork were produced than in 2024.
Red Meat
Red meat production, led by beef and pork, normally increases seasonally, from Summer to Fall. This year was no exception as both increased seasonally over that period. Beef and pork production in December were 0.5 percent and 3.9 percent larger than in December 2024, respectively. Larger December beef production may surprise some, given the talk all year of tighter beef supplies, but steer dressed weights surged to new record highs, over 980 pounds per head, leading to larger beef production. Heavier barrow and gilt dressed weights than a year ago helped boost pork production, as well.
For the year, red meat production was 1.9 percent less, about 1 billion pounds, than in 2024. Beef production was down about 3.3 percent, and pork production was almost 0.5 percent smaller. About 1 percent more lamb was produced in 2025. For the third consecutive year, more pork than beef was produced.
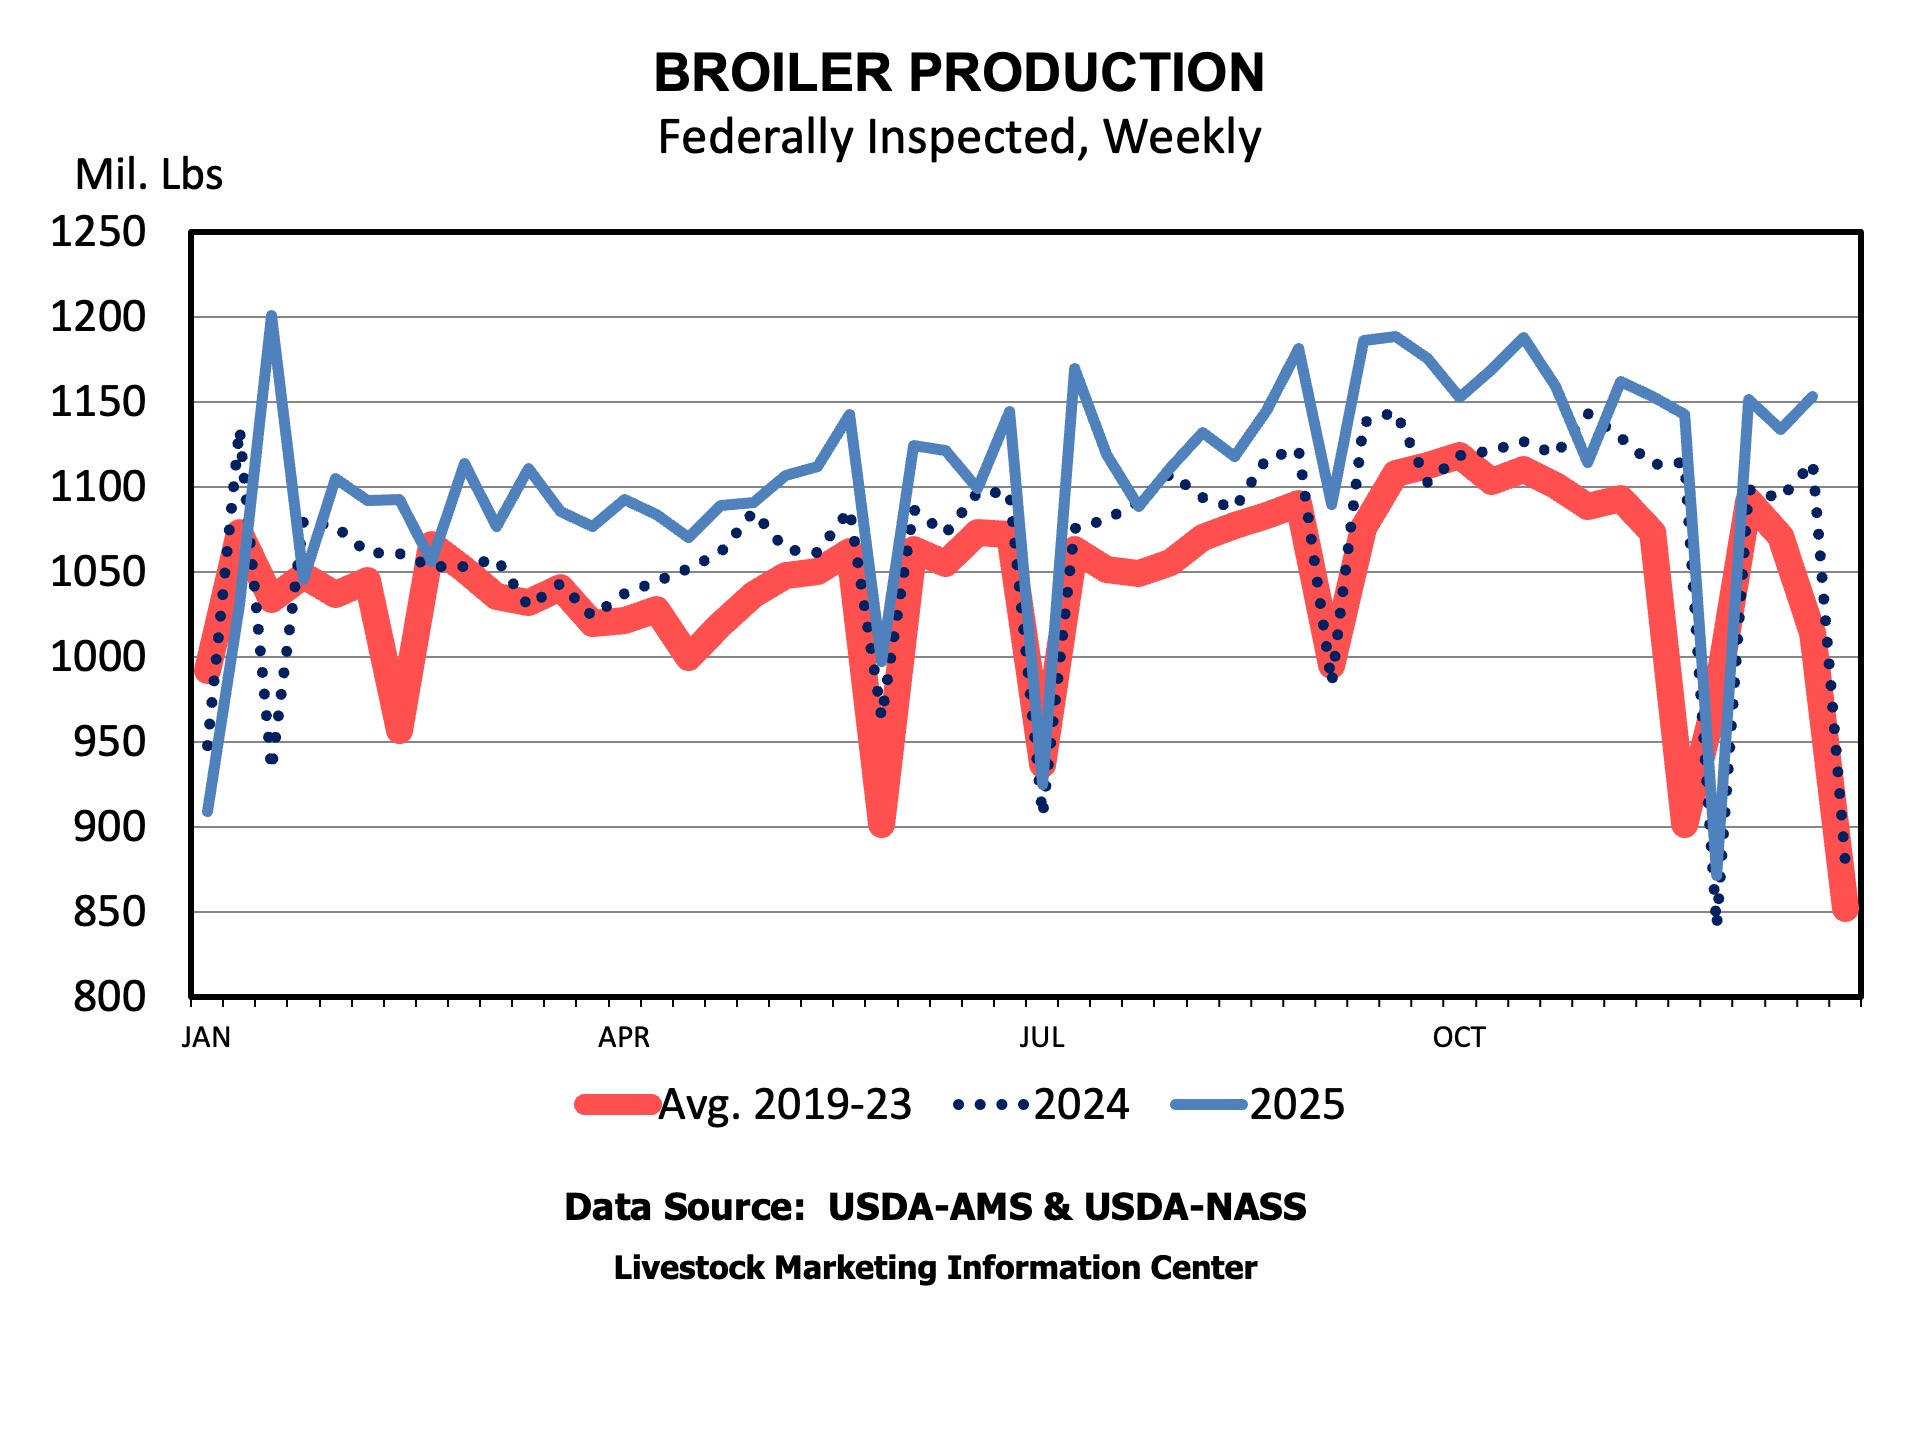
Poultry
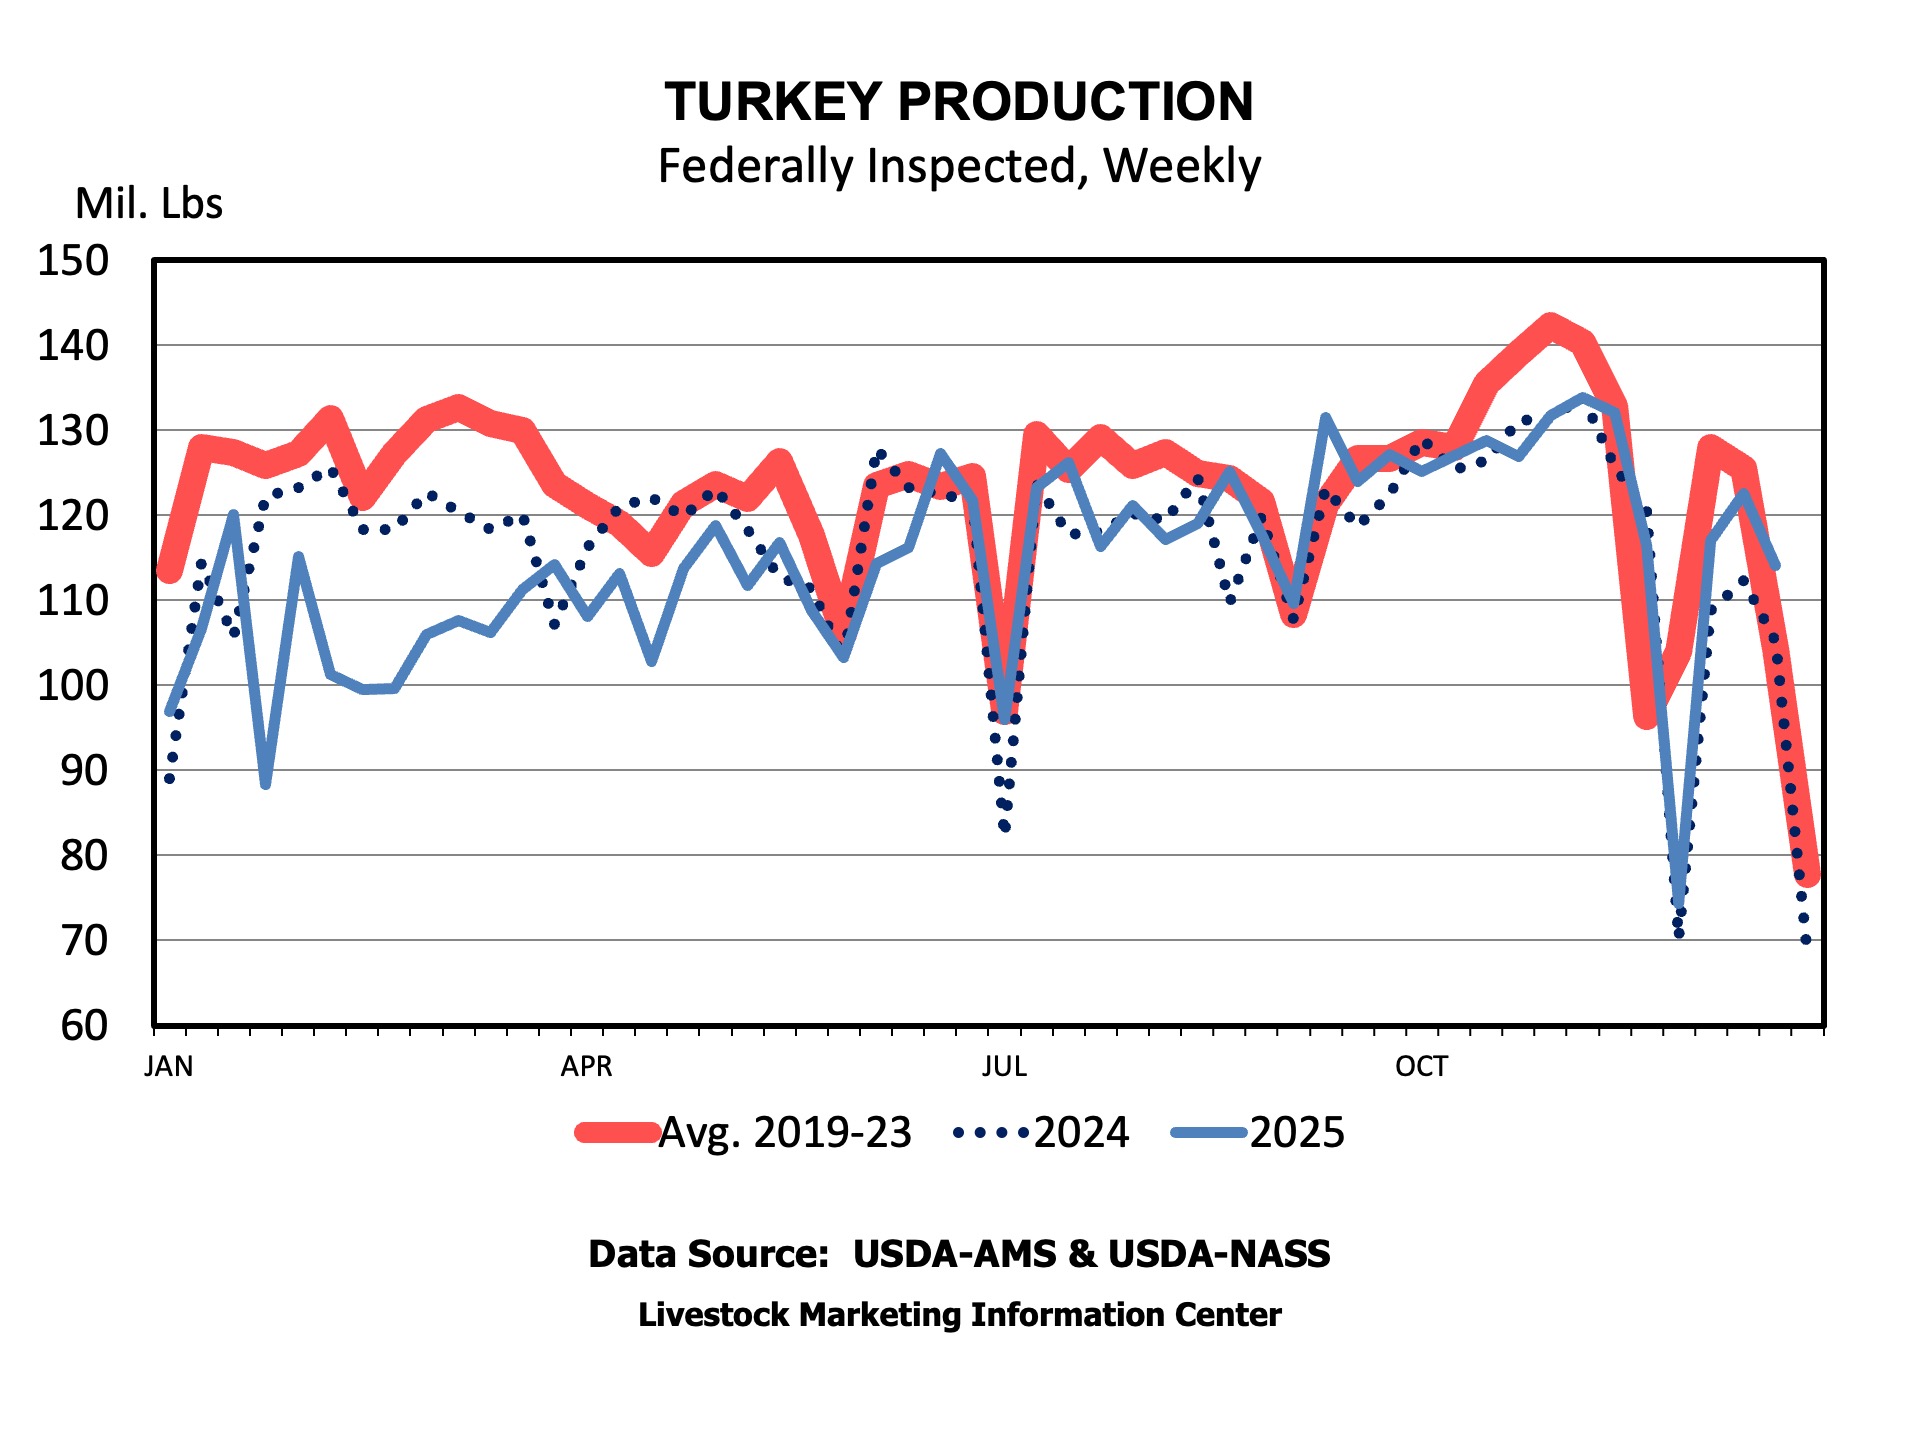
While red meat production declined, young chickens (broilers) expanded their share of total meat production. Broiler and turkey production increased 4.0 percent and 8.4 percent, respectively, in December compared to last December. Less expensive feed and higher wholesale broiler meat prices earlier in the year contributed profits to fuel increased production. The late increase in turkey production might be considered “too little, too late” for the whole bird market since it was after Thanksgiving, and it followed on the heels of increasing production in the second half of the year.
For the year, 3.5 percent (1.9 billion pounds) more broiler meat was produced than in 2024. Turkey production was down about 122 million pounds. On balance, increasing poultry production offset declining red meat production, leading to an increase in total meat production of about 800 million pounds.
The new year should bring more poultry production from both broilers and turkeys. Beef production will continue to decline, and pork may see a little increase in production. I was asked recently if we are “running out of meat” during a discussion of declining beef production and high prices. The quick and correct answer is “no!” But, production market shares are changing.
A note on data. This article uses weekly meat and poultry production. In much of our agricultural data, weeks don’t equal months. The first day of a month may fall mid-week and end mid-week, so that data for a week’s production will include some in one month and some in another. But, the monthly data released by USDA won’t dramatically affect the discussion above.
While I have heard discussions around the topic, I have never been one to believe that an “optimal” cow size exists. Every farm is unique and operates in a different production and market environment. Whenever this question comes up, I simply reply that I don’t really care what cows weigh, as long as they are weaning enough pounds of calf each year to be profitable. But even that is a fluid discussion as it is impacted by the market. For example, a cow does not have to wean as large of a calf to be profitable in 2025 as she would have in 2022. The reality is that producers make culling decisions each year based on the best information they have at the time.
While record keeping has never been high on the list of things that cow-calf operations enjoy, it is extremely important and should be used to drive these decisions. Well managed cow-calf operations track weaning weights on individual calves and tie each calf back to its dam. By doing that, productivity can be measured for each individual cow. On the other hand, it is nearly impossible to track production costs on an individual cow basis. Producers with good financial records likely have a solid understanding of what it costs them to maintain the average cow in their herds.
This distinction is important when one considers how to use production records to make culling decisions. Larger cows tend to wean larger calves, but they are also more expensive to own. While it is not easy to observe, they will consume more hay, feed, pasture, and mineral as they maintain their larger bodies and one can make a case that vet / medicine, yardage, transportation and other expenses will be higher for larger cows too. The simple point being that if one is making culling decisions based on calf weaning weights alone, they are likely to be disproportionately culling more of their smaller cows. By doing this over time, the average size of their cows increases, and their costs trend upward.
Several years ago, I put together an Extension presentation aimed at illustrating this point and encouraging producers to consider cow size in their culling decisions. I used a simple budget approach and estimated cost adjustments for various sized cows. I even included a higher cull value on those larger cows, which is relevant to the discussion. Using this approach, it appeared that an operation needed to wean about 50 more lbs of calf for every additional 100 lbs of mature cow they were maintaining.
While I am not suggesting this approach was perfect, I do think it did a good job illustrating the concept. Basing culling decisions solely on weaning weight can be misleading – especially when the herd has cows of varying size. While I don’t think there is an “optimal” sized cow, I know those larger cows must be weaning larger calves to earn their keep. And the only way to do that is to consider calf weaning weights in relation to the weight of the cows.
Contributors: Stephanie Brown, Jennifer Hagen, Josey Keener, and Natasha Parks
As 2025 comes to a close and 2026 awaits, there’s no better moment to level up your home kitchen food safety habits. Explore our top five expert tips to help you prepare every meal with greater confidence and peace of mind in the year ahead.
Wash Hands, Clean, and Sanitize: The holidays bring gatherings and plenty of food, whether from parties, potlucks, or gifts. Now’s the perfect time to wash your hands often and focus on food safety. Organize, clean, and sanitize your kitchen and food storage areas, so you’re ready for extra treats and leftovers.
In the home, using a four-step method for cleaning and sanitizing is recommended. They are 1) pre-rinse; 2) clean with detergent; 3) rinse; and 4) apply a sanitizer (Stone et al., 2020). If you skip steps, like using a sanitizer on dirty surfaces, this wastes product and doesn’t keep you safe. This is because the dirt and food debris on a dirty surface can bind to the active ingredients in many sanitizers, thereby preventing the sanitizer from reaching any foodborne pathogens present on these surfaces. When prioritizing which surfaces need to be cleaned and sanitized, consider the following:
Keep your cell phone out of the kitchen and remember to clean and sanitize it regularly – phones carry a surprising number of microorganisms!
Refrigerators, freezers, or any other cold storage areas. This includes shelving, drawers, and walls inside of the unit(s).
Surfaces in storage and preparation areas including countertops, sinks, and shelves.
Common touch points such as light switches, knobs for stoves, and handles on doors, cabinetry, and equipment (e.g., microwave, refrigerator, and dishwasher).
If using reusable bags as part of your shopping habits, don’t forget to clean these as well. General sanitation tips to consider: Not all sanitizers should be used on surfaces that touch foods (i.e., food contact surfaces). Reading a sanitizer’s EPA approved label will tell you if a product is approved for food contact uses. To learn more about sanitizer basics, we recommend reviewing Stone et al., 2020. While this article was written with the food industry in mind, many of these concepts and tips can be applied to home settings.
Separate Don’t Cross-Contaminate: Reducing opportunities for cross-contamination to occur begins with bringing ingredients and food into your home. Many food items are stored in the refrigerator, including ready-to-eat items (such as leftovers and most dairy products), raw produce, meats, and more. These items can cause cross-contamination issues if not stored separately, particularly if they can spill or otherwise comingle with different food types.
Another best practice is to store items that are thawing in a refrigerator in a secondary container to prevent dripping onto other foods (Ahn et al., 2021). For example, raw meats should be thawed in a clean bin or plate to prevent liquids from dripping onto ready-to-eat foods (e.g., lettuce intended for salad). Using a secondary container can also be a great way to separate items of different types if you cannot dedicate whole refrigerator shelves to similar food types.
Use the Right Tools for the Right Job: Having the right tool, utensil, or piece of equipment to support food handling and storage can help keep your food safer and may make tasks easier to accomplish. To best explain, let’s use a food thermometer as an example. From monitoring refrigerator and freezer temperatures to checking the internal temperatures of foods, having thermometers can help determine whether foods have maintained or reached a safe temperature. However, having a thermometer is only one piece of the puzzle. If the thermometer will not measure the intended temperature range, it is hard to use or clean, is breakable, hard to calibrate, or not made of food grade materials, then this thermometer is not the right tool for this job.
Every so often, tools and equipment should be reviewed to see if they need to be replaced. Items that commonly need to be replaced because they are difficult to clean due to wear and tear include silverware, can openers, cutting boards, and cooking utensils.
Times and Temperatures Matter: Many foods require holding or storage at a specific temperature range for a given timeframe to maintain their safety (i.e., time/temperature controlled for safety (TCS) foods). Instead of giving the gift of foodborne illness this holiday season and beyond, consider these practical tips:
Do not rely on visual clues alone for determining a food’s safety. Always store perishable foods and leftovers promptly, and cook foods to their recommended internal temperature, which should be measured using a food thermometer. The USDA’s safe minimum internal temperature chart can be found in Table 1(USDA, 2025b). The maximum recommended time that foods should be kept out of the temperature danger zone (40ºF – 140ºF) is two hours. If working in temperatures above 90ºF, this time frame shortens to one hour (USDA, 2020).
Don’t forget about the temperature danger zone when it comes to traveling with or hosting events with perishable foods. Consider using insulated containers/coolers or food warmers to keep foods at a safe temperature.
If you can’t finish leftovers in three to four days (USDA, 2020), consider freezing them to keep them safe. Using labels or stickers on your food containers are great reminders for what the safe storage time should be. You can also repurpose leftovers into new meals like soup, salads, casseroles, and more! Planning ahead saves money, reduces food waste, and helps prevent illness.
Food delivery is more popular than ever. Whether it’s delivering homemade treats to friends or ordering meals and meal kits right to your door, temperature is an important consideration, especially if living in warmer climates. Where possible, consider using coolers or other insulated devices to help keep perishable foods at a safe temperature.
Food Date Labels and Waste: When was the last time you checked the back of your fridge, pantry, or cabinets for forgotten foods and spices? Items left or pushed to the back can spoil, leading to unnecessary waste. Spoiled foods tend to have an unpleasant smell, taste, or other sensory properties that indicate a food has changed. This can happen at any time during a food’s shelf life, regardless of the date-based label associated with the product. It is important to remember that the microorganisms responsible for food spoilage are not the same as those that make us sick (i.e., pathogens). However, if food is spoiled, it means conditions have allowed all types of bacteria, including harmful ones, to multiply. Therefore, for safety’s sake, we recommend throwing out any spoiled foods to help protect yourself and others from possible foodborne illness.
Along with spoilage, date-based labeling has been commonly used when making decisions about discarding foods. A 2025 food label survey demonstrated that the percentage of consumers relying on date-based labeling for decision making is on the rise (43% versus 37% in 2016; Neff et al., 2025). However, relying solely on date-based labeling leads to extra food waste and money loss for consumers. The 2019 EPA estimates for wasted food from food retail, food service, and residential sources reached 66.2 million tons (EPA, 2023). Of this, 40% was attributed to home use (EPA, 2023). The only food requiring date-based labels in the U.S. is infant formula (USDA, 2025a). The “use-by” date for this product is the final date that a manufacturer can guarantee the nutritional value and quality of this food (21 CFR 107). While most other foods contain date labels, these terms are unregulated, not standardized across the industry, and are typically used by companies to refer to a food’squality attributes, not safety.
Table 1: Safe Minimum Internal Temperature Chart from USDA.
Product
Minimum Internal Temperature and Rest Time
Beef, Pork, Veal and Lamb Steaks, Chops and Roasts
145 degrees F (62.8 degrees C) and allow to rest at least 3 minutes
Ground Meats
160 degrees F (71.1 degrees C)
Ground Poultry
165 degrees F (73.9 degrees C)
Ham, Fresh or Smoked (Uncooked)
145 degrees F (62.8 degrees C) and allow to rest at least 3 minutes
Fully Cooked Ahm (to Reheat)
Reheat cooked hams packaged in USDA- Inspected plants to 140 degrees F (60 degrees C) and all others to 165 degrees F (73.9 degrees C)
All Poultry (Breasts, Whole Bird, Legs, Thighs, Wings, ground Poultry, Giblets and Stuffing)
165 degrees F (73.9 degrees C)
Eggs
160 degrees F (71.1 degrees C)
Fish & Shellfish
145 degrees F (62.8 degrees C)
Leftovers
165 degrees F (73.9 degrees C)
Casseroles
165 degrees F (73.9 degrees C)
*Table is from USDA’s Safe Minimum Internal Temperature Chart webpage (USDA, 2025b).
References:
Ahn, S., Lepper, J. A., and Schneider, K. (2021). Food safety tips for the holiday season. University of Florida Institute of Food and Agriculture Extension, FSHN14-13. Available at: https://edis.ifas.ufl.edu/publication/FS260
Etaka, C. A., McEntire, E., and Strawn, L. K. (2024). Best practices for reusable grocery bags. Virginia Cooperative Extension Publications, FST-476NP. Available at: https://www.pubs.ext.vt.edu/FST/fst-476/fst-476.html.
Food and Drug Administration (FDA) (2025). Questions and answers regarding food allergens, including the food allergen labeling requirements of the federal Food, Drug, and Cosmetic Act (edition 5): Guidance for industry. Available at: https://www.fda.gov/media/117410/download.
Mafe, A. N., Edo, G. I., Makia, R. S., Joshua, O. A., Akpoghelie, P. O., Gaaz, T. S., Jikah, A. N., Yousif, E., Isoje, E. F., Igbuku, U. A., Ahmed, D. S., Essaghah, A. E. A., and Umar, H. (2024): A review on food spoilage mechanisms, foodborne diseases and commercial aspects of food preservation and processing. Food Chemistry Advances, 5: 100852.
Olsen, M., Campos, M., Lohning, A., Jones, P., Legget, J., Bannach-Brown, A., McKirdy, S., Alghafri, R., and Tajouri, L. (2020). Mobile phones represent a pathway for microbial transmission: A scoping review. Travel Medicine and Infectious Disease, 35:101704.