Blog

  • 2023 Land Values and Buyer Motivations

    2023 Land Values and Buyer Motivations

    In August 2023, the USDA National Agricultural Statistics Service published their annual report of state-level land values for farm real estate, which includes both cropland and pasture values. The results of the report indicate a strong market in the Southeast, with Georgia leading the region at a 9.8% increase in 2023 farmland values over 2022. The overall increase for the United States was 7.4%, and Kansas led the nation with a 16.3% increase in farm real estate values from 2022.

    Over the last three years, farmland values have increased by record amounts, according to the USDA-NASS survey data. At the same time, the financial position of many farmers has been affected by higher input costs and increasing interest rates. Why don’t we see a one-for-one decrease in land values when interest rates increase and farm profitability moderates? Well, the most straightforward answer is that farmers are a mixed group, and their individual financial positions aren’t necessarily the same as their neighbor’s. This makes it hard to predict the movement of the land markets during times of transition.

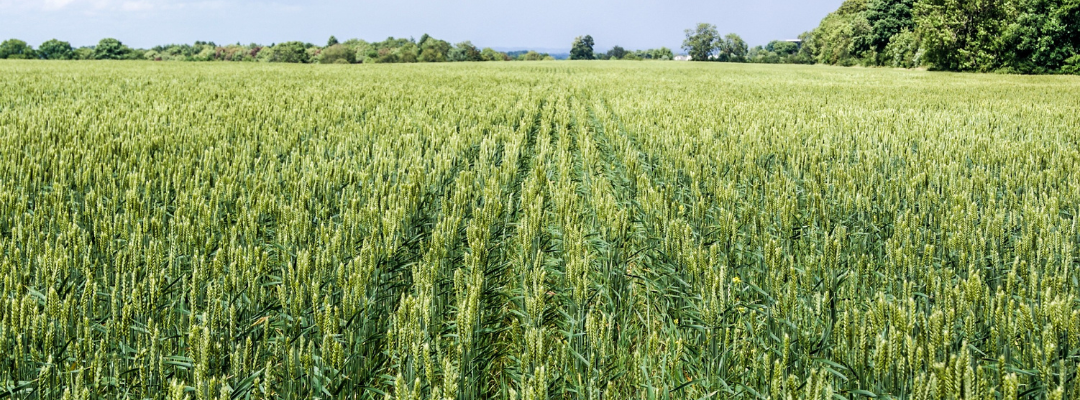
    When I read about the farmland market in articles from across the country, I am always struck by the variety of factors at play. First, crop yields are going to drive willingness to bid. Several years of good yields and prices will motivate both farmers and non-farm investors to participate in the land market. But there are always other factors including proximity to urban development or water availability/rights. It is important to remember that farmers are the majority owners of farmland, and their motivations to buy and sell land are big drivers in the market. This means when that rare piece of good farmland near your operation comes up for sale, you will likely be in the market regardless of where interest rates are today. You may also be looking to expand your operation and bring on another generation. When that is the case, buying land becomes a priority for your farm business, and your willingness to bid in a strong market is going to be robust. Each of these factors will contribute to support for the local land market that may keep these recent increases in interest rates and moderation of farm incomes from having a big impact on land values in your area. 

    Source: https://www.nass.usda.gov/Charts_and_Maps/Land_Values/farm_value_map.php

    Taylor, Mykel R. “2023 Land Values and Buyer Motivations.Southern Ag Today 3(37.3). September 13, 2023. Permalink

  • Are You Buying Hay For The Winter?

    Are You Buying Hay For The Winter?

    As the 2023 hay season comes to an end for much of the South, the last cuttings are being baled and balers are being parked for the year.  Loader tractors will have some rest before it’s time to start feeding out hay.  In some parts of the South, feeding has been going on for some weeks and drought stopped hay production.  When purchasing hay here are some questions to consider:  How much hay do I need to make it through the winter?  How much can I spend on hay?  These questions can be answered by planning.  Working through a budget for the operation will show the potential cost incurred by various situations, whether it is a change in cost or a change in the amount needed.

    Hay Quantity.

    Hay is measured primarily by two methods: by the bale or by the ton. Most commonly hay marketing occurs by the bale. When planning on hay needs for the winter or working through a budget, focus on the tonnage required.  Accounting for hay needs by the ton will allow for pricing comparison across various bale sizes, assuming constant moisture levels.  Table 1 provides a standard bale weight estimate based on bale size.  Using tons as a measurement will allow for livestock consumption based on pounds consumed per day.  This method does require some pencil work but will provide more efficient use of hay resources.

    Source: D. Hancock, Bale Weight Estimation Table July 2011

    Hay Quality:

    Here is the most common hay quality test: “It’s got good color and smells good, must be good.”  While I’m not going to disagree with long-standing tradition, there is value in the marginal investment of requesting fertilization records/soil sample data, herbicide records, and a forage sample.  Is this worth the trouble?  It will depend on the willingness to minimize risk.

    Fertilization and soil sampling records will illustrate that the forage grown had fertility management applied correctly.  The presence of weed load in hay can be a problem.  To safeguard against this, herbicide records will show that unwanted seeds/plant matter were managed.  A forage sample provides the best picture of the quality of the purchased hay.  The sample results will also provide insight into additional nutritional requirements.  Knowing the quality can also help fine-tune feeding to meet the nutritional needs of the cows.

    In closing, feeding livestock during low/no grazing periods adds to the cost of the operation.  More information can allow for the efficient use of operation dollars and decreased cost in herd health/losses. Lastly, to give some “cud to chew on,” consider the choices typically made when purchasing a commodity blend supplement feed.  Would you purchase a load of commodity blend feed based on a guess of how much it weighs?  Or would you request a weigh ticket to verify amount purchased?  How about the quality of the feed?  It helps to know what the nutritional value is to make the best decision.  All of this takes extra work; however, management of input cost is a great tool to ensure profit potential.  

  • Supporting Sorghum Prices in the 2023/24 Season: Exports and Basis

    Supporting Sorghum Prices in the 2023/24 Season: Exports and Basis

    In recent weeks there has been a noticeable surge in the demand for sorghum. This is seen through robust sorghum export sales over the past two months, around 25% above the previous two seasons (Graph 1). A corresponding increase in the average basis offered on the Gulf Coast of Texas is also observed, with the sorghum basis currently standing at $1 per bushel above the price for positions with delivery from this month through December, 80 cents higher than last year by this time. These prices are expected to benefit producers significantly, especially in a year marked by anticipated higher production (393 million bushels) and better yields (66 bushels per acre).

    According to the August 2023 report from the United States Department of Agriculture’s World Agricultural Supply and Demand Estimates (WASDE), there is an increase in U.S. sorghum exports projected for the 2023/24 season. USDA export projections have reached 255 million bushels, marking a 155% increase over the previous season (Graph 2), even though projected exports are still lower than the levels in 2020/21 or 2021/22. In 2022/23, the U.S. exported 100 million bushels of sorghum, 67% lower than the recent peak in the 2021/22 season due to the low production from last year’s drought.

    Source: USDA/NASS/ERS/WASDE

    China will continue to be the primary importer of sorghum from the United States, primarily driven by the demand for feed from its livestock industry. USDA projections forecast a steady market for hogs, sustained growth in aquaculture and ruminants, and a resurgence in poultry feed demand. Consequently, China’s imports are anticipated to increase by 125.7 million bushels, fueled by higher U.S. production and competitive prices.

    The 2023/24 sorghum season presents promising sorghum export opportunities. This export surge will likely result in better sorghum premiums over corn, as evidenced by the positive basis farmers are currently experiencing on the Gulf Coast of Texas.  All of these factors taken together will likely result in the United States retaining its position as the top producer and exporter of sorghum.

  • HPAI in 2023: “Induced” Losses Leave a Gap in the Federal Indemnity Scheme 

    HPAI in 2023: “Induced” Losses Leave a Gap in the Federal Indemnity Scheme 

    The one-year anniversary date of the current highly pathogenic avian influenza (HPAI) outbreak passed in February 2023 and much of the U.S. agricultural industry hardly noticed. Animal health professionals certainly did as the wild fowl migration which they identified as the trigger of the diseases’ spread was rapidly approaching.  According to USDA’s database of HPAI 2022/2023 Confirmed Detections, January 2023 saw three scattered detections in commercial broilers or turkeys (Iowa, Tennessee and California), and two Kansas gamebird operations. The 2023 Spring months passed and by May 2023, commercial flock detections were zero and have remained so. The current outbreak seems to be at an end for the commercial poultry sector. 

    All indications are that the USDA Animal and Plant Health Inspection Service’s (APHIS) HPAI Response Plan, otherwise simply known as “The Red Book,” and all the other USDA policy and guidance documents available to explain how and what USDA does in the event of an HPAI outbreak, served its function exceedingly well in explaining, coordinating and structuring USDA’s activities. For those entities who owned birds euthanized or eggs destroyed in the disease response activities, perhaps the most important USDA activity is that of indemnity (compensation for destroyed property) and compensation (reimbursement for services provided in the virus elimination process on the affected premises). 

    This outbreak brought to the surface two key limitations of the current indemnification and compensation process: (1) contract growers without an ownership interest in the birds or eggs destroyed are not eligible despite a complete loss of revenue until production can resume after quarantine restrictions are lifted; and (2) ancillary business operations, e.g. breeders supplying chicks and poults, are not eligible for any compensation due to lost revenue from the cessation of production at infected or other premises under quarantine restrictions. This limitation is induced by the concentric circles of quarantine restrictions that stop product movement not only to infected premises but also to any poultry operation within the entire quarantined control zone imposed around an infected premise, i.e. the  “induced impact” of lost revenue from an infection. 

    Relief in one state highly impacted by this HPAI outbreak, Pennsylvania (31 commercial flocks and 4.6 million birds euthanized), came in the form of an appropriation by the Pennsylvania General Assembly (Act 54 of 2022) of $25 million dollars for the “Highly Pathogenic Avian Influenza Recovery Reimbursement Grant” program. Administered by the Pennsylvania Department of Agriculture, it is intended to “provide reimbursement to farms, integrators, and allied industries directly impacted by HPAI. This covers those who incurred demonstrable financial losses due to inclusion in a control or quarantine zone.”  

    The program has been the subject to four completed rounds of funding conducted between September 2022 and June 2023, with a fifth round of applications being accepted until October 5, 2023. Losses compensable have included loss of income, payroll costs, costs related to the continuation of group health care benefits and health insurance premiums, mortgage interest payments, rent payments, utility payments, and working capital for the purpose of covering costs of re-opening farming operations after being fully or partially closed due to the state or federally mandated quarantine period. 

    A federal bill attempting to address the same gap on a nationwide level, called the Healthy Poultry Assistance and Indemnification Act of 2023, has been introduced as S. 2235 by Senator Chris Coons (Del.).  It is presently in the Senate Committee on Agriculture, Nutrition, and Forestry.  

    Time will tell if other states may begin to address this gap or whether a federal solution may be successfully implemented. 

    Duer, Brook, and Paul Goeringer. “HPAI in 2023: “Induced” Losses Leave a Gap in the Federal Indemnity Scheme.Southern Ag Today 3(36.5). September 8, 2023. Permalink

  • The Rise and Fall of U.S. Chicken Feet in China: A Story of Bird Flu and Trade Bans

    The Rise and Fall of U.S. Chicken Feet in China: A Story of Bird Flu and Trade Bans

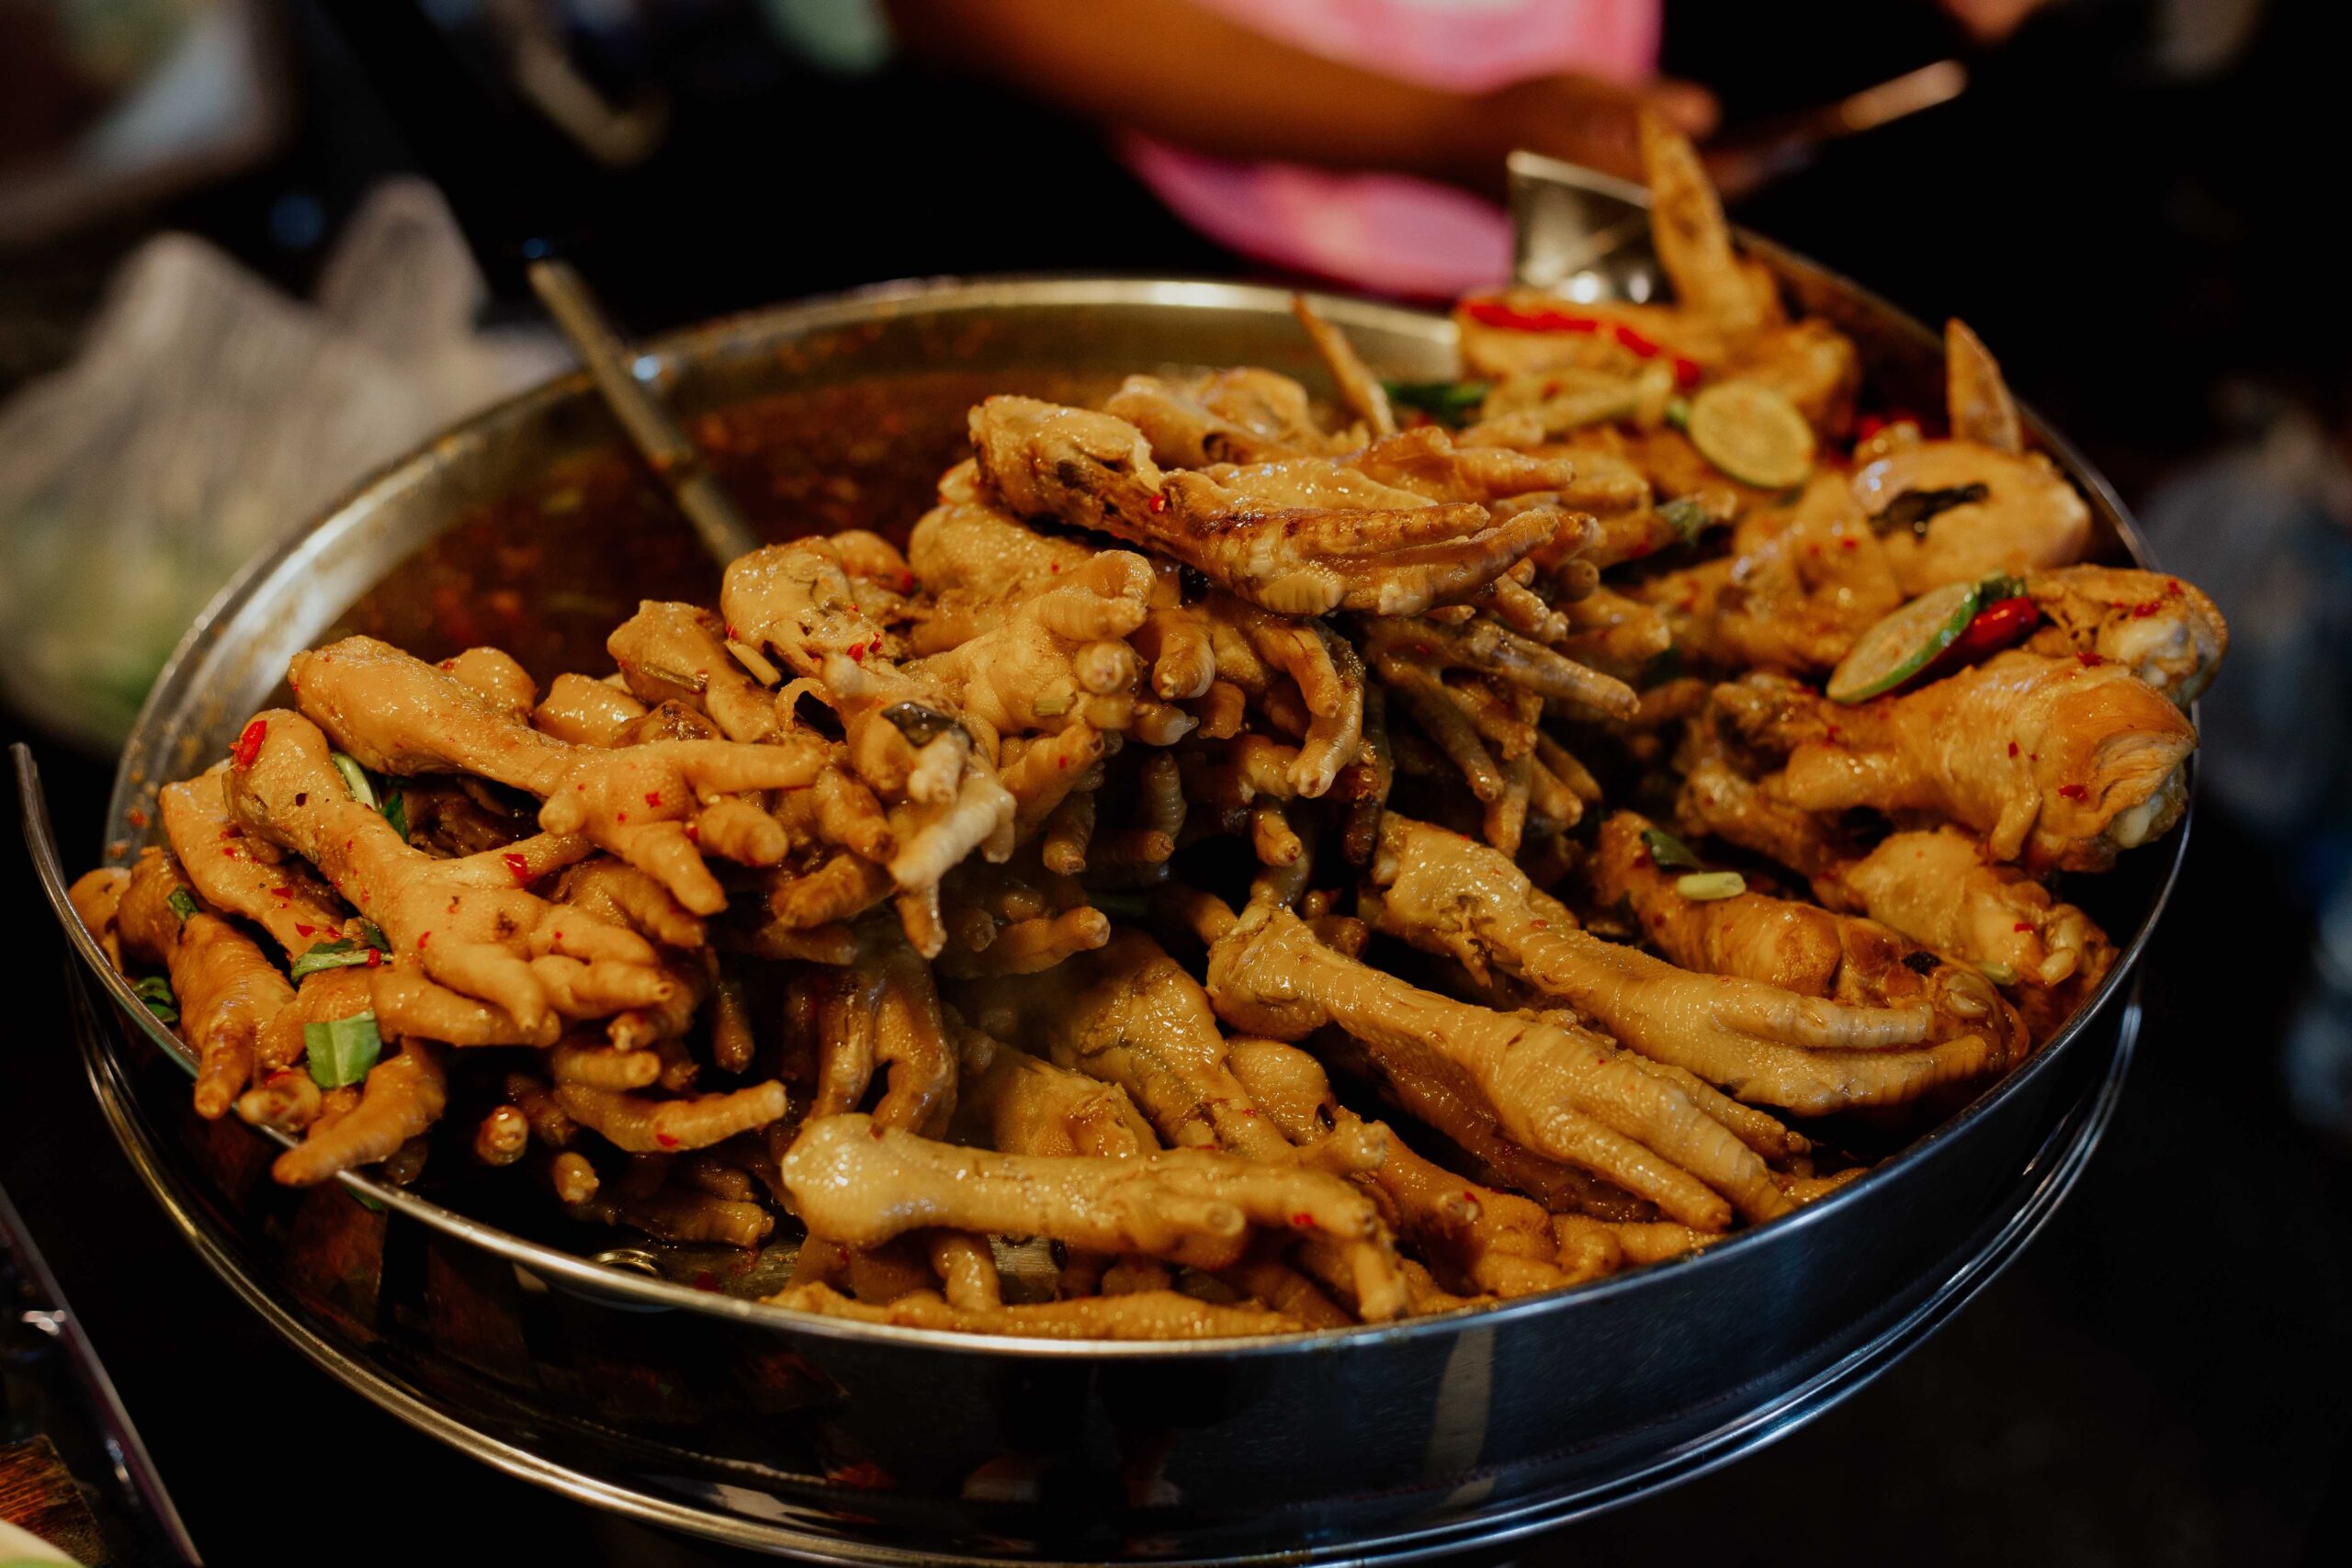
    According to the U.S. Department of Agriculture (USDA, 2023), U.S. producers shipped nearly $6.0 billion in poultry meat and related products (excluding eggs) to over 130 countries in 2022. China has emerged as the second largest destination for U.S. poultry exports, increasing from only $10 million in 2019 to a record $1.1 billion in 2022. This is a remarkable increase of more than 10,000% in just 4 years. Recall that China banned all U.S. poultry in January 2015 due to a highly pathogenic avian influenza (HPAI) (i.e., bird flu) outbreak in December 2014. Despite the U.S. being free of the disease by August 2017, the ban was not lifted until November 2019 (USDA, 2019). Since that time, however, the recovery of U.S. poultry in the Chinese market has been phenomenal. What is interesting is that this recovery has been driven by one product, frozen chicken feet (or paws), which are apparently preferred by Chinese consumers for their unique large size and consistent high quality (Baych, 2022). In 2022, frozen chicken feet accounted for more than 85% of all U.S. poultry exported to China.

    Figure 1 shows China’s frozen chicken feet imports from all major supplying countries. In 2010, frozen chicken feet imports in China were $571 million, and averaged only $350 million annually from 2010 to 2018. Since that time, however, China’s frozen chicken feet imports increased to $2.6 billion by 2022, primarily driven by imports from the U.S. In 2022, the U.S. accounted for 43% of China’s frozen chicken feet imports, followed by Brazil (20%), Russia (11%), Argentina (5%), and Chile (3%).

    Unfortunately, recent bans due to HPAI outbreaks in 2022 are limiting U.S. exports from certain states in 2023. This is occurring at a time when the Chinese are paying significantly more for imported frozen chicken feet. For example, import prices for frozen chicken feet from the U.S. were around $1.00/kg in 2014. In 2023, U.S. prices averaged between $5.00kg and $6.00/kg. Current restrictions are hurting overall U.S. sales to China and appears to be benefiting Brazil and Russia. As of June 2023, U.S. frozen chicken feet sales to China were down by 35% in terms of value and 51% in terms of volume. However, imports from Brazil and Russia were up, particularly in terms of value by 77% and 42%, respectively (See Table 1). The lifting of the HPAI ban in 2019 and the enforcing of bans on certain states in 2023 have given and taken away, respectively.

    Figure 1. China’s Frozen Chicken Feet Imports by Country of Origin: 2010-2023

    Source: Trade Data Monitor® (China Customs) (2023)

    Table 1. China’s Frozen Chicken Feet Imports from Brazil, Russia, and the United States: 2022 and 2023 Year-to-Date (January-June) Comparisons

    Jan-June 2022Jan-June 2023% Change
     Brazil 
    $198.3 million$351.8 million77.4%
    81.9 TMT86.6 TMT5.7%
     Russia 
    $106.4 million$150.9 million41.8%
    37.4 TMT39.1 TMT4.4%
     United States 
    $550.4 million$358.3 million-34.9%
    133.7 TMT65.2 TMT-51.2%
    Note: TMT is Thousand Metric Tons.
    Source: Trade Data Monitor® (China Customs) (2023)

    References

    Baych, A. 2022. Poultry and Products Annual Country: People’s Republic of China. USDA GAIN Report Number: CH2022-0100. Foreign Agricultural Service, Washington, DC.

    U.S. Department of Agriculture (USDA). 2019. American Poultry Farmers Regain Access to China. USDA Press Release No. 0176.19. https://www.usda.gov/media/press-releases/2019/11/14/american-poultry-farmers-regain-access-china

    U.S. Department of Agriculture (USDA). 2023. Global Agricultural Trade System (GATS). Foreign Agricultural Service, Washington, DC.