Blog

  • EWG Takes the Spotlight in the Silly Season

    EWG Takes the Spotlight in the Silly Season

    As discussed in a May 25, 2023, SAT article “The Silly Season Has Begun… Must Be Farm Bill Time,” every farm bill cycle, we run across a report or research geared toward “informing” farm bill discussions that, while not technically wrong, boy does it leave out something kind of important…hence the term “Silly Season.”  This time the article was written by Scott Faber and Jared Hayes of the Environmental Working Group.  Their September 5, 2023, article entitled “Calls to Increase Crop Reference Prices Would Help Fewer Than 6,000 Farmers” caught our attention.

    The authors analyzed individual producer payment data from their database of FSA payment data obtained through Freedom of Information Act requests to arrive at the following conclusions:

    “Increasing price guarantees for major crops would mostly benefit farmers of peanuts, cotton and rice in Southern states, not corn and soybean farmers, EWG has previously found, which further limits the overall benefit of increasing price guarantees.

    Only 5,630 farmers, mostly located in Southern states, received more than $50,000 in 2021 through the Price Loss Coverage, or PLC, program, according to USDA data, and would get more than a few thousand dollars if price guarantees went up.”  

    For the most part, we have few technical issues with what they said based on what they did. However, there are a number of factors – not discussed – that make their results meaningless.  First, they picked 2021, a year where most commodities in PLC did not trigger a payment.  The black line in Figure 1 intersects the marketing year average price for 2021 for the top 5 commodities in terms of base acreage.  All commodity prices are above their respective reference prices, so…no safety net payments would have been made.  If they had picked a year or two prior to 2021, there would easily have been more than 6,000 producers receiving payments.  Second, rather than try to use payment data to draw a conclusion, it would have been more meaningful to use FSA enrolled base acre data.  Figure 2 provides the FSA enrolled base acres for PLC and ARC county and individual for all 23 covered commodities.  While acreage data doesn’t allow one to say definitively how many farmers would be affected, it is pretty clear that in 2021 there were over 140 million acres of base in the PLC program that, depending upon prices, could have benefitted from higher reference prices. That applies to every single farmer with base acres in the United States.  In fact, every farmer would receive assistance in direct proportion to the amount of acres they have at risk, except for mid-to-large-sized operations that are payment limited. However, that is not likely the headline the authors were looking for…

    Figure 1.  Historical and Projected Prices for Five Major Commodities, 2009 – 2023.

    Source:  USDA NASS and FAPRI, “2023 Baseline Update for U.S. Agricultural Markets” September 5, 2023, available at: https://fapri.missouri.edu/publications/2023-baseline-update/

    Figure 2.  Enrolled Base Acres in PLC and ARC, 2015 to 2023.

    Source:  USDA FSA.  Available at: https://www.fsa.usda.gov/programs-and-services/arcplc_program/index

    Outlaw, Joe, and Bart L. Fischer. “EWG Takes the Spotlight in the Silly Season.Southern Ag Today 3(39.4). September 28, 2023. Permalink
  • Which is more profitable for producers, Single-Species or Multi-Species Cover Crops?

    Which is more profitable for producers, Single-Species or Multi-Species Cover Crops?

    Interest among producers in adopting cover crops to enhance soil fertility, mitigate erosion, and manage weeds has been growing. Legumes, which are cover crops capable of fixing nitrogen, are recognized for enhancing soil health. In the Southern United States, where crops like cotton play a central role in crop rotations, there exists a pronounced nitrogen demand and a heightened risk of soil erosion due to limited crop residue post-harvest. The use of single-species cereals such as wheat or rye as a soil cover is a common practice. Although adoption remains modest, legume cover crops have the potential to not only minimize soil erosion, but also reduce the need for nitrogen fertilizers, possibly increasing profits relative to single-species cover crops lacking legumes.

    A 2-year on-farm trial was conducted in 2021 and 2022 in Terrell County, Georgia, to compare the use of various cover crop treatments in cotton production. The experiment consisted of 3 study treatments relative to a base treatment of a single species rye cover crop.   

    Base:               a single-species rye cover crop (Rye)

    Treatment 1:   a single-species crimson clover cover crop (Crimson Clover)

    Treatment 2:   a combination of rye and hairy vetch cover crop (Rye + Hairy Vetch)

    Treatment 3:   a 4-way mix of rye, vetch, triticale/oats, and crimson clover as cover crop (4-way)

    The biomass of the cover crops from each plot was weighed, and the UGA Cover Crop Calculator was used to estimate the nitrogen credit, additional nitrogen released into the soil once the cover crop decays. Two separate subplots were designated: A) a standard fertilizer application determined by the farmer (Normal N), assuming no nitrogen credits, and B) a reduced nitrogen fertilizer application (Reduced N), which in 2021 was based on the anticipated nitrogen credit, and in 2022 was fixed at 40lbs./acre assuming farmer had a budget constraint. Since all treatments adopted cover crops, costs like irrigation, planting, and termination of cover crops were the same. The potential profit impact of each treatment relative to the base treatment is compared using a partial budget approach. 

    Figures 1 and 2 illustrate, for 2021 and 2022, respectively, the cover crop biomass weighed, the nitrogen credit released into the soil after cover crop decay, and cotton yields for both Normal N and Reduced N subplots. The graphs show that in both years, all treatments produced almost as much, if not more, biomass than the rye treatment. Nitrogen credited to the soil was also found to be higher in all treatments across both years. The nitrogen credit observed for multi-species treatments exhibited a discernible decline between 2021 and 2022, primarily attributed to reduced legume establishment during the latter year, which was influenced by adverse weather conditions experienced in 2022. This gives credence to the nitrogen-fixing ability of legumes when they are adequately incorporated as cover. Cotton yields varied across time for the rye and hairy vetch treatment as they were as good or better than the base of rye in the year 2022 but not in 2021. But, the 4-way treatment, consistently, across years, produced yields as good as the base or even better. Figure 3 uses profits from the base treatment as a baseline against which profits from all other treatments were compared. The graph showed that the 4-way treatment provided higher profit per acre across 2021 and 2022. 

    While only illustrating the experience of two seasons in a single location, the Terrell County, GA study provides insight into the potential to offset nitrogen expenses by using multi-species cover crops (including legumes) in cotton production. Single species clover and dual-species (rye/vetch) generally performed better than rye in 2022, but did not in 2021. These mixed results of the lower variety treatments might shed some light on producers’ tendency to stick with a single species rye cover. However, a high variety, 4-species mixed cover crop had an improved profit outcome relative to a simple rye cover crop in both 2021 and 2022 as well as across all nitrogen application strategies. Results will obviously vary by season, geography, and primary crop, but the high variety cover was the better performer in this instance.  

    Figure 1. 2021 biomass weight, estimated nitrogen credit, and cotton yield from single and multi-species cover crop treatments.

    Figure 2. 2022 biomass weight, estimated nitrogen credit, and cotton yield from single and multi-species cover crop treatments. 

    Figure 3. Per acre profit differential for each cover crop treatment relative to the per acre profit of single species rye as cover crop (considering differences in yield, resulting revenue, cover crop seed costs, and nitrogen costs per acre) 

    References

    USDA-AMS (2023, February). North Carolina Production Cost Report: AMS_3159

    https://mymarketnews.ams.usda.gov/viewReport/3159

    USDA-AMS (2023, February). Alabama Production Cost Report: AMS_3051

    https://mymarketnews.ams.usda.gov/viewReport/3051

    USDA-AMS (2023, February). South Carolina Production Cost Report: AMS_2789/ CO_GR210

    https://mymarketnews.ams.usda.gov/viewReport/2789

    USDA-NASS (2022). Southeastern Upland Cotton Price Received in $/lb. Data.

    https://www.nass.usda.gov/Statistics_by_Subject/index.php?sector=CROPS

    Bobbie, Kelvin, Seth McAllister, Amanda R. Smith, and Yangxuan Liu. “Which is more profitable for producers, Single-Species or Multi-Species Cover Crops?Southern Ag Today 3(39.3). September 27, 2023. Permalink

  • All Markets are Local

    All Markets are Local

    What’s the price of hay? An adage that I often hear is that all markets are local. This is especially true for the hay market.  Numerous factors influence the local price of hay including but not limited to supply and demand, weather, quality, storage, age, variety, and delivery costs. In other words, the answer to what’s the price of hay is “it depends!”

    Figure 1, Monthly Hay Price Received (excluding Alfalfa) from January 2021 through July of 2023 shows the average price of hay for selected states and the U.S. average. Hay prices for the states of Kentucky, Missouri, Oklahoma, and Texas are included. These are the states that have monthly hay prices reported by USDA NASS Quick Stats. 

    Keep in mind the adage that all markets are local, especially the hay market.  Hay is trucked from where it is plentiful and cheaper to where it’s in short supply.  Shipping and arbitrage makes hay prices move together.  The Missouri and Oklahoma hay prices, on average, are 40% and 46% respectively, lower than the U.S. average hay price. The Kentucky and Texas prices trend very close to the U.S. average price.  The effect of summer drought in Texas and the Southwestern areas of the U.S. is reflected by the increased hay prices across all the states and the U.S. at the beginning of the summer of 2022.

    These monthly prices from USDA NASS can be useful in looking at season and/or long-term trends. For more timely prices check weekly hay prices at:

    https://www.ams.usda.gov/market-news/hay-reports

    Runge, Max. “All Markets are Local.Southern Ag Today 3(39.2). September 26, 2023. Permalink

  • Low River Levels, Barge Freight, and Widening Basis

    Low River Levels, Barge Freight, and Widening Basis

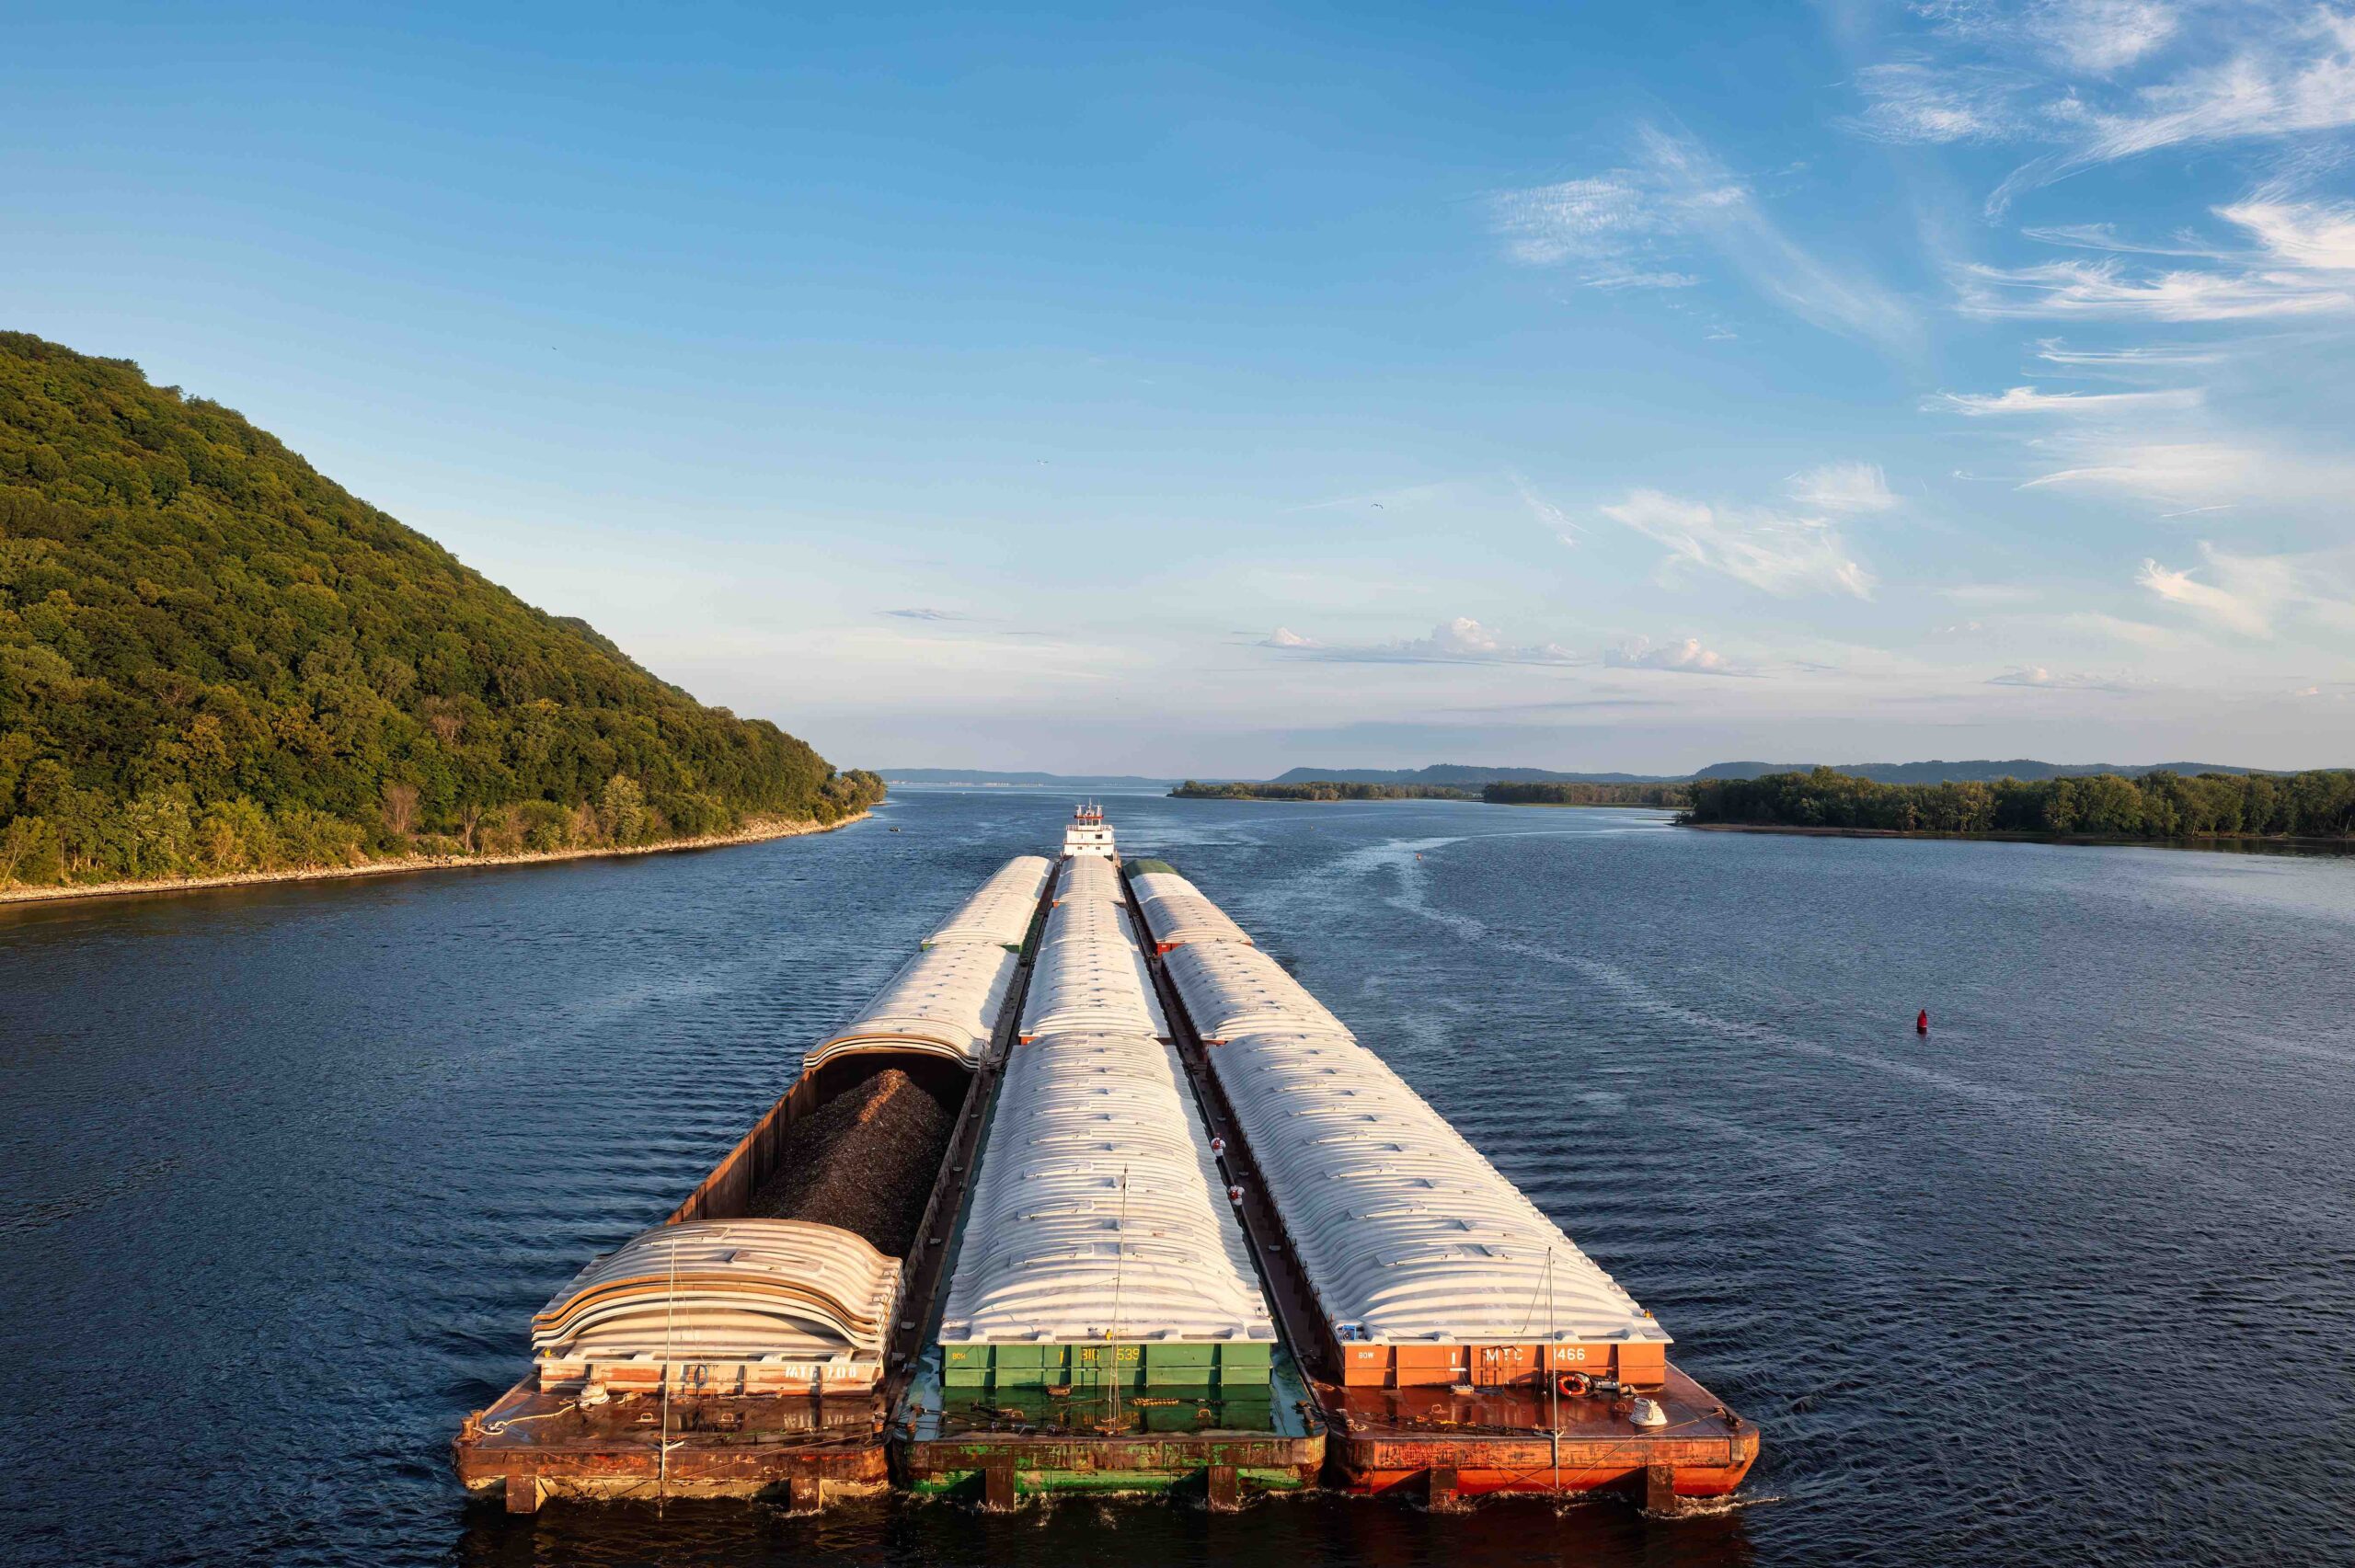
    Dry weather has again caused the Mississippi River levels to fall to near-record lows. This is a problem for row crop producers and grain elevators in the Lower Mississippi River area, who rely on barges as the primary mode of transportation for grain. For example, during 2015-2019, approximately 53 percent of U.S. corn exports were moved by barge (Chang, Caffarelli, and Gastelle, 2021). When the Mississippi River is low, barge traffic slows, causing barge freight prices to increase (McKenzie, 2005; Biram et al., 2022). Crop basis, defined as the difference between local cash prices and futures prices, is impacted by local market fundamentals, including the cost of transportation. When barge rates increase, crop basis weakens (becomes more negative or less positive) at grain elevators near the Mississippi River. Figure 1 shows river barge freight rates for the 2022-23 marketing year compared to the three-year average. The three-year average indicates that we typically see small fluctuations in barge freight rates; thus, barge rates likely have a small effect on local commodity basis when river levels are sufficient. However, in 2022, the river level at Memphis hit a historic low of -10.81 feet, nearly stopping all barge traffic and sending barge freight rates to a record high of nearly $90/ton of grain. As of September 5th, the river level declines have caused barge rates to increase to $30/ton. Although data is not included in the graph, the September 18th river level at Memphis is -9.56 feet. Current weather forecasts look dry, and without sufficient rainfall, barge freight rates may increase similar to last year, causing another situation in which commodity basis drops. 

    Figure 1: Recent River Level height and Recent Barge Freight Rates compared to the Three-Year Average Freight Rate (September 2022-September 2023)

    Figure 2 indicates the weakest corn basis in 2022 compared to the 5-year average for southern agricultural districts bordering the Mississippi River. As the river levels were lowest during harvest season, producers without storage were forced to deliver and could not avoid basis risk. Producers unlikely to avoid the risk included those taking the spot price, hedging through futures, or using hedge-to-arrive contracts where the basis is set near or at delivery. At the minimum basis, hedging producers in southern agricultural districts bordering the Mississippi River, excluding southern Mississippi, could have experienced realized prices of $0.40-$1.03/bushel under their expected price, which is estimated when the hedge is set.

    Figure 2: Weakest 2022/23 Marketing Year Corn Basis relative to the 5-Year-Average in Southern Ag Districts Bordering the Mississippi River  

    Figure 3 indicates that as river levels continue to drop and barge freight prices increase, the 2023 basis has started to widen again in the districts bordering the Mississippi. The impacts vary drastically by region; however, as of September 12th, the average weekly basis is between 3 and 21 cents under the 5-year average which contains basis for marketing years 2017/2018 through 2021/2022. If heavy rainfall does not cause river levels to improve, southern producers could again face unexpected losses due to the effects of falling river levels on barge freight rates and, thus, basis. If the basis continues to drop, hedging producers will likely experience prices below their expected price, which could have huge implications on farm profitability and cash flow for Southern producers bordering the Mississippi River.

    Figure 3: Current Corn Basis Relative to 5-Year Average in Southern Ag Districts Bordering the Mississippi River

    Producers have limited options for managing basis risk. Hedging or HTA contracts are typically used to minimize futures price risks; however, they leave the producer susceptible to basis risk, which is usually more stable than commodity futures prices. However, last year and currently, lower river levels have caused unpredictable basis patterns. If we continue to experience dry summers and low river levels, Southern producers bordering the Mississippi may need to rely on forward contracts, which lock in price and basis pre-delivery, or basis contracts, which lock basis in before river levels can decline. Compared to hedging, a pitfall of these contracts is that they limit the flexibility of when and where grain is delivered. Entering into a forward pricing contract also exposes a producer to production risk which may result in a fee from the elevator if agreed-upon bushels are not delivered in the specified window. In the short term, if available, producers should consider utilizing on- or off-farm storage until basis improves.

    References

    Biram, H.D., J.D. Anderson, Scott Stiles, and Andrew McKenzie. “Low Water Levels in the Mississippi River Result in Abnormally Weak Soybean Basis“. Southern Ag Today 2(45.1). October 31, 2022. Permalink 

    Chang, K., P. Caffarelli, and J. Gastelle. 2021. Transportation of U.S. Grains: A Modal Share Analysis. U.S. Department of Agriculture, Agricultural Marketing Service. Available at: https://www.ams.usda.gov/sites/default/files/media/TransportationofUSGrainsModalShare1978_2019.pdf 

    McKenzie, A. M. (2005). The effects of barge shocks on soybean basis levels in Arkansas: A study of market integration. Agribusiness: An International Journal21(1), 37-52.

    Gardner, Grant, Hunter Biram, and James Mitchell. “Low River Levels, Barge Freight, and Widening Basis.” Southern Ag Today 3(39.1). September 25, 2023. Permalink

  • Ten More States Pass Foreign Land Ownership Laws This Year

    Ten More States Pass Foreign Land Ownership Laws This Year

    During the 2023 legislative session, the issue of restricting foreign investments and ownership in U.S. land, especially agricultural land, emerged or reemerged in the majority of states. This reemerging interest in restricting foreign investments in U.S. land is partly due to the purchase of land near U.S. Air Force bases in Texas and North Dakota by two Chinese-owned companies.

    Currently, there are approximately twenty-four states that specifically limit or restrict foreign individuals, foreign business entities, and/or foreign governments from acquiring or owning an interest in farmland within their state, which is up from fourteen states in 2022. During the 2023 legislative session, ten states enacted a new law restricting certain foreign investments in land located within their state, and two states—North Dakota and Oklahoma—amended their laws that prohibit certain foreign purchases of land. Although twenty-four states now have some type of restriction, state laws vary widely, and some states restrict only certain purchases. For example, the majority of foreign ownership laws enacted in 2023 seek to restrict investments from specific countries, particularly China, Iran, North Korea, and Russia.

    Aside from state action, Congress is also considering several proposals that seek to establish a national restriction on certain foreign investments in U.S. land. Specifically, the Senate recently passed an amendment to its version of the bicameral National Defense Authorization Act (“NDAA”) which seeks to prevent certain investments in U.S. agricultural businesses and land by China, Iran, North Korea, and Russia. The Senate version of NDAA is currently being reconciled with the House version of the bill.

    Brown, Micah. “Ten More States Pass Foreign Land Ownership Laws This Year.Southern Ag Today 3(38.5). September 22, 2023. Permalink