Blog

  • Producers have Significantly Increased the use of LRP

    Producers have Significantly Increased the use of LRP

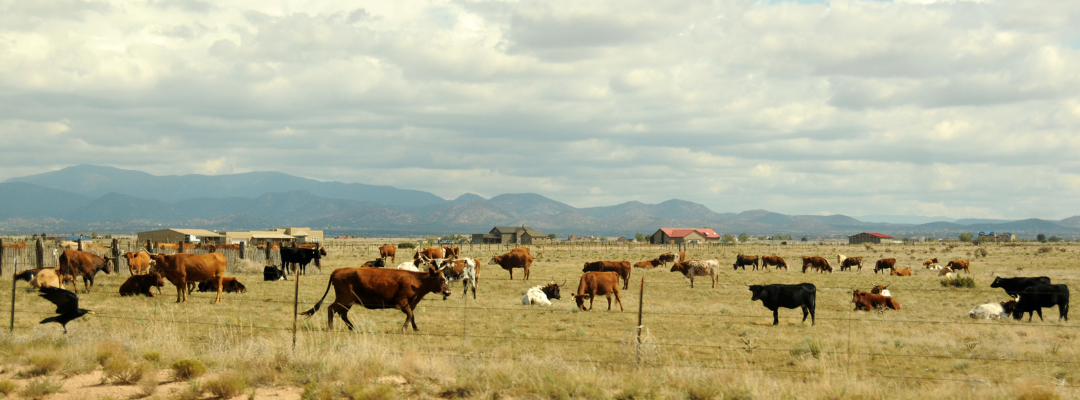
    Incorporating a price risk management plan into our operation has been difficult for many ranch businesses, even considering larger sized operations. Ranchers face many risks associated with cattle pricing, as we have seen these last years after disruptions in supply chains. Past events emphasize the importance of incorporating a price risk management plan as one of our management strategies to minimize economic losses, lock margins, or reduce the risk of business failure.  

    The USDA Livestock Risk Protection Feeder Cattle (LRP) program is an important tool to reduce price risk in our operations by setting a floor price for our cattle. An analysis made with the last ten years of data for stocker prices shows that this tool provides floor prices and, in many cases, above the October market value (Premium purchased in May, 30 weeks endorsement, at a 98% price level coverage). Producers can choose between different price coverage levels and buy the insurance up to 52 weeks before selling their cattle.  

    During the summer of 2019 and winter of 2021, the USDA made a few changes to the program. These modifications reduced the premium paid by producers, delayed the premium payment to the end of the endorsement period, and made it available in all states and counties. Payments due at the end of the period are a cash-flow advantage compared to buying a Put Option in the futures market.

    The LRP program is available for most ranchers since it does not require a minimum number of cattle to be insured. Small ranchers with even one cow could make use of it. Most importantly, both cow-calf and stockers operations can benefit from this program. 

    Producers from the southern region have significantly increased the use of LRP as a price risk management tool compared to 2020, as shown in Table 1. In 2022, producers will have insured 1.4 million head through the LRP program. For more information on LRP, please check the USDA Fact Sheet (Livestock Risk Protection Fed Cattle | RMA (usda.gov)). If you are interested in buying the insurance, the USDA website lists approved livestock agents and insurance companies. 

    Table 1. LRP – Quantity of Cattle Insured in the Southern States (Heads). Source: USDA – RMA

    Abello, Francisco “Pancho”. “Producers have Significantly Increased the use of LRP“. Southern Ag Today 2(35.3). August 24, 2022. Permalink
  • Fuel Price Volatility a Growing Concern for Commercial Poultry Growers

    Fuel Price Volatility a Growing Concern for Commercial Poultry Growers

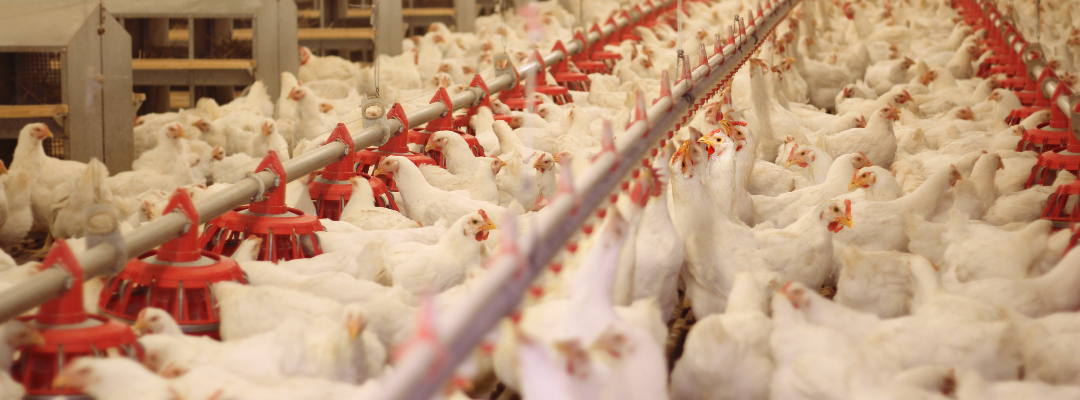
    Even as we are in the middle of the heat of summer, contract poultry growers should be concerned about fuel prices going into this winter. Propane prices have remained at a high level through the spring and into the summer. Looking ahead, evaluating the world market demand for energy and current US inventories suggests that prices could increase drastically. According to an analysis by Propane Resources LLC, a leading US propane marketing company, growers should expect a very volatile six to nine months in propane prices. Much of this will be driven by a very active European market with much instability being caused by the Ukrainian conflict, which is stifling natural gas trading. To help fill that void, sellers of liquid natural gas that would normally supply Asia are rerouting that LNG to a European market. That LNG will likely be replaced in Asia by propane. 

    As supply and demand for propane becomes an even more global market, a look at the current and projected US propane inventory for 2022-23 does not give one a good feeling for the upcoming winter’s prices, or even into next spring. The current peak projected inventory for the US comes in at about 3.25 billion gals, and drops off from there, staying at or below the historical monthly minimum inventory over the last five years. This simply means that the supply of propane does not look to be ample for the next several months. For poultry growers, this means the time to secure future pricing is now. Waiting around for a mid-summer price drop will likely mean you will be paying more, not less, for your propane this winter. 

    Brothers, Dennis. “Fuel Price Volatility a Growing Concern for Commercial Poultry Growers“. Southern Ag Today 2(35.2). August 23, 2022. Permalink

  • The Option to Augment the Crop Insurance Price Floor

    The Option to Augment the Crop Insurance Price Floor

    Producers face risks every growing season. Production risks, such as extreme weather and drought, affect yield. Marketing risks, including price direction and volatility, is affected by global supply and demand. Developing strategies that use crop insurance in conjunction with options can be an effective way to manage marketing and production risks within the growing season for row crop producers. 

    Annually, Federal crop insurance provides over $100 billion in total liability protection (RMA, 2022). Many crop insurance products and features are available to producers; however, three popular crop insurance types are yield protection (YP), revenue protection (RP), and revenue protection with harvest price exclusion (RP-HPE). YP offers protection against declines in yield, whereas RP and RP-HPE offer protection against declines in revenue (yield and price). To calculate the insurance guarantee, RP policies use the greater of the projected or harvest crop insurance price while RP-HPE utilizes only the projected price. It is important for producers to consider the in-season price protection offered by the type of crop insurance policy and buyup coverage level as well as the price risk exposure throughout the growing season. Considering price risk exposure throughout the growing season introduces the opportunity for using crop insurance products in conjunction with other risk management tools such as futures and options.

    Options can be used during the growing season to establish a futures price floor greater than the projected price in the crop insurance policy. Buying options allows producers to obtain the right, but not the obligation, to establish a position in the futures market at a specified strike price. The cost to purchase the option is the premium. As such, the strike price minus the premium establishes a futures price floor for the bushels protected. Figures 1, 2, and 3 show the daily December corn futures contract closing price, the projected crop insurance price (for Arkansas the projected price discovery period is January 15 to February 14 (Table 1); projected price discovery periods vary by state), and the put option floor (strike price minus the premium) that could have been established when the market peaked during the 2020, 2021, and 2022 growing seasons. In 2021 and 2022, purchasing a put option was an effective method to establish a futures market price floor above the projected price provided by crop insurance. In both years, the price floor established with the option contract also exceeded the harvest crop insurance price (Table 1). However, each year presents different market opportunities. In 2020, no opportunity was presented to establish a futures market price floor through put option purchases above the crop insurance projected price – the December corn contract declined after the projected price determination period and remained flat through most of the growing season.

    Take Aways

    1. Producers should consider utilizing marketing tools that work in conjunction with crop insurance during the growing season.
    2. In-season marketing opportunities can be short lived, so action should be considered when opportunities are presented.
    3. Each marketing year is different, presenting unique challenges and opportunities. Knowing how to use numerous marketing tools (options, futures, hedge-to-arrive (HTA’s), forward contracts, basis contracts etc.) allows producers to select the tool that is best suited to provide in-season price protection.

    Figure 1. Projected Crop Insurance Price, December Corn Price, and May 20th Option Floor, 2022

    Figure 2. Projected Crop Insurance Price, December Corn Price, and May 7th Option Floor, 2021

    Figure 3. Projected Crop Insurance Price, December Corn Price, and February 21st Option Floor, 2020

    Table 1. Projected and harvest crop insurance prices for corn (Arkansas), 2020-2022

    YearProject Price Discovery PeriodProjected PriceHarvest Price Discovery PeriodHarvest Price
    2020
    2021
    2022
    01/15 – 02/14
    01/15 – 02/14
    01/15 – 02/14
    $3.95
    $4.48
    $5.75
    08/15 – 09/14
    08/15 – 09/14
    08/15 – 09/14
    $3.54$
    5.36
    TBD

    Resources and References

    USDA Risk Management Summary of Business. (August 2022). USDA Risk Management Agency. https://www.rma.usda.gov/SummaryOfBusiness


    Biram, Hunter, and S. Aaron Smith. “The Option to Augment the Crop Insurance Price Floor“. Southern Ag Today 2(35.1). August 22, 2022. Permalink

  • How to Create Attention-Grabbing Content to Grow Your Agribusiness with Social Media

    How to Create Attention-Grabbing Content to Grow Your Agribusiness with Social Media

    Using social media content to grow an agribusiness should not be a mystery, but for most, it is. Often, the problem is that the content produced does not grab followers’ attention. When that happens, followers ignore the content. 

    But recent research shows how to create social media content to get attention and engagement. The solution is to avoid critical mistakes when creating content (Barnes, 2020). 

    One common mistake is agribusiness companies don’t explain that they solve a specific problem for customers. How do you write this type of content? Here’s an example post from a Mississippi agribusiness company called HogEye Trap Cameras. This Facebook post reached more than 10 million followers: 

                Are you frustrated because you can’t stop feral hogs from destroying          

                your land, property, and habitat? 

    Now let’s see why the post attracted attention and engagement. [Frustrated] is the negative feeling landowners have. {Can’t stop feral hogs} is the problem. [Destroying your land, property, and habitat] are the economic losses. In a few words, this post asks landowners if they have this problem. If they do, they will keep reading. The rest of the post highlighted the solution this company sells and the savings that will accrue if customers buy, namely the economic value of stopping feral hog damages. 

    Talk about the problem you solve for your customers. It’s the easiest way to hook followers’ attention.

    Want to learn how to avoid more mistakes and create social media content to grab your followers’ attention? Access the marketing resources provided by the Bricks-To-Clicks® Marketing Extension Program at Mississippi State University, including Dr. James Barnes’ new book and courses, or listen to the podcast. Get more customized help here

    References

    Barnes, J. 2020. 5 Social Media Mistakes Your Business Should AvoidA Step-By-Step Guide to Help You Grow Your Business [Amazon Kindle & Audible]. Mississippi State University Extension.

    Barnes, James. “How to Create Attention-Grabbing Content to Grow Your Agribusiness with Social Media“. Southern Ag Today 2(34.5). August 19, 2022. Permalink

  • Crop Insurance Loss Ratio Trends Over Time

    Crop Insurance Loss Ratio Trends Over Time

    The Risk Management Agency (RMA) is responsible for rating crop insurance in an actuarially sound way. Unlike private insurance companies, RMA is not driven by profit when determining rates. Premium rates do not include the cost of sales, underwriting, loss adjustments, or the operating costs of RMA. Legislative language instructs that “the amount of the premium shall be sufficient to cover anticipated losses and a reasonable reserve[1].” RMA considers actual production history in the rating process, and rates are established independently of crop and geographic region. The loss experience of rice is not a factor when developing a premium rate for corn. Likewise, the loss experience of corn in Mississippi is not a factor when developing a premium rate for corn in Illinois. 

    The politics of crop insurance comes into play with the premium subsidy percentage amounts set by policy. Subsidy percentages are equitable across all crops, though, with each crop receiving the same subsidy percentage dependent on coverage level and unit choice. Total acres insured, coverage level, and premium rates all factor into the total amount of subsidies received by a crop. As seen in Figure 1., corn has received a total of $24.6 billion of crop insurance subsidies in the past decade, followed by soybeans at $14.9 billion. Rice and peanuts have total subsidy amounts of $617 million and $424 million, respectively, over the past decade.  

    Crop insurance performance is often judged by loss ratios. A loss ratio is simply calculated as indemnity payments divided by total premium. A loss ratio of 1.0 means that indemnity payments equaled total premiums. A loss ratio greater than 1.0 means indemnity payments exceed premiums, and a loss ratio less than 1.0 means total premiums exceed indemnity payments. The Risk Management Agency (RMA) is statutorily mandated to achieve a target loss ratio of 1.0. While loss ratios can fluctuate year-to-year, the national and crop-specific ratios have been trending down since 1989, as seen in Figure 2. Interestingly, many crops have trended down at similar rates. Rice, cotton, wheat, soybeans, and the national total have similar sloping trend lines. Corn has trended down but at a slower rate than the previously mentioned crops. Peanuts have seen the most dramatic decrease in the trend of any crop.    

    Figure 1. Total 10 Year Subsidy Amount by Crop, 2013-2022

    Source: USDA-RMA Summary of Business – Report Generator (usda.gov)

    Figure 2. U.S. Crop Insurance Loss Ratio Trends Over Time by Selected Crops, 1989-2021

    Source: USDA-RMA Summary of Business – Report Generator (usda.gov)

    [1] Coble, K. H., Knight, T. O., Goodwin, B. K., Miller, M. F., Rejesus, R. M., & Duffield, G. (2010). A comprehensive review of the rma aph and combo rating methodology: Final report. Prepared by Sumaria systems for the risk Management agency.


    Maples, William E., and Keith H. Coble. “Crop Insurance Loss Ratio Trends Over Time.” Southern Ag Today 2(34.4). August 18, 2022. Permalink