Blog

  • Death and …

    Death and …

    Several articles have been written for Southern Ag Today on how farms can manage their tax obligations. This time of year, farm management specialists begin to receive questions of all kinds regarding taxes, especially for farms that try to meet the March 1 filing deadline available for qualifying farmers. Tax management is only one part of managing a farm but can be crucial. We wanted to relay a handful of resources that producers and other agribusiness specialists may find useful this time of year.

    The Internal Revenue Service (IRS) website, www.IRS.gov, is often the first and best place to begin looking for information. The site contains a vast amount of information and resources, which can also make it a bit daunting. You can find copies of individual tax forms, form instructions, news updates, and educational resources such as Publication 225 – Farmers Tax Guide. The Interactive Tax Assistant (ITA) is designed to answer many basic questions that a taxpayer may have. It includes basic tax return information like filing status, dependents, due dates, and so on, but it can also answer questions regarding tax deductions, credits, income, and payment-related questions. Typically, the assistant will ask questions related to your situation that will help determine which rules may impact you. 

    The other section of the IRS website that farm owners may find helpful is the Small Business Self-Employed Tax Center. This section provides information for self-employed individuals with Schedule C (small business) and/or Schedule F (farming) activities relevant for most farm owners. One of the best sections is the IRS Video Portal and Small Business Virtual Tax Workshop, which includes short video explanations on various tax rules. Other tools within the IRS website help taxpayers and preparers, including free filing options, year-to-date withholding amounts, payment options, and finding transcripts of a taxpayer’s account.

    Outside of the IRS, there are several other sources of information. The USDA website, www.farmers.gov, has a section specifically on tax education. On this website, you will find webinars on timely topics, frequently asked questions regarding farm taxation, and other resources to help farmers (especially newer farmers) navigate some of these issues. 

    Another site, www.RuralTax.org, is maintained by land-grant university professionals throughout the country who work in farm management and tax education. There are dozens of articles available on newer, timely topics, as well as archived information and a small farms tax guide producers may find helpful. Other sources of local help include lenders, fellow producers, your local Extension office, and certainly a designated tax professional. If you need to find a tax preparer, there are guides available through the IRS and Rural Tax. This article is not intended as professional tax advice but general knowledge for agricultural businesses who may benefit by having a bit more information and resources at their disposal. We encourage you to work with a professional who knows you and your farm and can best advise you on your situation.


    Burkett, Kevin. “Death and …Southern Ag Today 5(10.1). March 3, 2025. Permalink

  • Addressing PFAS Biosolid Contamination on Farmland

    Addressing PFAS Biosolid Contamination on Farmland

    Johnson County, Texas, recently requested federal disaster relief over PFAS contamination from biosolid applications on farmland, adding perhaps another theory of redress for such contamination of soils and water. PFAS, which stands for per- and polyfluoroalkyl substances, are man-made chemicals applied in various consumer and industrial uses. PFAS do not easily degrade in the environment and are often referred to as “forever chemicals.” While scientists are early in understanding PFAS’ full range of health and environmental effects, studies indicate links to adverse health outcomes, including cancer and liver and thyroid functioning. PFAS have been released across the county in the air, into water, and onto land. The federal disaster request supplements Johnson County residents’ 2024 federal environmental lawsuitagainst the Environmental Protection Agency (EPA) and state tort claim against a fertilizer manufacturer.
     
    Biosolid applications – the disposal of the solid-waste remnants of treated wastewater – have been regulated since 1987 under the Clean Water Act §405(d) (CWA), whereby states may permit application and dispersal in a manner that is “a local determination.”  The majority of states have biosolid application permitting programs, though Maine banned biosolid applications statewide due to concerns over PFAS contamination. In the South, Texas has introduced PFAS standards for biosolids, whereas Oklahoma and Mississippi have introduced legislation to ban biosolid applications outright. 
     
    The Texas farmers’ federal lawsuit alleges EPA’s failure to identify and regulate various PFAS compounds under authority and mandate of the CWA and the Administrative Procedures Act. They complain the EPA failed to add PFAS as toxic substances in the biennial review mandated in the 1987 amendments. The EPA responds that listing of toxic pollutants is discretionary. The CWA requires the EPA to make toxic listings “on the basis of available information,” and plaintiffs cite a sizable body of research in their complaint. In the months before the federal lawsuit, the EPA listed PFAS as toxic substances under other federal statutes, including the Safe Drinking Water Act, the Comprehensive Environmental Response Cleanup and Liability Act, and the Toxic Substances Control Act. 
     
    The state tort case – Farmer v. Synagro – seeks compensation from the manufacturer of a biosolid-based fertilizer that plaintiffs claim damaged their properties and farm operations. Such common law actions normally couple federal citizen suits. The legal theories in Farmer v. Synagro are strict liability (for producing and marketing an “unreasonably dangerous” product), negligence (foreseeable harm from unreasonable risk), and private nuisance (for unreasonable interference with use and enjoyment of their land). Death of farm animals and diminution in property value are among plaintiffs’ allegations of damages. Defenses to liability in these cases vary by state and may emerge relative to risk assumption and presumptions against negligence that applicators might invoke, considering the applications were regulated and permitted. Legal theories concerning recovery for damage from biosolid applications are also being tested in litigation in Maine, Massachusetts, Wisconsin, and elsewhere.


    Brannon, Andrew. “Addressing PFAS Biosolid Contamination on Farmland.Southern Ag Today 5(9.5). February 28, 2025. Permalink

  • With Sales Closing Dates Looming, Supplemental Crop Insurance Decisions Are Upon Us

    With Sales Closing Dates Looming, Supplemental Crop Insurance Decisions Are Upon Us

    Crop insurance sales closing dates for the 2025 crop year are fast approaching for much of the country.  On top of multi-peril crop insurance (MPCI) decisions, producers have supplemental policies to consider such as the Supplemental Coverage Option (SCO) and the Stacked Income Protection Plan for upland cotton (STAX).  STAX and SCO are area-wide crop insurance tools that serve as complements to underlying MPCI policies but have implications for other safety net programs: Agriculture Risk Coverage (ARC) and Price Loss Coverage (PLC).  Enrollment of seed cotton base acres on a farm in ARC or PLC makes the farm ineligible for STAX.  Enrollment in SCO makes a producer ineligible for ARC.  Therefore, producers have the following options:

    • Purchase STAX (upland cotton only), with or without a companion policy;
    • Purchase SCO, with an underlying policy, and enroll base acres in PLC;
    • Enroll base acres in ARC only;
    • Enroll base acres in PLC only. 

    Producers must consider these options carefully, as risk management decisions may significantly impact a farm’s bottom line.  A July 2024 Southern Ag Today article by Stiles and Biram took a closer look at the case of STAX for upland cotton.  They illustrated that STAX generally provides more protection against an area yield loss or a revenue loss due to both area yield and price effects rather than a price decline alone.  Both STAX and SCO indemnities are triggered by loss in area revenue (or a loss in area yield for SCO if the underlying MPCI policy is a yield protection policy).  Findings highlighted in this article along with other available research may help guide producers as they decide if they prefer more protection against price loss, yield loss, or revenue loss.  Producers should always evaluate their individual situations and consult their crop insurance agent or other trusted professionals to ensure they are fully informed of all available policies and products.

    The following tables highlight sales closing dates and provide the current RMA projected prices (used for STAX for upland cotton and SCO for other commodities) from each price discovery period across Southern states for cotton, corn, soybeans, and grain sorghum.  The tables also include effective reference prices and the most recent marketing year average (MYA) price projections provided by FAPRI for use in the AFPC online ARC-CO/PLC Decision Aid.  These MYA prices are components in both ARC and PLC payment calculations.

    Table 1. Cotton – Sales Closing Dates and 2025 Projected Prices

    StatesProjected Price Discovery PeriodSales Closing Date2025 Projected PriceEffective Reference Price3Projected MYA Price3
    Southern TX12/15 – 1/1431-Jan$ 0.70$ 0.3670$ 0.3402
    AL, AR, FL, GA, LA, MS, NC, SC, Central TX1/15 – 2/1428-Feb$ 0.69
    OK, TN, VA, Northern TX2/1 – 2/2815-Mar$ 0.691
    1. Projected price in discovery
    2. FAPRI price projection from AFPC ARC-CO/PLC Decision Aid
    3. Effective Reference Price and Projected MYA Prices shown are for Seed Cotton

    Table 2. Corn – Sales Closing Dates and 2025 Projected Prices

    StatesProjected Price Discovery PeriodSales Closing Date2025 Projected PriceEffective Reference PriceProjected MYA Price
    Southern TX12/15 – 1/1431-Jan$ 4.41$ 4.26$ 4.282
    Central TX1/1 – 1/3115-Feb$ 4.55
    AL, FL, GA, LA, SC1/15 – 2/1428-Feb$ 4.66
    AR, MS, NC1/15 – 2/1428-Feb$ 4.65
    KY, OK, TN, VA, Northern TX2/1 – 2/2815-Mar$ 4.721
    1. Projected price in discovery
    2. FAPRI price projection from AFPC ARC-CO/PLC Decision Aid

    Table 3. Soybeans – Sales Closing Dates and 2025 Projected Prices

    StatesProjected Price Discovery PeriodSales Closing Date2025 Projected PriceEffective Reference PriceProjected MYA Price
    Southern TX12/15 – 1/1431-Jan$ 10.08$ 9.66$ 10.062
    AR, LA, MS, Central TX1/15 – 2/1428-Feb$ 10.51
    AL, FL, GA, NC, SC1/15 – 2/1428-Feb$ 10.60
    KY, TN, Northern TX2/1 – 2/2815-Mar$ 10.571
    OK, VA2/1 – 2/2815-Mar$ 10.661
    1. Projected price in discovery
    2. FAPRI price projection from AFPC ARC-CO/PLC Decision Aid

    Table 4. Grain Sorghum – Sales Closing Dates and 2025 Projected Prices

    StatesProjected Price Discovery PeriodSales Closing Date2025 Projected PriceEffective Reference PriceProjected MYA Price
    Southern TX12/15 – 1/1431-Jan$ 4.43$ 4.51$ 3.842
    Central TX1/1 – 1/3115-Feb$ 4.57
    AL, AR, FL, GA, LA, MS, NC, SC1/15 – 2/1428-Feb$ 4.67
    KY, OK, TN, VA, Northern TX2/1 – 2/2815-Mar$ 4.741
    1. Projected price in discovery
    2. FAPRI price projection from AFPC ARC-CO/PLC Decision Aid

    Nelson, Henry, Natalie Graff, and J. Marc Raulston. “With Sales Closing Dates Looming, Supplemental Crop Insurance Decisions Are Upon Us.Southern Ag Today 5(9.4). February 27, 2025. Permalink

  • Late Season Indicators for 2024/25 U.S. Cotton Production

    Late Season Indicators for 2024/25 U.S. Cotton Production

    The February WASDE included an updated U.S. cotton balance sheet for 2024/25 (third column of numbers in the table below), with very minor month-over-month adjustments.  The supply side variables were unchanged from January, as were projected U.S. exports.  U.S. domestic use was cut 100,000 bales, which went straight to the bottom line of 100,000 additional ending stocks compared to last month.  This leaves U.S. ending stocks at a more bearish 4.9 million bales.

    It is not surprising that the USDA left U.S. production unchanged from their January forecast.  As the ginning season winds down, cotton has two reliable measures to forecast production:  1) a count of actual physical bales (“running bales”) that are classed for fiber quality, and 2) a survey of running bales ginned.  Actual physical bales vary in weight but are around 500 pounds.  On the other hand, USDA-NASS cotton production forecasts and WASDE numbers are expressed in 480 pound “statistical bales.”  For conversion purposes, I assume a conversion factor of 1.02755 statistical bales for one running bale.

    For the week ending February 6, USDA-AMS classing accounted for 13,855,096 running bales classed (or 14,236,804 statistical bales, about 99% of USDA-NASS’s production forecast). As of February 1, USDA-NASS also forecasted 13,961,700 running bales ginned (or 14,346,345 statistical bales, within about 60,000 bales of USDA-NASS’s production forecast).  So, the end of the 2024 crop processing is in sight, if not here, although they may sit on it until the final classing and ginning reports (typically in May). I don’t think there are any market changing surprises left on the production side that would affect prices moving forward.


    Robinson, John. “Late Season Indicators for 2024/25 U.S. Cotton Production.” Southern Ag Today 5(9.3). February 26, 2025. Permalink

  • February Cattle on Feed 

    February Cattle on Feed 

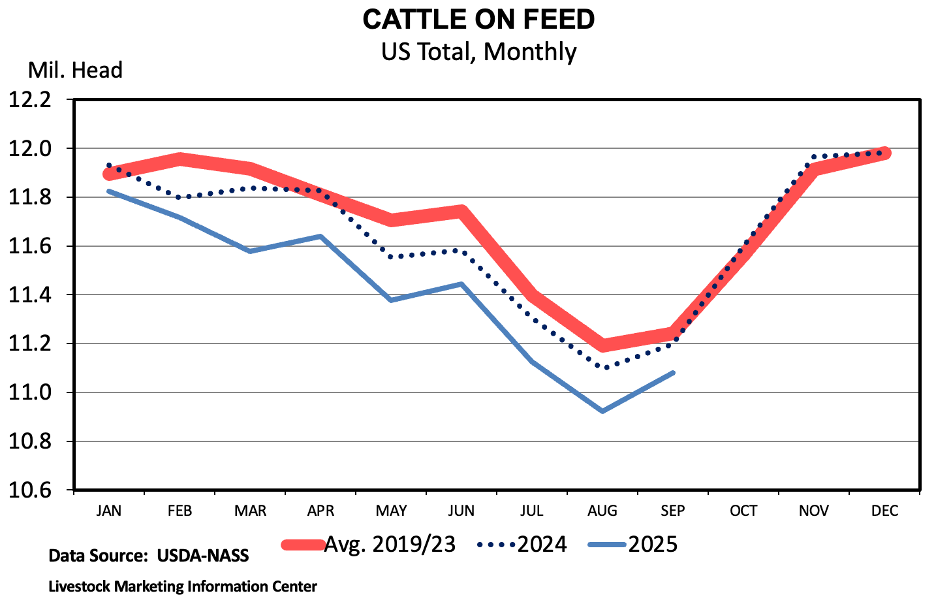
    The February Cattle on Feed report was released this past Friday afternoon and reported 11.7 million head of cattle in feedlots on February 1st. This was a 0.7 percent decrease from February 1, 2024. Marketings were up 1.4 percent year-over-year. There were no big surprises in the report relative to pre-report expectations, but there were some interesting points in the report. 

    Placements of cattle into feedlots during January were up 1.7 percent above January 2024. Weather and winter storms delayed January 2024 placements, so the increase shown for 2025 is partially driven by a lower 2024 number. In 2024, placements were higher in February than they were in January which was the first time that had occurred since 1996. We have not seen those same challenges so far in 2025, but February placements are likely to be impacted by the lingering impacts of the Mexico cattle import ban. 

    A regional look at the data implies an impact of the Mexico import ban on January placements. January 2025 placements of cattle into feedlots in Texas were 50,000 head lower than a year ago which is a 14.5 percent decrease. This was offset by a 60,000 head (15.4 percent) increase in Kansas and a 30,000 head (5.9 percent) increase in Nebraska during January.  

    The largest increase in placements was in the 700-799 pound weight range which were up 30,000 head (6.3 percent) from a year ago. Placements were up across all weight classes in Nebraska and Kansas and lower across all weight classes in Texas. Placements of cattle into Texas feedlots weighing less than 699 pounds were down 35,000 head during January compared to a year ago. 

    The data mentioned above comes from feedlots with at least 1,000 head capacity. However, another interesting part of the February report is the detail about the distribution of cattle across feedlot sizes. There are 2,105 feedlots with at least 1,000 head feeding capacity. These feedlots housed 83 percent of cattle on feed as of January 1, 2025. The remaining 17 percent of cattle on feed were located across the 24,000 feedlots with a capacity of less than 1,000 head. Of the 1,000+ capacity feedlots, there were 80 that have a capacity of 50,000 head or more, and these were home to 35 percent of the total U.S. cattle on feed on January 1.


    Maples, Josh. “February Cattle on Feed.” Southern Ag Today 5(9.2). February 25, 2025. Permalink