Southern timber prices in the first quarter of 2023 fell year-over-year for all product types. According to TimberMart-South, average prices dropped 7% to $25.87/ton for pine sawtimber, 15% to $9.39/ton for pine pulpwood, 5% to $31.95/ton for hardwood sawtimber, and 25% to $9.07/ton for hardwood pulpwood. However, the pine sawtimber prices are still above the pre-pandemic level.
The weakened timber prices are mainly caused by reduced demand for lumber. Higher mortgage rates, deteriorated housing affordability, and worries of an economic slowdown have cooled the general housing market and resulted in reduced housing starts (major driver of lumber and structural panel products). Lumber prices skyrocketed during the pandemic but have receded sharply since mid-2022 and have been stabilizing at the long-term average level.
Although we use south-wide average prices, it is hard to say we have an integrated timber market in the U.S. South. It is actually made up of multiple local timber markets and the timber prices are largely determined by local timber inventory, mill types and capacities, logging capacity, site accessibility, transportation conditions, etc. Therefore, some local timber markets may fare relatively better than others. For example, the average pine sawtimber prices in southeast Georgia, north Florida, and east Alabama are generally higher than the average prices in the West Gulf regions.
Considering the oversupply of sawtimber in the region, whether the decrease in timber prices will continue or not largely depends on factors from the demand side. Softwood lumber production capacity in the South has increased 20% in the past 5 years and reached 26.9 billion board feet (bbf) in 2022 (Forisk, 2022a). Announced greenfield construction and existing mill expansion suggest that the capacity could increase by another 5.1 bbf by 2025 (Forisk, 2022b). However, economic outlook (especially the housing market) adds uncertainties to the market.
References
Forisk. 2022a. Forisk North American forest industry capacity database.
Forisk. 2022b. Forisk Research Quarterly: Fourth Quarter 2022.
I hope you all have a great holiday, celebrating our country’s independence. I suspect a bunch of us will spend some time out tending a grill or smoker for a bit this week. With that in mind today’s article looks at retail and wholesale meat prices.
Retail meat prices for beef, pork, and chicken, reported monthly by the Bureau of Labor Statistics and USDA, have been moving in different directions. Retail pork prices were below a year ago while chicken and beef prices were above a year ago. Each market is responding to their own supply and demand issues which are causing prices to move in opposite directions. But, all share the issues of higher production costs including those to get the products from where they are produced to your local meat case.
Choice beef prices hit a record high of $8.08 per pound in May (the latest data), surpassing the $7.90 per pound in October 2021. The all-fresh beef price data series was just a couple of cents per pound off its record high. Tighter beef supplies, down 4.8 percent compared to a year ago, coupled with continued consumer buying is pushing prices higher. Fewer cows going to market and fewer fed cattle have led to higher ground beef prices. The start of summer grilling season provides a little demand boost too.
The retail pork price was $4.73 per pound in May. That was 3.2 percent below last year and unchanged from the month before. Pork production for the year is 0.3 percent more than last year. In the wholesale pork market, prices for cuts like loins, bellies, and ribs have languished this year, in part, due to a little more production but, also due to some apparent demand problems. Wholesale pork cut prices have started to increase in the last couple of weeks and that will likely bring pressure for higher retail prices if the consumer demand is there.
Chicken (broiler) production is 1.5 percent larger than last year, so far. The reported monthly retail price was $2.45 per pound, just slightly above last year’s $2.42 per pound. Wholesale chicken cut prices have been well below last year’s level most of the year. Boneless, skinless breasts were $1.29 per pound compared to $3.02 at this time last year. Wings were $0.88 per pound versus $1.82 last year. USDA’s weekly featuring report indicated a few more grocery stores with retail features and specials on chicken prices this week and lower prices than year ago on breasts and wings.
Regardless of your grilling choices this holiday, I hope you have a great holiday celebration! Happy Fourth!
Throughout the year, the United States Department of Agriculture (USDA) updates its estimates of U.S. supply and demand factors for selected crops. This article explores projection updates, via the USDA Acreage Report (AR), released on June 30, 2023, and marketing and risk management implications. The initial estimates for the 2023/24 growing season planted acreage were released in February at the USDA Agricultural Outlook Forum (AOF) (Smith and Gardner, 2023). The estimates were then updated in March via the Prospective Planting Report (PPR) (Biram and Maples, 2023). Projected acreage for five crops (corn, soybeans, wheat, rice, and cotton) and the percentage change in acreage estimates can be found in Table 1.
The initial estimate for corn acreage was 91 million acres in February, which was increased to 92 million in March, and now sits at 94 million in June. This is the third-highest number of acres planted to corn since 1944 (USDA-NASS, 2023). It is worth noting that corn harvested for grain makes up a smaller number of acres at 86.3 million acres but is still up 9% from last year (USDA-NASS, 2023). Estimated soybean acreage dropped 4.6% to 83.5 million acres in the most recent acreage report, whereas wheat acreage has been similar in all three reports. Rice acres have increased sequentially by month and are up 7.5% from the initial February projection. Cotton acres increased from 10.9 million acres to 11.3 million acres in March before finding common ground at an estimated 11.1 million planted acres in June.
Looking at the possible price impacts in the acreage report, we take a close look at corn and soybeans, which have experienced the largest acreage changes. Recent upticks in the prices of both commodities have been driven by drought throughout major crop-producing states, causing a weather induced “crop scare event.” During this crop scare, the drought impacted corn and soybean supply expectations which caused market and futures prices to increase drastically. Prices peaked on June 21st and began to fall due to rainfall in key production states such as Indiana, Illinois, and Iowa. The large increase in corn acreage in the June acreage report will make the corn market price less susceptible to future supply shocks, causing a lower price environment. However, the opposite may hold true for soybeans which have dropped 4 million acres. As there are fewer soybean acres than previously projected, soybean prices could be more susceptible to further price increases due to detrimental weather, which causes deterioration in crop conditions and expected yield.
Corn and soybeans had complete opposite price responses to the June Acreage Report, with the corn price decreasing 33 cents to $4.95/bu and soybeans increasing 77 cents to $13.42/bu. Rough rice and cotton futures had essentially no response to the June acreage report with rough rice remaining flat at $15.25/cwt and cotton only increasing to 80.37 cents/lb from 79.04 cents/lb. A marketing tool available to producers that could be considered is buying a put option to place a floor on the futures price. A put option gives the right but not the obligation to sell a futures contract at the strike price specified in the put option contract, so long as the futures price is below the strike price at the time the option is exercised (i.e., “in the money”). Producers can use this strategy to protect against futures market price declines while allowing them to benefit if prices rally. See Biram and Smith (2022) for an explanation of using options to augment one’s risk management plan. Additionally, producers can manage price risk in their local cash market by locking in prices received at harvest at a local grain elevator or grain purchaser through forward contracting (see Maples, 2023).
Lastly, we take a look at the potential price protection a producer has if they purchased crop insurance by considering the futures price as of the afternoon of June 30, 2023, relative to the Projected Crop Insurance Price released by USDA-RMA in the winter (Table 2). Harvest month futures contracts for corn, soybeans, rice, and cotton are lower relative to their respective Projected Price with corn having a substantially lower price. Notably, if the 2023 growing season were to end today, holding 2023 harvest yield the same as APH yield, 85% Revenue Protection would already trigger an indemnity for corn with ZCZ23 being 83% of the Projected Price. The current harvest month corn futures price would also trigger an indemnity under Enhanced Coverage Option (ECO) and Supplemental Coverage Option (SCO), assuming no difference in the county expected harvest yield and established APH. This is because ECO and SCO trigger an indemnity once county-level revenue falls below 95% and 86% of the county-level revenue guarantee, respectively. We also see ECO would trigger an indemnity for rice, assuming no change in the expected harvest yield.
Table 1: Acres Planted by USDA Report and Percentage Change
Report
AOF
PPR
AR
% Change from February
% Change from March
Month
February
March
June
Corn Acres (Millions)
91
92.0
94.1
3.4%
2.3%
Soybean Acres (Millions)
87.5
87.5
83.5
-4.6%
-4.6%
Wheat Acres (Millions)
49.5
49.9
49.6
0.3%
-0.5%
Rice Acres (Millions)
2.5
2.6
2.7
7.5%
4.0%
Cotton Acres (Millions)
10.9
11.3
11.1
1.7%
-1.5%
Table 2. Current Futures Price as a Percentage of RMA Projected Crop Insurance Price
On May 25, 2023, the United States Supreme Court released its highly-anticipated opinion in Sackett v. EPA, a lawsuit concerning the scope of wetlands jurisdiction under the Clean Water Act (“CWA”). This decision from the Court intends to clarify when a wetland may be considered a water of the United States or WOTUS. Only those waters identified as a WOTUS receive CWA protection.
Prior to Sackett, the Environmental Protection Agency (“EPA”) interpreted WOTUS according to the Supreme Court’s 2006 decision, Rapanos v. U.S, which also considered the scope of wetlands jurisdiction. Instead of issuing a majority opinion in Rapanos, the Court issued both a plurality opinion – an opinion that the largest number of Justices signed onto, but not enough to result in a majority – and a concurring opinion written by Justice Kennedy who agreed in the outcome of the case, but not the legal reasoning. In the plurality opinion, the justices concluded that only those wetlands that share a “continuous surface connection” with relatively permanent bodies of water should be considered WOTUS. The concurrence concluded that wetland jurisdiction should be determined based on whether the wetland possessed a “significant nexus” to a recognized WOTUS. A significant nexus exists when a wetland “significantly affect[s] the chemical, physical, and biological integrity of other covered waters[.]”
Following Rapanos, EPA engaged in several rulemaking attempts to define WOTUS, including the most recent rule finalized earlier this year that interpreted WOTUS to include wetlands that meet either test. However, many felt that the “significant nexus” test created uncertainty for regulated parties. The plaintiffs in Sackett asked the Supreme Court to formally adopt the “continuous surface connection” test, arguing that the plurality’s test was both a more accurate interpretation of the CWA and provided greater clarity for landowners. The Court agreed with the plaintiffs and decided to officially overturn the “significant nexus” test and confirm that only those wetlands that share a continuous surface water connection with relatively permanent bodies of water could fall under the definition of WOTUS and receive full CWA protection. To learn more about the Court’s decision, click here.
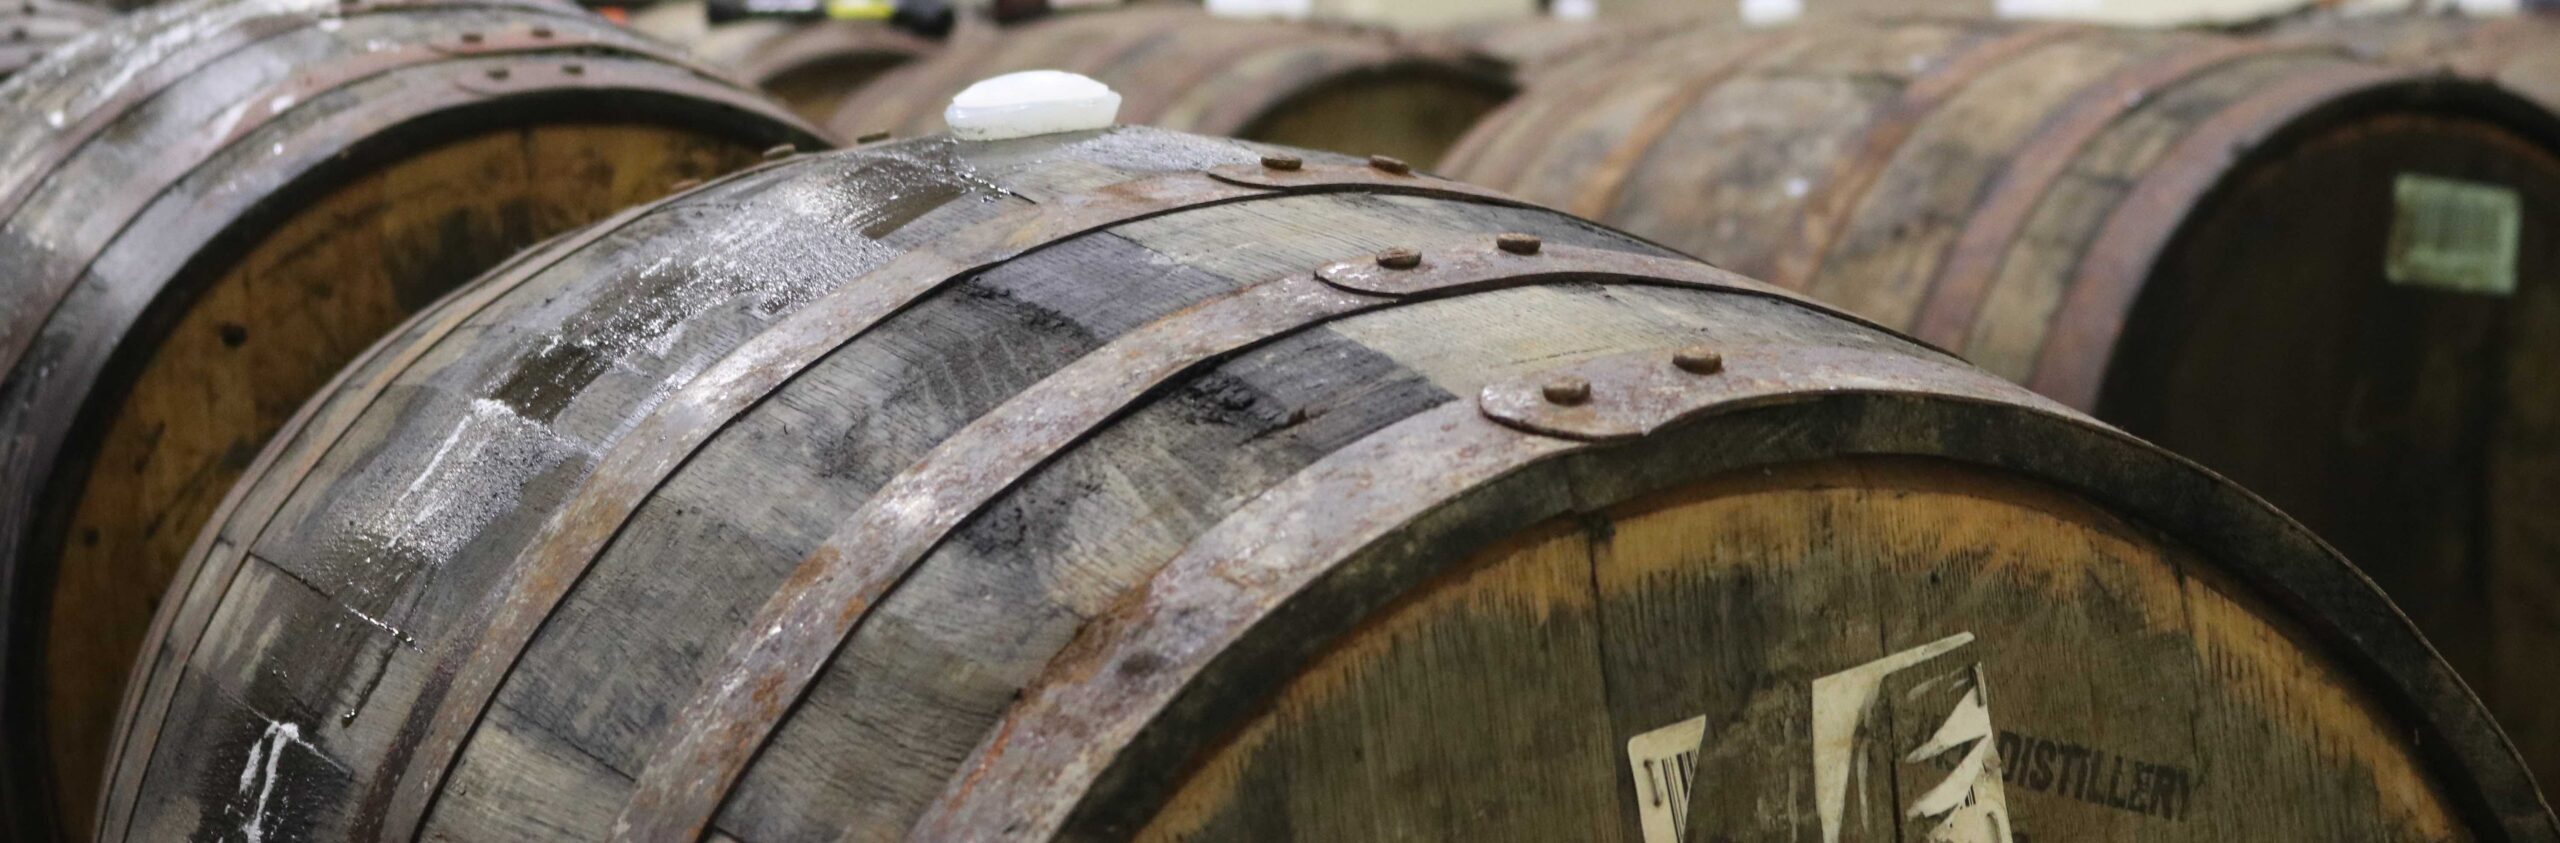
When considering U.S. agricultural exports, we often think about major bulk commodities like soybeans, corn, and cotton, as well as animal products such as beef, pork, poultry, and dairy. Rarely do we consider whiskey (which includes bourbon, whiskey, rye whiskey), despite distilled spirits being a major U.S. export, listed as an official agricultural category by both the U.S. Department of Agriculture (USDA) and the World Trade Organization (WTO), and despite the sectors use of corn, barley, and rye as primary inputs for production. In the recent Outlook for U.S. Agricultural Trade published by USDA, U.S. agricultural exports in fiscal year (FY) 2023 are projected to decrease to $181.0 billion, which is significantly lower than exports in FY 2022 ($196.4 billion), primarily driven by expected decreases in corn, wheat, beef, and poultry exports (USDA, ERS, 2023). In spite of this expected decline overall, U.S. whiskey exports should increase, as evidenced by exports as of April 2023.
Figure 1 shows U.S. whiskey exports in FY 2023 (as of April, October-April) versus FY 2022. Note that whiskey exports in FY 2023 are significantly higher both in terms of value and volume. As of this April, U.S. whiskey exports were valued at $1.1 billion, which is a 73% increase when compared to exports during the same period in FY2022 ($637 million). In terms of volume, exports during this period were 25% higher in FY 2023 (118 million proof liters) when compared to FY 2022 (94 million proof liters). Given the relatively lower increase in volume, the overall increase in due to higher prices. This could be due to inflation as well as increased sales of higher quality products. Note that the average unit value in FY 2022 (October – April) was $6.75 per liter, but this increased to $9.34 per liter in FY 2023. The overall increase is mostly driven by exports from Tennessee (up 125% increase). Tennessee accounted for over 70% of total U.S. exports this fiscal year. As far as destination markets, most of this increase was due to higher sales to the EU27, including a more than 400% increase in exports to the Netherlands. The U.S. also experienced significantly higher sales in Australia and the U.A.E. (USDA, FAS, 2023).
Figure 1. U.S. Whiskey Exports: 2022 and 2023 Year-to-Date (fiscal year – October-April)