Blog

  • Adjusting Reference Prices Based on Changes in Cost of Production

    Adjusting Reference Prices Based on Changes in Cost of Production

    A recent Agri-Pulse article explored “raising reference prices based on a commodity’s relative input costs” suggesting that the approach “could benefit some southern crops over commodities such as soybeans and corn.”  In the article, I was quoted as saying that an “across-the-board increase in PLC reference prices could penalize farmers who don’t grow corn, soybeans and wheat, which together account for 85% of the acreage eligible for the program.”

    While the article has generated a significant amount of interest (judging by the call and email volume over the past week), I do think additional context is important.  My purpose in making the statement was this:

    • Corn, soybeans, and wheat account for 85% of the base acres nationwide.  As a result, decisions made for those three crops will necessarily drive the vast majority of the spending in Title 1 of the farm bill.
    • Because each crop is different – with different risk profiles and with producers who have varying views on the various components of the farm safety net – policymakers are in no way constrained to simply making across-the-board adjustments to the farm safety net.

    I also argued – and continue to do so – that cost of production is an appropriate metric for making decisions about Reference Prices.  The entire point of the traditional farm safety in Title 1 is for it to be reflective of the cost of producing a crop.  I suspect that most producers reading this would agree with that point.  After all, the primary complaint we’ve heard from the hundreds of producers we work with around the country over the past several years is that the Title 1 safety net has not kept up with the cost of doing business.  

    The article culminated with a comparison of corn and rice that has led some to ask if I’m suggesting that corn producers (and soybean and wheat producers for that matter) are not in need of a Reference Price increase.  To clear up any confusion, in the space that remains, I will quickly address this point for corn, soybeans, and wheat.

    Using publicly available data from USDA’s Economic Research Service (USDA-ERS), I compared the total cost of production from 2012-2014 (the 3-year period during which the current Reference Prices were initially established) to the most recent 3-year period for which data is available (2020-2022).  As noted in Figure 1, the average cost of production across the United States for corn, soybeans, and wheat increased by 15%, 21%, and 19% respectively over that timeframe.  It is also important to note that the impact was not uniform across the nation.  For example, while the increase in the national average cost of producing corn may have been 15%, costs in the Northern Crescent (including Michigan, Wisconsin, and parts of Minnesota), the Prairie Gateway, and the Southern Seaboard were all in excess of 20%.  A similar dynamic exists for soybeans and wheat.  For example, the national average increase for wheat is 19%, but the cost of production for growers in the Northern Great Plains increased more than 25%. 

    Bottom line:  corn, soybean, and wheat producers are absolutely justified in requesting Reference Price increases.  Depending on the region in which you produce, the sense of urgency may be even greater.

    Figure 1.  Percent Change in Cost of Production by Region, 2020-2022 versus 2012-2014.

    Source:  author calculations of USDA-ERS Commodity Costs and Returns data. 
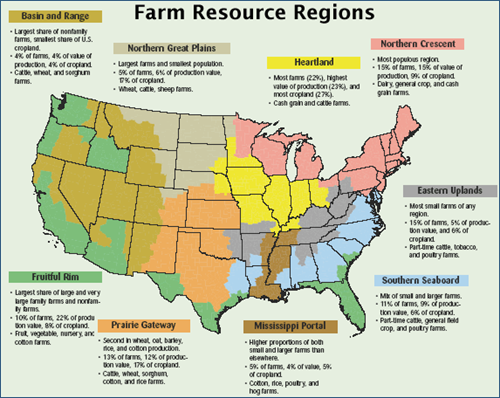
    NOTE:  for assistance in deciphering the regions, see this map.

    Fischer, Bart. “Adjusting Reference Prices Based on Changes in Cost of Production.Southern Ag Today 3(23.4). June 8, 2023. Permalink

  • Current Non-Real Estate Farm Debt

    Current Non-Real Estate Farm Debt

    As mentioned in previous Southern Ag Today (SAT) articles (Martinez and Ferguson 2022), monitoring Non-Real Estate Farm Debt provides insight into debt health. Last year had periods of drought and increased input prices for producers. At the time of this article, planting is complete, producers are bailing hay, input prices have come down, and cattle prices are the highest since 2015. But, through the first quarter of 2023, there are mixed signals from the most recent call reports. As a refresher, every commercial bank in the U.S. submits quarterly Reports of Condition and Income which are known as call reports. Within these call reports are totals of agricultural loans and the status (on time or late) of the loans. Figure 1 displays the total loan volume (yellow line) and total loan volume for all three late type volumes (30-89 days late, 90+ days late, non-Accrual) for the last nine quarters. The totals are for all the Southern Ag Today States. 

                Through the first quarter of 2023, non-accrual (blue line) loans continued to decrease, which is positive, and loans that are 90+ days late (grey line) remained relatively the same. Total loans (yellow line) are down from the previous quarter, which is expected due to seasonality trends. But total loan debt is up 4.8% compared to a year ago, which could be due to the effects of input price increases in 2022. The most concerning statistic is the loans that are 30-89 days late (orange line). Debt that is 30-89 days late is up 5.2% from a year ago, and the highest since Q1 of 2021.  Q1 is seasonally the highest quarter for 30-89 days late loans, but given that it’s up from a year ago, this loan type will provide an indication of debt health moving forward in the next round of call reports that come in a few months. 

                From a sky high view, the call reports indicate that there are some possible caution signals for debt in the SAT states. However, total non-current debt is approximately 1%, which is still relatively low. The next two quarters will provide answers if the signals are false alarms or true signals of concern. In the coming months, it is crucial that producers are mindful of their working capital and continue the positive production and risk management strategies they have implemented thus far. 

    Figure 1. Non-Real Estate Farm Debt from 2021 Q1- 2023 Q1

    Source: Federal Financial Institutions Examination Council

    References

    Martinez, Charley, and Haylee Ferguson. “Current Non-Real Estate Farm Debt“. Southern Ag Today 2(30.3). July 20, 2022. Permalink


    Martinez, Charley. “Current Non-Real Estate Farm Debt.” Southern Ag Today 3(23.3). June 7, 2023. Permalink

  • $185

    $185

    Fed cattle futures prices surged to $185 for April 2024 and $175 in the nearby (June) contract, at the time of this writing.  This rocket ship ride to record prices is fueled by some fundamental market conditions and some conditions outside of the cattle and beef market.

    Cash fed cattle prices have increased and some of the increase in futures prices is the futures playing catch up.  Feeder cattle prices are along for the ride.  Feeder cattle, 7-800 pound steers, in the South approached $200 per cwt while those in the Southern Plains hit $213 in local auctions.  

    On the fundamental side, cattle and beef supplies are certainly tighter.  Daily average fed steer and heifer slaughter in May is 2.9 percent smaller than last year.  Beef production over the last 4 weeks is 3.9 percent smaller than last year.  Beef production reflects fewer beef cows going to market and lighter fed cattle dressed weights.  

    On the demand side of the fundamental ledger, beef demand appears to continue to support higher prices. While packer margins are certainly much smaller, packers continue to demand cattle (us economists call this “derived demand”).  Consumers continue to buy beef and there is little evidence of large scale switching to less expensive meats.  

    Other, broader market considerations are also working to boost prices.  The recent budget deal to avoid U.S. default provided a boost to the stock market that spilled over into other commodity markets.  Continued strong employment numbers are supported income and demand.  These factors contribute to some reduced fears of recession and better beef demand expectations.  

    On balance, tighter supplies and good demand have boosted prices.  Other economic conditions have added some fuel for even higher prices.  Some good questions remain.  Are calf prices high enough to kick off significant herd expansion?  Competing meats are becoming cheaper relative to beef –   will we see some evidence of consumer purchasing changes?  For all the questions out there, no doubt higher prices are good news for ranchers after multiple years of tight or negative margins.


    Maples, Josh, and David Anderson.“$185.” Southern Ag Today 3(23.2). June 6, 2023. Permalink

  • The Impact of Interest Rates and Basis on Net Cash Price for Corn

    The Impact of Interest Rates and Basis on Net Cash Price for Corn

    Interest rates have become an important consideration for row crop producers. From December 2008 until March 2022, interest rates were historically low with the bank prime rate between 3.25% and 5.5%. Low interest rates allowed producers to borrow money at minor costs to cover the cost of production and capital expenditures. Additionally, low interest rates muted the costs of carrying crops in storage. Over the past year, rising interest rates have required additional scrutiny for producers making management and marketing decisions. 

    From March 16, 2022, to May 1, 2023, the bank prime rate increased 4.75 points (3.25% to 8.0%). The rapid interest rate increase has impacted production costs, capital investment, and marketing for producers. This article examines the impact of interest rates and basis on net cash selling price for corn. Producers holding grain in storage should estimate interest costs as well as other storage costs.  Here we only show the impact of interest costs at the bank prime lending rate. For producers that do not have outstanding operating loans, they should consider the forgone investment interest rate.  The rapid increase in interest rates makes this analysis even more critical as the Federal Reserve contemplates further interest rate increases.

    The daily interest cost for corn in storage can be estimated as the nearby futures price plus basis multiplied by the interest rate divided by 365 days (Figure 1). Movements in the nearby futures market, changes in basis, and changes in the interest rate will impact the daily interest cost. Daily interest expenses can be summed from one date to another to estimate the accumulated interest cost over the period that grain is held in storage. For example, in Figure 1, the accumulated interest from September 23 to May 1 was $0.30/bu. Accumulated interest cost is less at the start and increases the longer corn is held. 

    Figure 1. Bank Prime Rate and Daily and Accumulated Interest for Unsold Corn

    *Daily interest = (futures + basis) x (bank prime rate / 365)
    *Accumulated interest = sum of daily interest while held in storage.

    Futures prices and basis prices change daily, affecting cash prices producers receive. Using nearby corn futures prices, basis prices from USDA AMS for Northwest Tennessee, and daily accumulated interest costs, a net price was estimated from September 23, 2022, to May 1, 2023 (Figure 2). The net price can be compared to the nearby futures price. In September and October, basis was weak due to the large quantity of available corn at harvest and transportation challenges, due to low water levels on the Mississippi River. The accumulated interest cost was less than 5 cents per bushel through the end of October. The net price peaked on December 27 at $7.06 per bushel when accumulated interest was $0.12 per bushel, and the basis was 35 cents per bushel over the March futures contract. Based on Figure 2, the best time to make sales at elevators and barge points in Northwest Tennessee occurred between November 3 and February 21. Since the end of February, declines in futures markets and increased accumulated interest costs have resulted in substantially lower net prices for producers. Higher interest rates have necessitated a more stringent accounting of interest costs.  Producers should regularly evaluate these costs along with future expected prices when making marketing decisions to find the optimal time to sell stored grain.

    Figure 2. Nearby Corn Futures Price and Net (Futures + Basis – Interest) Price 

    References:

    Barchart.com. Nearby Corn Historical Daily Nearby Closing Prices. Accessed at: https://www.barchart.com/futures/quotes/ZCK23/historical-download

    Board of Governors of the Federal Reserve System (US), Bank Prime Loan Rate [DPRIME], retrieved from FRED, Federal Reserve Bank of St. Louis; https://fred.stlouisfed.org/series/DPRIME, May 1, 2023.

    U.S. Department of Agriculture Agricultural Marketing Service (USDA – AMS). AMS Livestock, Poultry and Grain Market News. Tennessee Daily Grain Bids.  Accessed at: https://www.ams.usda.gov/mnreports/ams_3088.pdf


    Smith, Aaron, and William “Bill” Johnson. “The Impact of Interest Rates and Basis on Net Cash Price for Corn.” Southern Ag Today 3(23.1). June 5, 2023. Permalink

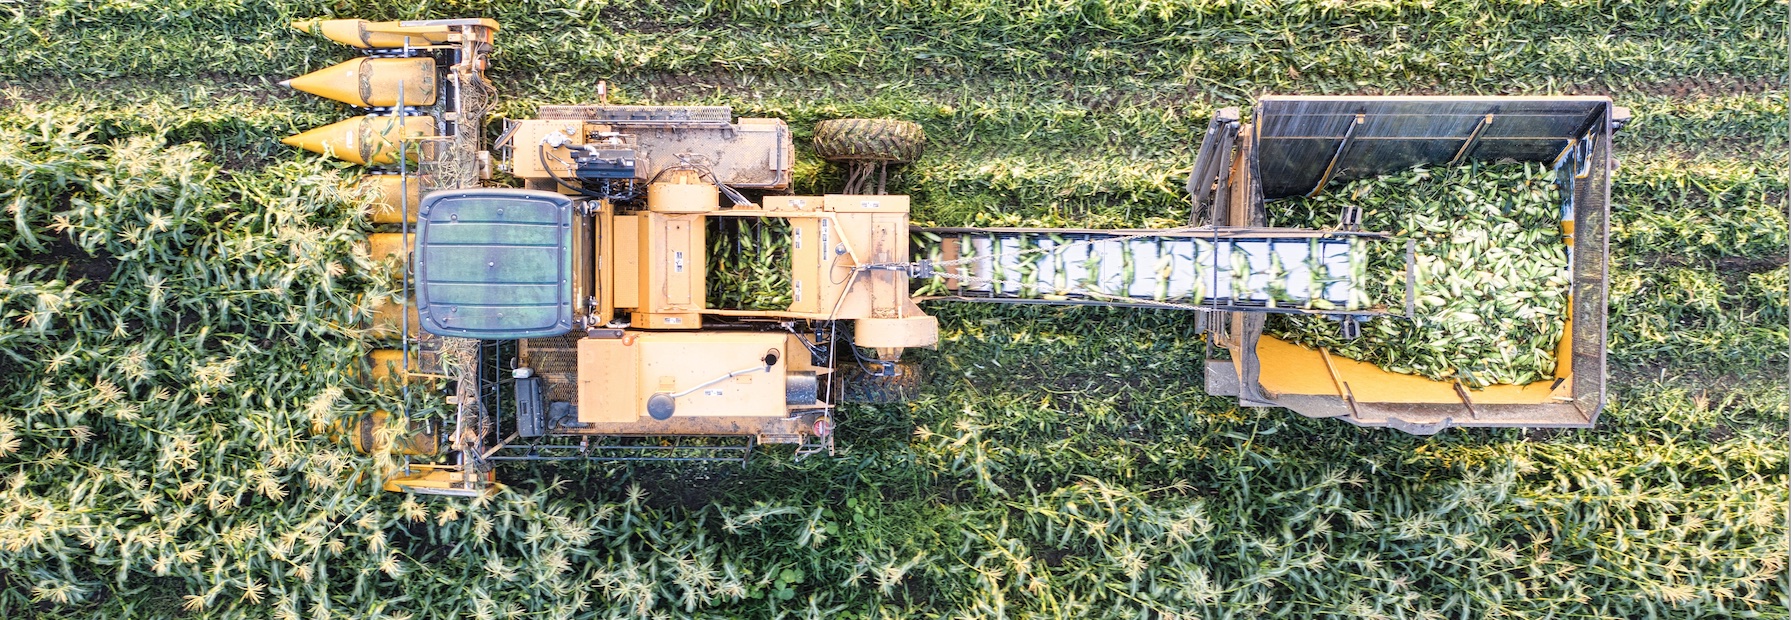
    Photo by Tom Fisk: https://www.pexels.com/photo/drone-shot-of-a-combine-harvester-harvesting-corn-10213238/

  • Interested in Forming a Cooperative? Take the Cooperative Challenge!

    Interested in Forming a Cooperative? Take the Cooperative Challenge!

    There are many good reasons for starting a Cooperative, such as collaborative marketing, processing, distribution, or administration.  And there are many different goals for cooperatives to pursue, such as enhancing local food systems, increasing resources and funding, and even sharing philanthropic or community development goals. With all the potential cooperative purposes and goals, how does a group of individuals start the conversation about how they would like to form their cooperative?  

    One way is to start with a set of proposed by-laws formed by a similar cooperative and have this new group of individuals voice their desires on how they would edit them to fit their situation. This method is suitable, especially if coordinated with an experienced cooperative development professional (these people are typically located at land grant colleges and cooperative development centers in each state). 

    There is one potential drawback to the face-to-face development scenario, and that is ensuring that all members have voiced their concerns.  To this end, the South Carolina Center for Cooperative Development developed an online cooperative development tool called “The Cooperative Challenge.” A link to this survey is located here https://clemson.ca1.qualtrics.com/jfe/form/SV_aeCSaXEpEKJp3GS

    Participants can take this challenge to see how they will work together; the best part is that it is anonymous and involves a hypothetical cooperative, not their specific cooperative.  Producers can voice their concerns without being singled out.  To date, this tool has been used with three groups to help them discuss the more difficult cooperative development topics.  Some of the most controversial questions are:

    • Patronage dividends: how much will be distributed versus retained by the cooperative?
    • Capitalization: how much debt versus equity contributed by members?
    • How restrictive should the cooperative be with members selling outside the cooperative?
    • How does a new member join the cooperative, and how does a member leave the cooperative?
    • Should the cooperative accept products from non-members to fulfill contractual obligations?
    • What measures should be taken if a member does not follow the rules, such as selling outside the cooperative or not delivering acceptable produce?
    • How much should the cooperative pay a general manager, and what benefits are provided?

    The survey findings will be analyzed within the next year to see how different groups responded to the same questions. It will be interesting to note if there are differences in the concerns of conventional farmers versus niche-product farmers, new farmers versus established farmers, and those relating to different product types (i.e., organic produce). In the meantime, this survey tool is available for interested producer groups and cooperative extensions.  Also, if needed, a QR code is available so that this survey can be taken using a mobile phone.  


    Richards, Steven. “Interested in Forming a Cooperative? Take the Cooperative Challenge!” Southern Ag Today 3(22.5). June 2, 2023. Permalink

    Photo by RDNE Stock project: https://www.pexels.com/photo/variety-of-fruits-and-vegetables-8540920/