Blog

  • Global Market Prospects for U.S. Long-Grain Rice for the Upcoming Marketing Year

    Global Market Prospects for U.S. Long-Grain Rice for the Upcoming Marketing Year

    According to USDA 2023 Prospective Plantings report, the long-grain rice planted area is projected at 1.96 million acres, a 9% increase relative to 2022, but still slightly below the 5-year average (2.0 million acres). At trend yields of 7,299 pounds per acre, we could expect a 14.6 million hundredweight (cwt) or 11.4% increase in production relative to 2022.

    With the expected increase in production, the pressure will be on exports to perform well and help keep market prices stable. While the share of long-grain exports to total use has been decreasing steadily since 2015, exports still accounted for between 41% and 48% of total long-grain rice use during this period[1]. The short 2022 U.S. long-grain crop (on top of an already short 2021 crop) puts extra pressure on farm prices, which have reached record levels in 2022/23 (USDA estimates an average farm price of $16.90/cwt).

    So far, 8 months into the 2022/23 marketing year, export performance has been lagging with only 34.9 million cwt (rough basis) of long-grain rice exported, compared to an average 52.4 million cwt during the same period in the last 5 years. Paddy rice exports are down almost half relative to last year, mostly due to a sharp 71% decrease in exports to Mexico and a 38% decrease in exports to Central America (Figure 1), where Mercosur (primarily Brazil) has displaced the U.S. as the top supplier. Exports of milled rice are showing a good performance despite the lack of price competitiveness, which indicates the importance of other factors aside from price. For example, the U.S. negotiated 250 thousand metric tons of milled rice exports to Iraq, a market in which U.S. rice is clearly not price competitive.

    The expectation is that a larger 2023 U.S. crop and the smaller 2022 Brazilian crop (7.9% smaller than in 2021) could provide the incentives for the U.S. to reclaim at least part of the Mexican and Central American markets. However, other aspects related to (1) milling and culinary quality differences vis-à-vis Mercosur rice, and (2) the prospects of policy changes in Central America aimed at extending trade preferences to competing countries similar to those given to the U.S. under CAFTA-DR, may hinder the prospects for U.S. rice in these Latin American markets.

    Figure 1. Exports of U.S. long-grain rice to Mexico and Central America in the first eight months of the last seven marketing years (rice marketing year: August-July).


    [1] USDA includes imports of fragrant (jasmine and basmati) rice in the rice supply and use estimations, but they are removed in this analysis as fragrant rice is a different market segment than long-grain rice.


    Durand-Morat, Alvaro. “Global Market Prospects for U.S. Long-Grain Rice for the Upcoming Marketing Year.” Southern Ag Today 3(16.4). April 20, 2023. Permalink

  • Benchmarking

    Benchmarking

    Agricultural producers constantly seek opportunities to improve their businesses by implementing new technologies and practices. In this quest for growth and improvement, benchmarking is a crucial tool that progressive and business-minded farmers and ranchers use to measure their performance against similar businesses in the industry.

    Benchmarking allows producers to identify their strengths, weaknesses, and areas where they have room to grow and improve. It should cover all management aspects, production costs, production systems, marketing, finance, and human resources. By benchmarking against other producers within the same group or the industry, one can see the production or economic results that can be achieved and understand the limitations that may prevent them from attaining them. Further, producers should also be able to analyze trends and see the results of their decisions.

    Producers should use a similar way to calculate results to ensure effective benchmarking. As a renowned agricultural economist, Danny Klinefelter, stated, “One of the most significant issues is to make sure the data is comparable and that you’re comparing apples to apples.”

    One effective benchmarking system for beef cattle producers is the Beef-Cattle Standard Performance Analysis (SPA) used in Texas and some southern states since 1992. SPA developers used the Farm Financial Standards Guidelines created by a national task force to prepare farm or ranch financial statements as a framework for analyzing and benchmarking cow-calf enterprises. Similar systems could effectively be implemented to compare all types of ag production.

    Ag Peer Advisory Groups have a long history of benchmarking, given their group culture of discussing and learning from each other.  One such example is a group of ranchers from North Texas and Oklahoma that meet monthly to critique each other’s operations, share ideas, and benchmark production and economic performance.  The group is facilitated by leadership from Texas A&M AgriLife Extension and supported with funding from the Southern Risk Management Education Center.       

    While informal peer advising is common, the advantage of formal groups or associations is the development of production and financial management standards to ensure they compare the same information.  Developing and implementing effective benchmarking systems across all types of ag production will enable producers to continually improve their performance.  Check with your state’s Extension Economists to learn more about performance benchmarking opportunities. 


    Abello, Francisco Pancho. “Benchmarking.” Southern Ag Today 3(16.3). April 19, 2023. Permalink

  • Another Week, Another Record

    Another Week, Another Record

    There’s a lot going on in livestock markets but we can’t keep our eyes off the fed cattle market where prices soared again last week to another record high for the third week in a row.  Surging live fed cattle prices are pulling calf and feeder cattle prices along for the ride. The cutout value is beginning to increase but there are not a lot of effects yet on retail beef prices.  This week we’ll take a brief look at packer and retailer margins stemming from these changes in the live market.

    Prices and Margins

    Fed cattle prices got well into the $180s per cwt with $182-$183 in Iowa and Nebraska.  Kansas and Texas were about $175 per cwt.  The weekly 5-market weighted average was $180.44.  The Livestock Marketing Information Center estimated cattle feeding average returns were positive from September through March 2023.  The increase in fed cattle prices indicates that cattle feeding returns will continue to be positive in April.  

    The Choice cutout value averaged about $297 per cwt last week.  But, it increased throughout the week, and by Friday it was $302 per cwt and $305 on Monday morning.  The live-to-cutout price spread is often used to indicate packer margins.  As such, it should be taken with a big grain of salt because it does not include the packer’s costs.  It is simply the difference between the cost of the cattle and the value of wholesale beef plus the drop credit.  The live-to-cutout spread was $259 in March compared to $385 a year ago.  Recent price moves indicate a spread of about $237 in mid-April.  

    Similar to the live-to-cutout spread, we can calculate a cutout-to-retail price spread that reflects a retail (grocery store) beef margin.  It, too, has to be taken with a grain of salt because it does not include their costs which includes the cost of product that does not sell.  Retail beef prices have been relatively flat at about $7.60 per pound for more than a year.  The March retail Choice price was $7.64 per pound.  The cutout-to-retail spread was $1.47 in March compared to $1.65 in March 2022.  The 5-year average spread was $1.17 per pound.  It’s likely that this spread will tighten as the cutout increases. Keep in mind also that beef production is expected to decline by about five percent in 2023.  The market will likely test the consumer’s willingness and ability to pay more for beef in coming months.  


    Anderson, David. “Another Week, Another Record.” Southern Ag Today 3(16.2). April 18, 2023. Permalink

  • Competing Influences and Expectations for World Cotton Demand

    Competing Influences and Expectations for World Cotton Demand

    The USDA February 2023 Cotton Outlook projects world cotton consumption bottoming at 110.7 million bales for the current 2022/23 marketing year.  They then forecast 2023/24 consumption recovering to 115.5 million bales due to: 1) post-Covid reopening in China with increasing GDP, 2) lower Chinese production and greater need for Chinese imports, and 3) an “unusual inventory dynamic” of pent-up cotton demand following previously Covid-disrupted deliveries of cotton textile goods.  Other bullish influences for cotton consumption include the competitively low prices of raw cotton, which appear to have translated to higher levels of U.S. cotton exports since January.

    Beyond China, world GDP is also currently forecasted by the International Monetary Fund to rise slightly to 2.9% (Figure 1, dashed green line).  This is important to the cotton market because cotton consumption tends to rise with economic growth and fall with economic declines.  For example, the blue line in Figure 1 shows world cotton consumption ranging between about six and eight pounds per person per year.  The peaks and valleys of per capita cotton consumption coincide with the respective trends of world GDP.  This is not surprising since cotton-made apparel and home furnishing products are both semi-durable and somewhat discretionary.  

    Growing expectations of stronger economies, increasing mill use, and stronger export demand are, in turn, bullish influences on ICE cotton futures.  In the near term, they could contribute to stronger old-crop prices, especially if the current hedge fund net short position is liquidated in a short covering rally.

    There are, of course, counter influences. First, a bullish demand response would be somewhat self-correcting as mills generally buy less cotton at higher prices. It remains to be seen how long and how high the “unusual inventory dynamic” will push cotton prices.  In addition, there is a potential macro-economic risk shrinking the demand curve and putting downward pressure on prices.  The latter could result from strong recessionary influences due to high interest rates as central banks continue their attempt to lower inflation to target levels.  

    Figure 1. World Per Capita Cotton Use and Global Economic Growth

    World Economic, Outlook, October 2022 http://www.imf.org http://www.imf.org/external/datamapper/NGDP_RPCH@WEO/OEMDC/ADVEC/WEOWORLD

    Robinson, John. “Competing Influences and Expectations for World Cotton Demand.Southern Ag Today 3(16.1). April 17, 2023. Permalink

    Photo by Pixabay: https://www.pexels.com/photo/full-frame-shot-of-cracked-pattern-255509/

  • How Much Can I Sell This For? Part I

    How Much Can I Sell This For? Part I

    How much can I sell this for? This is a question producers often ask us. It is an important question and one that is not always easy to answer. Usually there are many factors to consider in pricing your farm products. In Part I of our series on product pricing, we discuss factors that may affect what you want to reflect in your product’s price.

    • Cost – It can be a challenge to hone in on this number, but it is important to know how much has been invested. The first step is capturing ALL costs associated with carrying on a farming activity. Over time these can be broken down by categories and segmented into individual crops/enterprises. Capturing product cost(s) is done through a chart of accounts and the books and records of the business. Oftentimes at the beginning of the season you may not know exactly how much you will spend. Enterprise/crop budgets are farm management tools that can help fill in the gaps. 
    • Price Comparison – Referencing other markets can tell you what comparable products are selling in area markets. Comparable product prices is helpful information to know, but it is not advised to simply match your price to what you see elsewhere. It is better to develop a range for what is acceptable. If you determined that you are profitable at $5.00 per lb. (based on your costs) but you see that a grocery store is selling for $7.00 per lb., that may help you understand what customers are willing to pay. Other places to reference would be farmers markets, grocery stores, USDA reports, market bulletins, and other places where similar products are sold.
    • Customers – Evaluating your customer segment is important because you may know what your price needs to be, but you have to find buyers that will support that. That means your customers must be willing and able to pay the set price for your product. Some questions to ask:
      • Do the customers have the means and willingness to pay? If you have premium products, who will be willing to pay for that and where are they located?
      • Is your market local or will you have to travel to reach them? If there are additional costs associated with that market, consider the additional revenue you will need to make it worth it.
      • What’s the capacity of the market? If you and several others are growing similar items but there are a small number of customers, it may be hard to make enough sales to cover your cost. Some markets may even put restrictions on what you can bring to discourage duplicate offerings. At that point, it is not a price problem but having enough buyers available. 

    Price for products can be quite variable and experience large variations throughout a season. Farmers can influence the price their customers are willing to pay through successful marketing and branding efforts.  However, other factors such as perishability may add additional market pressure. Knowing your cost, a range of acceptable prices, and opportunities to reach buyers can help net an acceptable return for your crop. 

    Part II of this series on product pricing will include an example on calculating price for a Southeastern-grown fresh fruit or vegetable. The related article is planned for release in an upcoming Southern Ag Today article.


    Burkett, Kevin. “How Much Can I Sell This For? Part I.Southern Ag Today 3(15.5). April 14, 2023. Permalink

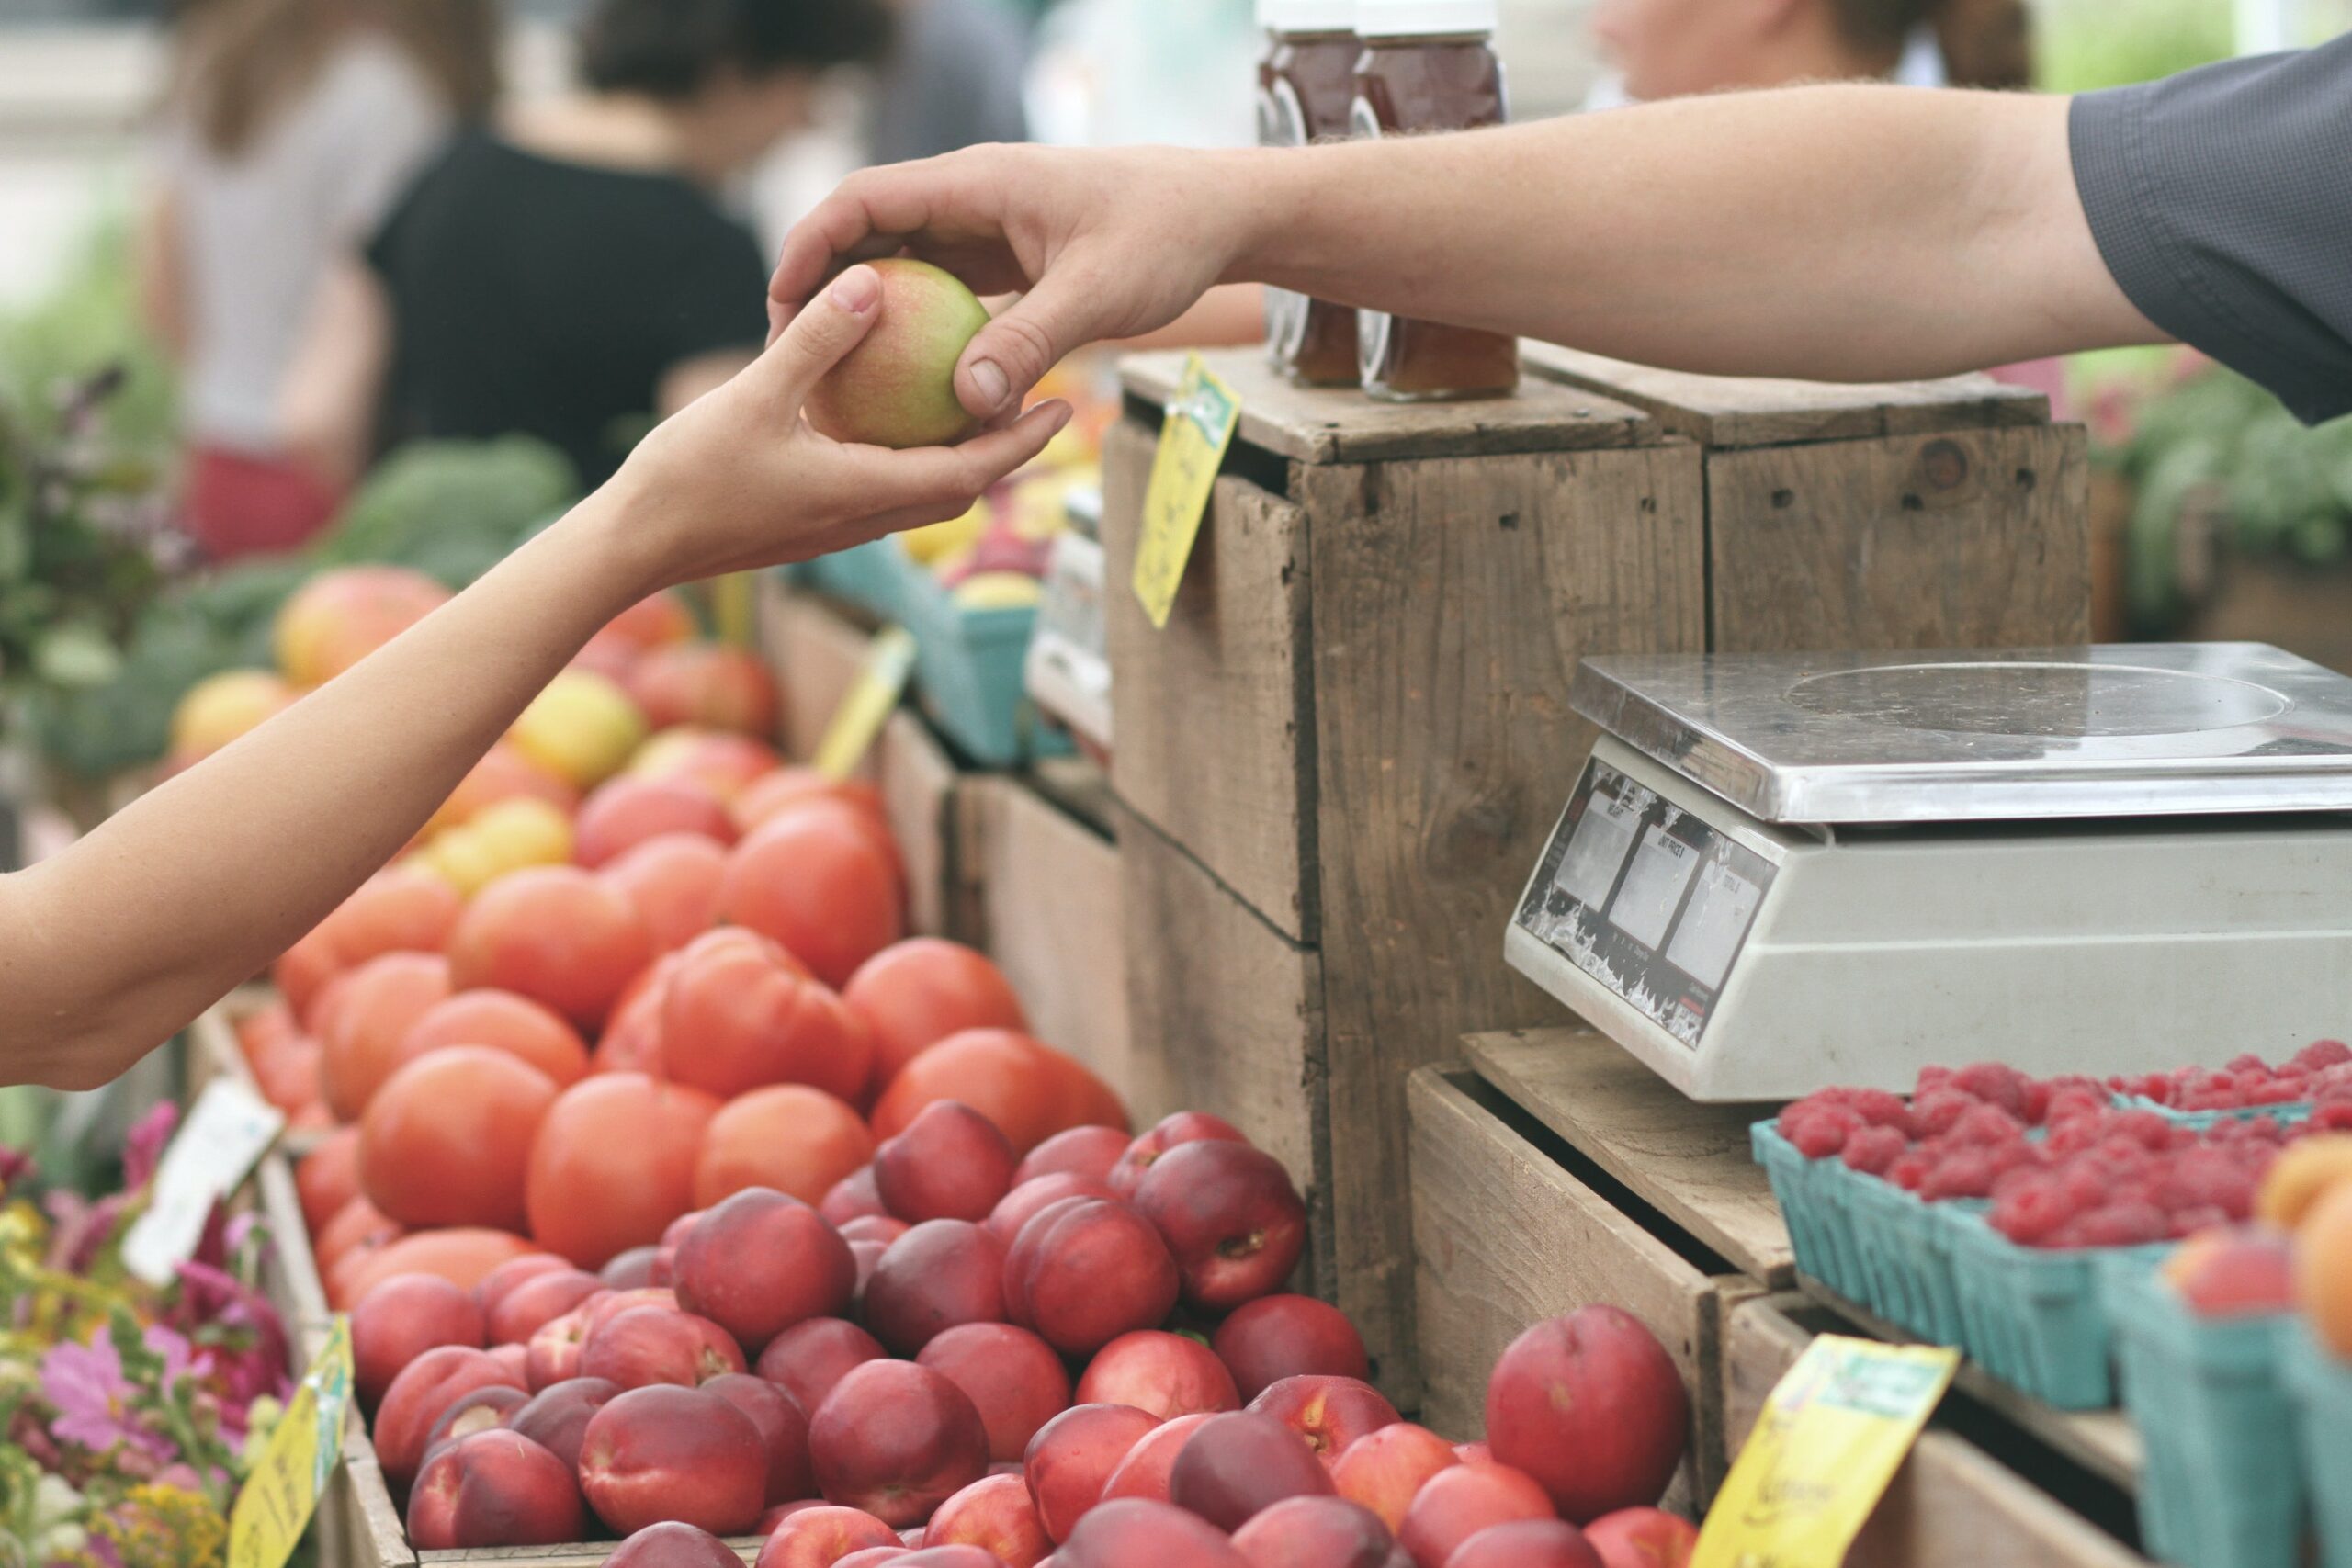
    Photo by Erik Scheel: https://www.pexels.com/photo/person-giving-fruit-to-another-95425/