Blog

  • Down the River: How the 2022 Mississippi River Drought Damaged Southern U.S. Agricultural Trade

    Down the River: How the 2022 Mississippi River Drought Damaged Southern U.S. Agricultural Trade

    In 2022, the Mississippi River experienced a severe drought that disrupted barge transportation from the Midwest to ports on the Gulf of Mexico. Our research found that the drought led to a 3.9% reduction in agricultural exports from Louisiana ports, resulting in agricultural trade losses of $563.9 million between July 2022 and January 2023. Wheat exports were the most affected, with a considerable decrease in export volume of 350 million kilograms at Louisiana ports. However, there was limited evidence of adverse trade effects for soybeans and corn.

    While we found some evidence of negative effects on agricultural commodities at the beginning of the Mississippi River drought in 2022, there was a strong trade recovery when transportation disruptions ended. As a result, there was limited diversion for affected commodities except for wheat, which was diverted to East and West coast ports.

    Figure 1 shows that non-Louisiana Gulf ports experienced more pronounced trade disruptions (‑15.1%) than Louisiana ports (-3.9%), despite Louisiana ports accounting for over 86% of agricultural exports shipped through Gulf ports. Our study also found evidence of considerable trade diversion, with positive trade effects for East coast (5.8%) and West coast ports (7.1%). These estimates imply that some agricultural suppliers opted for alternative transportation modes to facilitate foreign shipments via ports on the East and West coasts.

    Our research highlights the urgent need to mitigate the impact of natural disasters and supply chain disruptions on barge-dependent agricultural exports, especially on the Mississippi River. While various federal and state agencies offer direct relief and recovery support for drought impacts, a more comprehensive plan may be necessary to address this potential long-term issue. The lack of tools to deal with similar supply chain disruptions can limit the production capacity of agricultural farmers and their access to foreign markets.

    While the Bipartisan Infrastructure Law has authorized up to $108 billion to support federal public transportation programs, including barge transportation on the Mississippi River, it may take time for these solutions to take effect, and the federal funding allocation for barge shipping remains unclear. It is crucial to enhance the availability and efficiency of alternative transportation options. Our study underscores the importance of adopting proactive measures to mitigate the impacts of climate-induced trade disruptions on U.S. agriculture.

    Figure 1: Agricultural Trade Effects of the 2022 Mississippi River Drought.

    Note. The figure shows the average post-event trade effects of the 2022 Mississippi River Drought for export volume and unit value by U.S. port region. All regressions include port-destination-good-event-year and port-destination-good-event-month fixed effects. The “Louisiana” label denotes ports within the state of Louisiana, while “Gulf” encompasses Gulf ports, excluding those in Louisiana. The “East” category includes ports in the South Atlantic and New England customs divisions, and the “West” category includes those ports from the Pacific customs divisions.

    *This work was supported by the National Institute of Food and Agriculture through the Agriculture and Food Research Initiative Award 2019-67023-29343. This paper does not necessarily reflect the views of USDA. Full paper is available here: https://tinyurl.com/yn76tw3w.


    Steinbach, Sabdro, and Xiting Zhuang. “Down the River: How the 2022 Mississippi River Drought Damaged.Southern Ag Today 3(18.4). May 4, 2023. Permalink

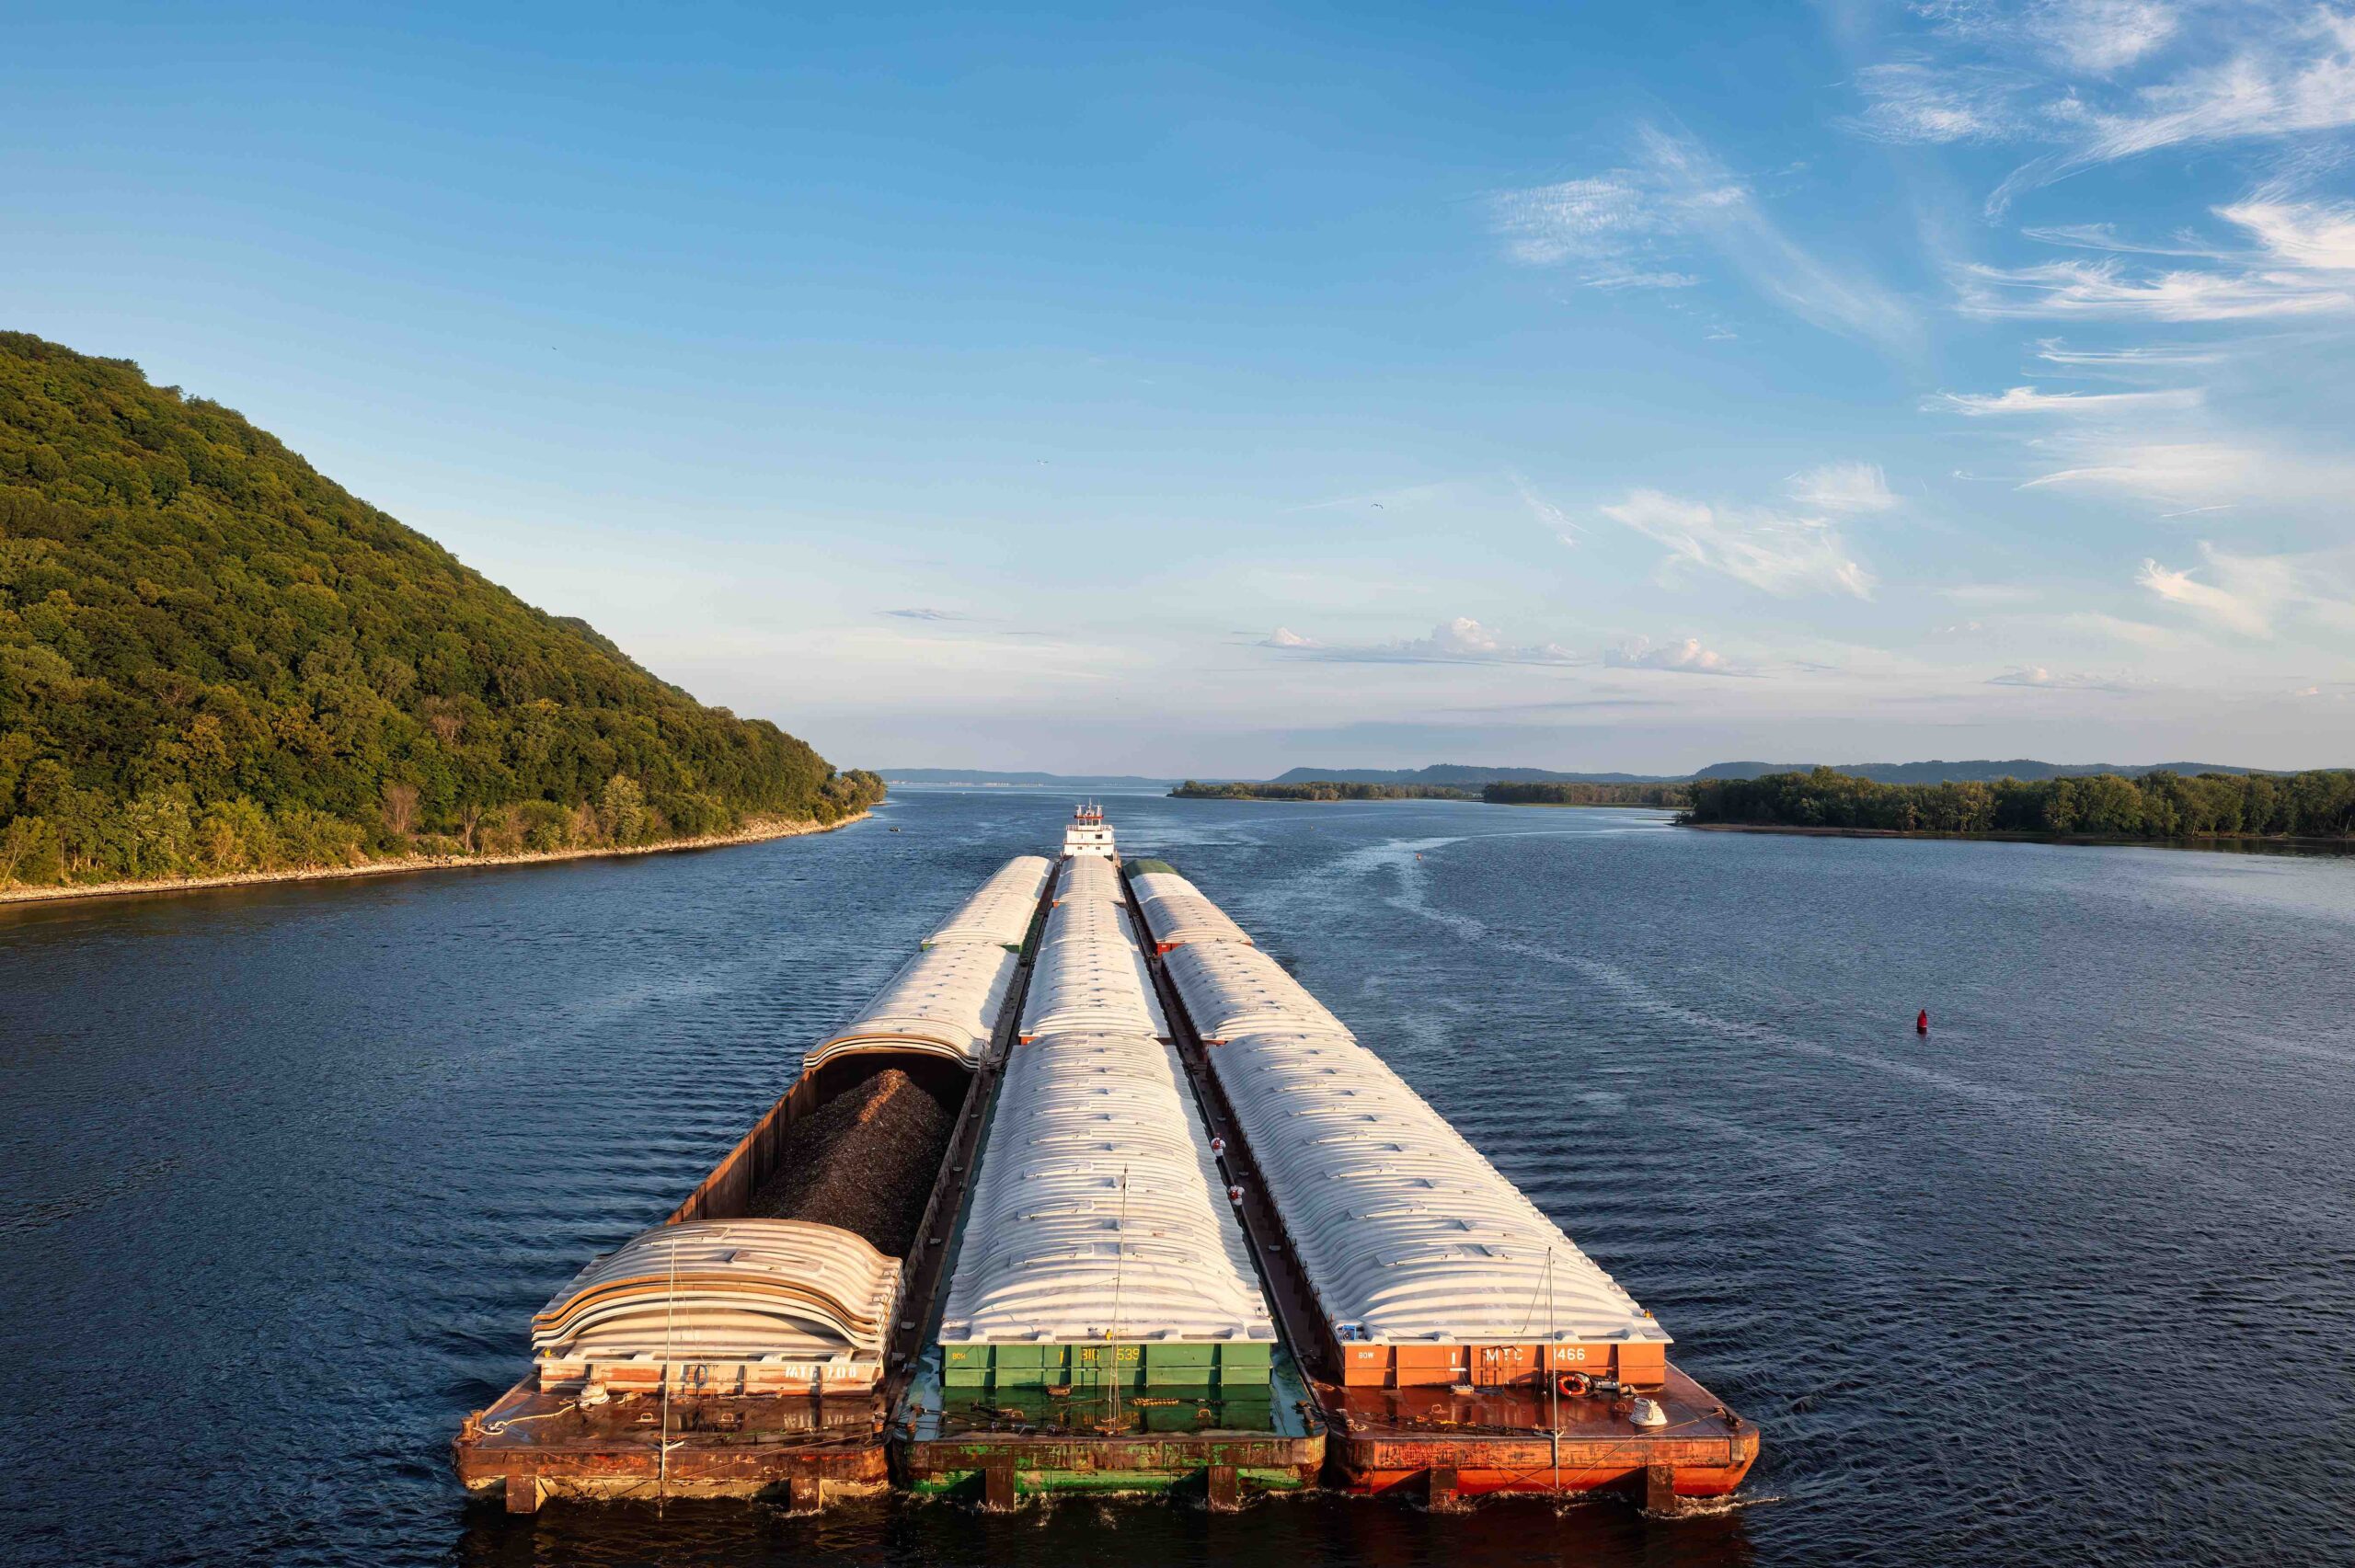
    Photo by Tom Fisk: https://www.pexels.com/photo/barge-on-the-mississippi-river-13649457/

  • Mobile Apps in Farm Management

    Mobile Apps in Farm Management

    Have you ever found yourself wishing there was an app for something while using your smartphone? You’re not the only one. The development of mobile apps for various needs is happening at a rapid pace. Why? According to comScore, 89% of all mobile minutes are spent on mobile apps. The top two categories for mobile app users are social media and news/information. In agriculture, there are mobile apps available that deal with an array of topics. CropLife puts out a list of the best agriculture apps every year. The majority of those mobile apps, and the most popular, are often agronomic or weather related. In the economic space, most of the available apps provide pricing information for marketing.  However, there are a host of available apps that can assist with farm management.

    I often get asked, “What is the best farm management app out there?” My colleague had the best answer to that question, “the best farm management app for farmers is the one that you will actually use!” Each app serves a different purpose and provides a different user experience.  We’ve recently created an extension publication that outlines all of the mobile apps we could find that help farm management and their availability on Apple or Google smartphones (publication found here). If you want a more detailed description of each app, you can find it here. I encourage you to download several apps and try them to see which works best for your specific situation or need.

  • April Cattle on Feed – What to Make of March Placements

    April Cattle on Feed – What to Make of March Placements

    USDA released the April Cattle on Feed report on Friday, April 21st. This monthly publication estimates the number of cattle on feed at feedlots with a capacity of over 1,000 head and serves as a measure of likely beef production over the next several months. While the cow herd has been decreasing in size for several years, an increase in the number of heifers in the beef system kept on-feed numbers running relatively high for much of 2022. Finally in the fall, the long-expected shift occurred, and on-feed numbers have been running below year-ago levels since then.

    In Friday’s report, April 1, 2023, on-feed inventory was estimated to be down about 4.5% from April 1, 2022. While this might not immediately raise any eyebrows from casual observers, this on feed number was higher than expected and really came down to March placements being greater than most pre-report estimates. The net effect was that total on-feed inventory was virtually unchanged from March 1 to April 1, which was counter to what many expected. 

    Heifers continue to make up a historically large proportion of cattle on feed.  Fewer heifers were reported on feed than on April 1, 2022.  While steers on feed declined by 6 percent, heifers on feed were only down about 1.7 percent from last year.  That indicates that there has not been a large movement in holding back heifers yet. 

    There are some possible explanations for the larger-than-expected March placements number. First, March is a month when cattle are often moved off wheat pasture and continued dry weather combined with high wheat prices, likely impacted movement of feeders. Secondly, live cattle imports from Mexico were higher in March. So far this year, feeder cattle imports from Mexico are up about 95,000 head from last year.  But it’s worth remembering that feeder cattle imports in 2022 were the fewest since 2008.  Finally, there is still a lot of carry on the feeder cattle board, meaning that feedlots have been aggressively buying feeders ahead, in anticipation of the rising price levels suggested by deferred live cattle futures. Put simply, I absolutely think that feedlot placements bears watching in the coming months, but I suspect the larger placement number last month has more to do with timing than a major shift in market fundamentals. 

  • Urea, Natural Gas, and Corn Price Correlations

    Urea, Natural Gas, and Corn Price Correlations

    Fertilizer prices have come down from the peak in April 2022 (Figure 1), however fertilizer prices remain elevated compared to 2017 through 2020. In 2021 and 2022, high fertilizer prices coincided with high corn prices, resulting in positive profit margins for many producers, especially those that were not affected by adverse weather. Since August 2022, Henry Hub Natural Gas Prices have declined sharply. Natural gas is a key input in the production of nitrogen fertilizer accounting for 70-90% of variable production costs (Outlaw et al. 2022). Two important questions for many producers are how related are these prices and how does this relationship potentially impact profitability in 2023? To examine this, we look at the historical relationship between corn, urea, and natural gas prices.

    Figure 1. Weekly Urea, Natural Gas, and Nearby Corn Futures Price, January 2, 2017, to March 27, 2023

    Nitrogen, natural gas, and corn prices are positively correlated (correlation describes the strength of an association between two variables, positive correlation indicates that prices move in the same direction, negative correlation indicates prices move in opposite directions; correlation coefficients have values between -1 and 1). Examining weekly price data from January 2017 to March 2023, natural gas and urea prices were positively correlated (0.738), natural gas and corn prices were positively correlated (0.668), and urea and nearby corn futures prices were positively correlated (0.906).  All three variables are strongly positively correlated. However, there are event-based anomalies in the data that create temporary deviations in the relationship between prices. For example, natural gas prices briefly spiked in February 2021 during a winter storm that strained natural gas and electricity markets in Texas and Oklahoma (USEIA, 2022). It is also important to note that correlation does not indicate causation. In other words, a higher natural gas or urea price does not necessarily cause higher corn prices, and vice versa.  However, the takeaway from this figure and correlations for natural gas, corn, and urea prices are they tend to move in the same direction. 

    Over the past year, natural gas and urea prices have decreased substantially from recent highs. Urea prices have fallen from $1,031/ton to $626/ton (down 39%) and natural gas prices have fallen $9.56 to $2.01 (down 79%). Nearby corn prices have decreased from $8.13 ½ to $6.60 ½ (down 19%). Based on the realized decline in natural gas prices, the downward trend in urea prices, and the historical correlations above, further weakness in corn futures prices may occur in 2023. There are many factors that will influence corn (and other commodity) prices, such as weather and geopolitical uncertainty, however decreased prices for natural gas and urea provides some indication that weaker corn prices may occur in the not-too-distant future. 

    From a profitability standpoint for the 2023 crop year, many producers locked in fertilizer prices last fall or early in 2023. In general, those that priced earlier will have higher fertilizer costs than those that priced later. Producers that have locked in fertilizer prices for the 2023 crop may want to consider locking in futures prices for a portion of their crop to avoid a margin squeeze should corn prices decline.

    References:

    Barchart.com. Nearby Corn Historical Weekly Closing Prices. Accessed at: https://www.barchart.com/futures/quotes/ZCK23/historical-download

    Outlaw, J.L., B.L. Fischer, H.L. Bryant, and J.M. Roulston. 2022. “Economic Impact of Nitrogen Prices

    on U.S. Corn Producers”.https://fj-corp-pub.s3.us-east-2.amazonaws.com/inline-files/Economic%20Impact%20of%20Nitrogen%20Markets%20on%20U%20HB-1.pdf

    U.S. Energy Information Administration. 2023. Natural Gas. Data. Henry Hub Natural Gas Prices. Accessed online at: https://www.eia.gov/dnav/ng/hist/rngwhhdW.htm

    U.S. Energy Information Administration. 2022. TODAY IN ENERGY. Accessed online at: https://www.eia.gov/todayinenergy/detail.php?id=50778


    Smith, Aaron, and Christopher Boyer. “Urea, Natural Gas, and Corn Price Correlations.Southern Ag Today 3(18.1). May 1, 2023. Permalink

  • Responding to Climate Change in Rural Communities

    Responding to Climate Change in Rural Communities

    Extreme weather events seem to dominate the news. According to the National Oceanic and Atmospheric Association, the number and cost of climate related disasters in the United States is on the increase. While some events can be devastating, other events such as droughts, snow events, heat events, rising sea levels, or wildfire can also disrupt communities. The ability to anticipate and respond to climate related events defines the capacity of a community to be climate resilient. 

    Designing community resiliency plans is the work of every community. Because environmental, geographic, and demographic variables are unique to every community, every community will need to create their own working strategy.  The National Oceanic and Atmospheric Association (NOAA) offers communities a useful five step resilience planning process, US Climate Resilience Tool Kit (https://toolkit.climate.gov/): 1) understand exposure, 2) Assess vulnerability and risks 3) Investigate Options, 4) Prioritize and Plan, and 5) Take action.   

    Following these planning steps can help community leaders assess risk factors and shape action response plans for their community. Helpful information and resources to assist communities in their planning include:

    Want to see examples of how other communities are preparing? The following resources provide community-based examples:

    Communities become more climate resilient when they work together to improve their readiness and response to climate disruptions. Start the conversation in your community today!


    Kahl, Daniel. “Responding to Climate Change in Rural Communities.” Southern Ag Today 3(17.5). April 28, 2023. Permalink