Blog

  • U.S. Beef Exports Down in 2023 (so far) – U.S. Beef is Losing Ground in China

    U.S. Beef Exports Down in 2023 (so far) – U.S. Beef is Losing Ground in China

    Despite record beef exports in 2022 ($11.7 billion), there are signs of weakening beef trade for the U.S. in 2023. Note that total U.S. beef and beef product exports year-to-date (January-March) in 2023 were down in terms of value by 22% when compared to the same period in 2022, and down 8% in terms of volume. This overall decline was primarily driven by declines in sales to Asian markets, most notably the leading destinations for U.S. beef exports: Japan, South Korea, and China. In terms of value (volume), U.S. beef exports to Japan were down 20% (4%), South Korea 36% (15%), and China 21% (15%) (USDA, 2023). A noted reason for these declines is the relatively strong U.S. dollar, which has made beef exports relatively more expensive, and recent and anticipated declines in U.S. beef production.

    In previous SAT articles, I highlighted the rise of China as a major buyer of U.S. beef and a major beef importing country overall. As mentioned in these articles, China emerged from relative obscurity and is now the third leading market for U.S. beef behind Japan and South Korea. In 2022, China imported $2.2 billion dollars of U.S. beef and beef products, with sales comparable to well established foreign markets: South Korea ($2.7 billion in 2022) and Japan ($2.3 billion in 2022). Unfortunately, the trade data for 2023 indicate that U.S. beef may be losing ground in the Chinese market. Figure 1 shows China’s beef imports from the U.S., as well as from all countries in 2022 and 2023 (January – March). Even as U.S. beef exports to China declined in the first quarter of 2023 from $382 million to $344 million (or 40 thousand to 38 thousand metric tons), China’s beef imports overall increased by more than $100 million and nearly 103 thousand metric tons. According to Trade Data Monitor® (2023), China imported 125% more beef from Brazil during this period (124 thousand metric tons in the first quarter of 2022 versus 280 thousand metric tons in 2023). Foreign demand for U.S. beef demand will remain a significant concern going forward as declining beef production could put even more pressure on U.S. beef prices. It appears that this is having and will continue to have a negative impact on U.S. beef exports overall and in China in particular.

    Figure 1. China’s beef and beef product imports in 2022 and 2023: YTD (January – March)

    Note: TMT is Thousand Metric Tons. Beef and beef products are defined according to the U.S. Department of Agriculture BICO category, which mostly comprised of beef cuts and to a lesser degree beef offal.
    Source: Trade Data Monitor®

    References

    USDA (2023). Global Agricultural Trade Systemhttps://apps.fas.usda.gov/gats/default.aspx

    Trade Data Monitor® (2023). https://www.tradedatamonitor.com/


    Muhammad, Andrew. “U.S. Beef Exports Down in 2023 (so far) – U.S. Beef is Losing Ground in China.Southern Ag Today 3(20.4). May 18, 2023. Permalink

  • Foreign Investment in Agricultural Land

    Foreign Investment in Agricultural Land

    Foreign land ownership has recently become a hot topic for politicians and the news media in the United States. Reasons given for interest in this topic include rising land values, added barriers for beginning farmers, and concerns about food security and national security due to non-U.S. ownership of agricultural assets. There is currently no federal law that prohibits the ownership of private agricultural land by foreign persons or entities. The federal government’s only involvement is the monitoring of land acquisitions and recording of information on those purchases through the passage of the Agricultural Foreign Investment Disclosure Act of 1978 (AFIDA).  Under AFIDA, qualifying foreign entities who buy or sell an interest in agricultural land are required to report the transaction within 90 days of the date of transition. Failure to comply with the AFIDA results in a civil penalty of up to 25% of the fair market value of the interest held in the land (USDA-FSA 2021). 

    Under AFIDA, the term agricultural land includes cropland, pasture, and timber. Foreign holdings of U.S. agricultural land increased by 2.4 million acres in 2020 (USDA-FSA 2021). However, these holdings represent a relatively small proportion of the overall base of farm and timber land in the United States. The total amount of U.S. cropland, pasture, and forest land under foreign ownership in 2020 was 37.6 million acres, which represents about 2.9% of all agricultural land. It is also important to note that more than half of US farmland held by foreign countries are long-term leases, often by energy companies, as opposed to outright ownership.

    The largest purchaser of U.S. agricultural land is Canada, representing 32% of land owned by all foreign buyers, or 12.4 million acres held. The next four countries holding U.S. agricultural collectively purchased 12 million acres or 31% of foreign-owned land. Those countries are the Netherlands (13%), Italy (7%), the United Kingdom (6%), and Germany (5%). In contrast, China owned 352,140 acres as of the end of 2020, which is less than 1% of foreign-held acres in the United States. As shown in Figure 1, China ranks 18th overall in U.S. land holdings among foreign countries and ranks 11th if we focus on U.S. farmland acquired between 2010 and 2020.

    The USDA does not have the authority to intervene in private land deals, but individual states can and have passed legislation that affects who can buy agricultural land and how much they can own. In the past two years, many states have proposed legislation limiting foreign ownership of farmland and sometimes all real property. Those bills have varied in detail affecting scope of limitations, countries affected, and differentiating between individuals and corporations. Similarly, at the federal level there were several proposed measures introduced seeking to control, prohibit, restrict, or increase oversight on foreign investments in the U.S. agricultural sector.  As this issue continues to evolve in legislative spheres, it is important to stay abreast of the details of proposed state and federal legislation.

    Figure 1. Top 25 Foreign Countries by U.S. Farmland Ownership in 2020

    Reference:

    Foreign Holdings of U.S. Agricultural Land through December 31, 2020, by the Farm Service Agency and the Farm Production and Conservation Business Center, U.S. Department of Agriculture. Available at http://www.fsa.usda.gov/programs-and-services/economic-and-policy-analysis/afida/index


    Taylor, Mykel. “Foreign Investment in Agricultural Land.Southern Ag Today 3(20.3). May 17, 2023. Permalink

  • Brisket Prices on the Rise

    Brisket Prices on the Rise

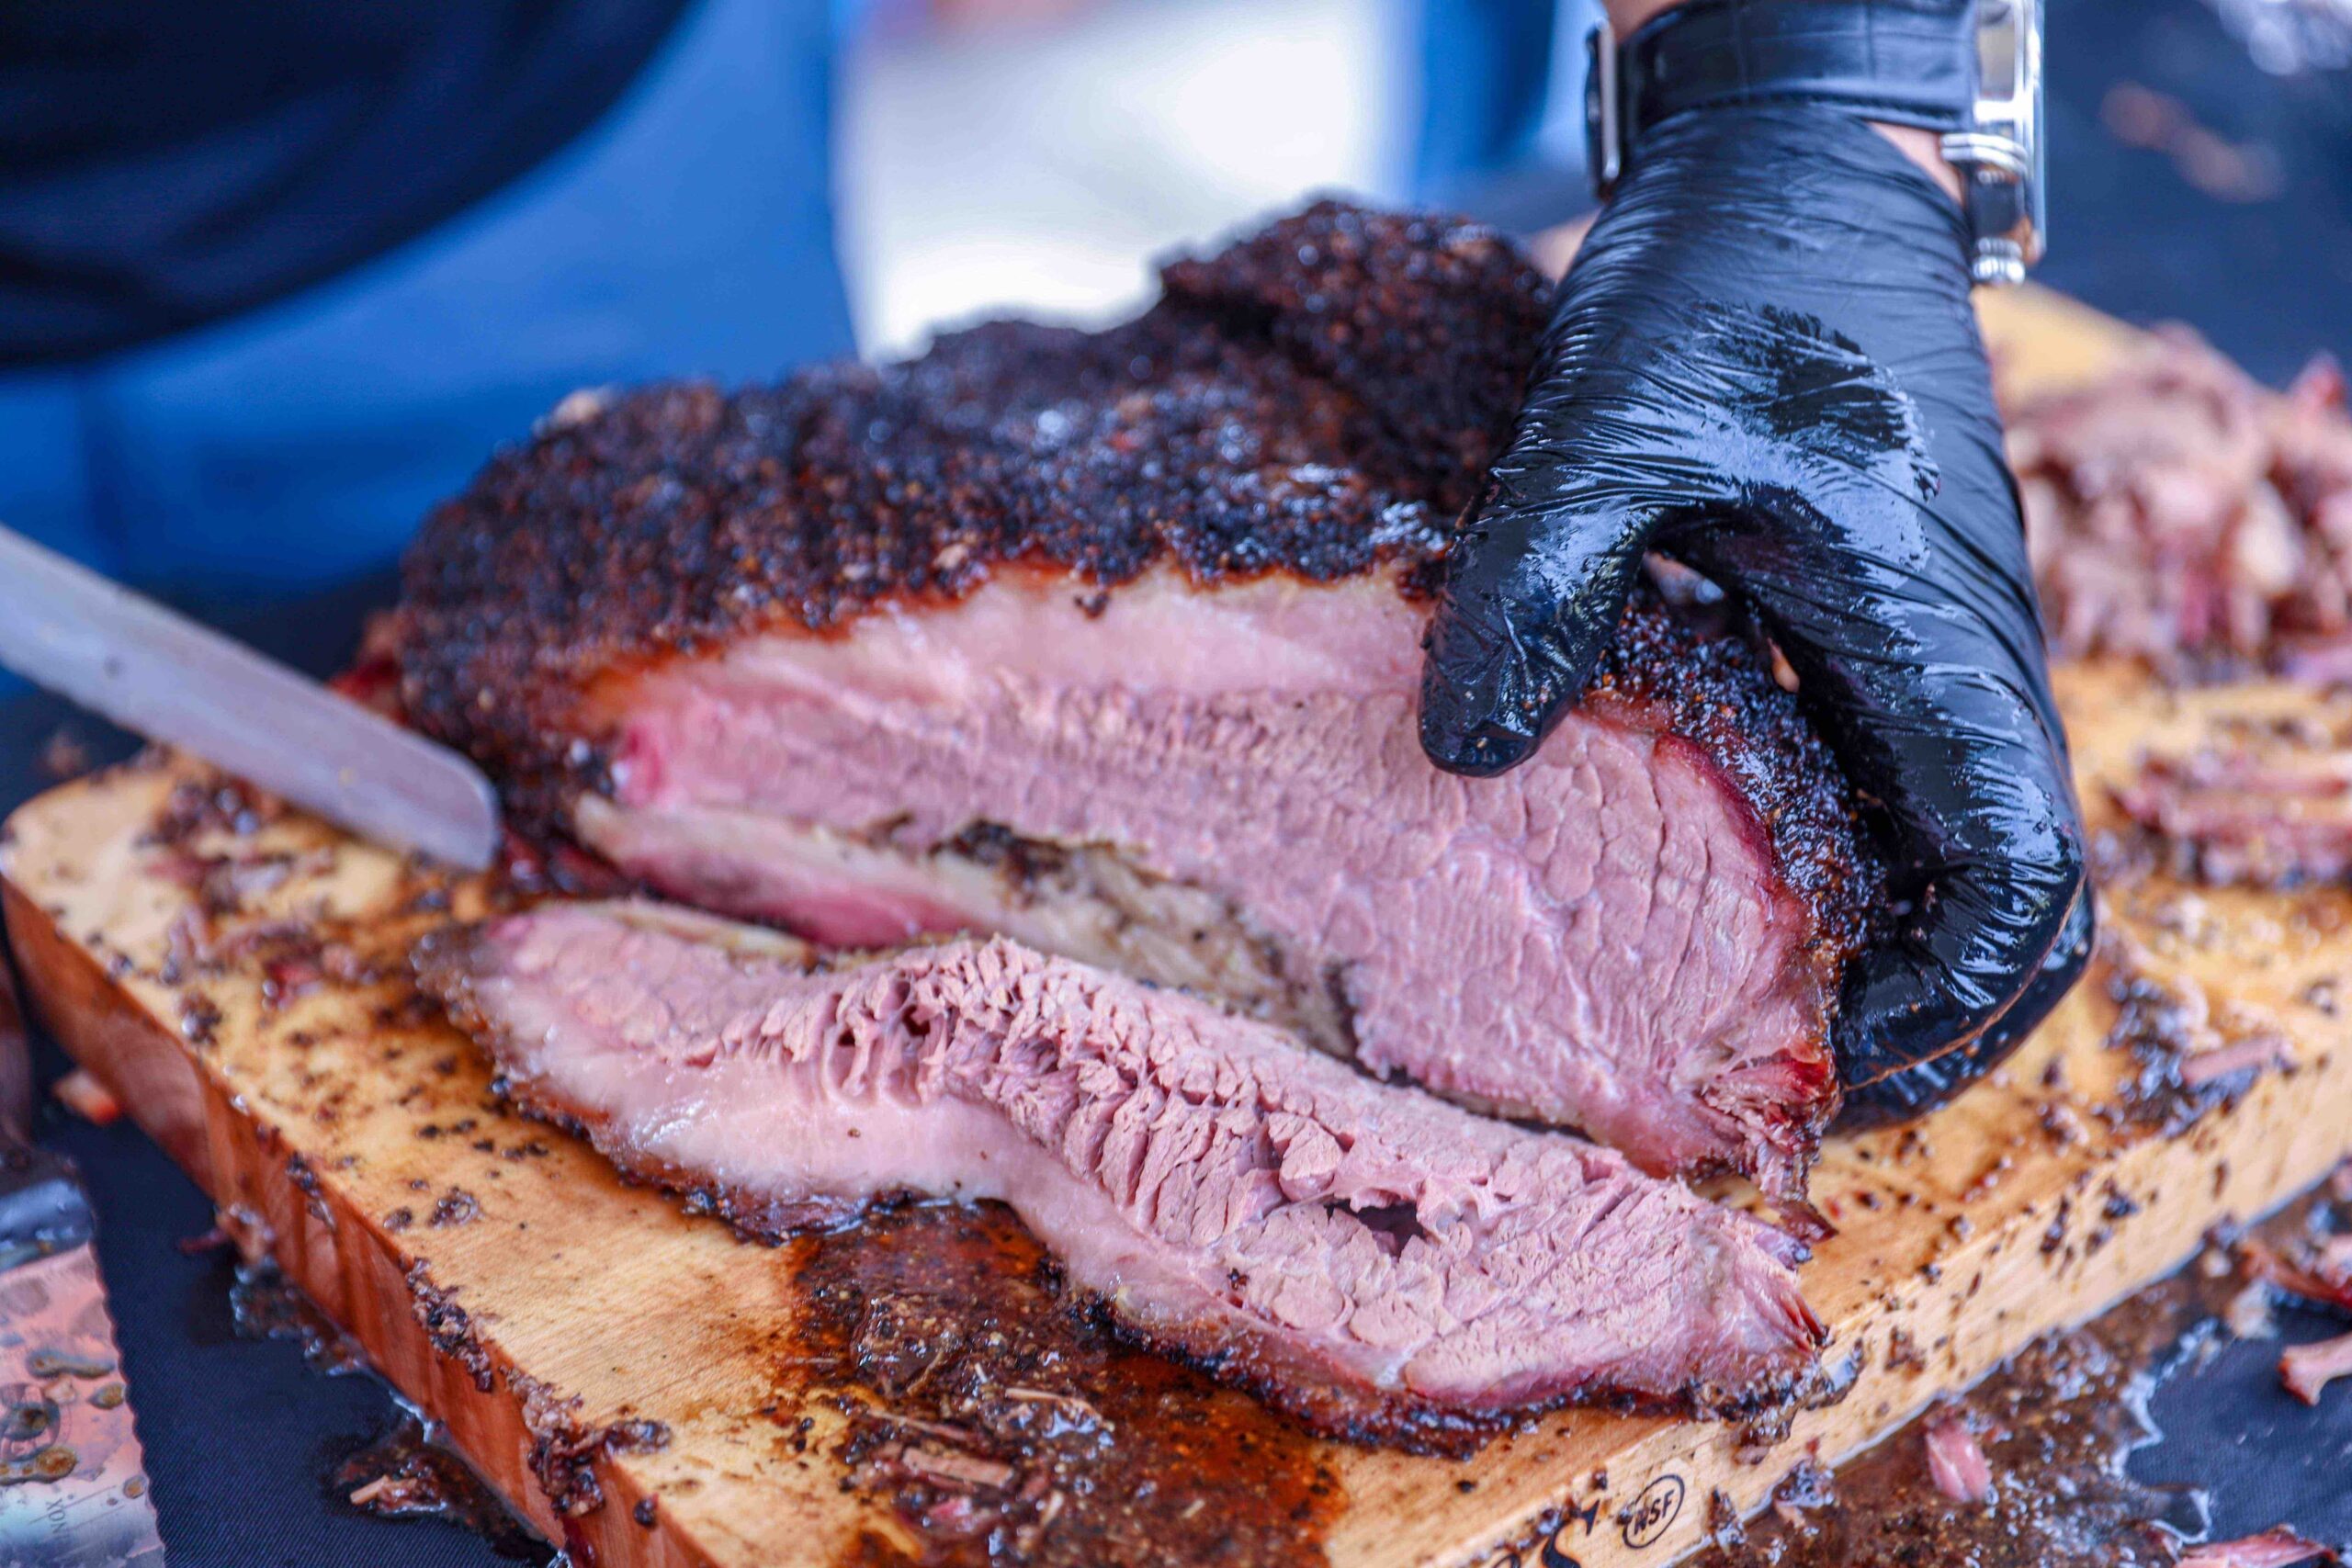
    As cattle prices and the boxed beef cutout have increased, so have briskets.  Higher brisket prices are starting to hit restaurants and home BBQ’ers.  Fewer cattle going to market and tighter beef supplies will pressure beef prices for all cuts, briskets included. 

    For the year, through the week ending May 13th, beef production is down 4.7 percent compared to last year.  Steer slaughter is 4.7 percent below last year and heifer slaughter is 0.3 percent more than last year.  The number of cattle going to market is important for briskets because each animal has two and briskets are a cut that is often sold as the whole primal.  In addition, steer and heifer dressed weights are below a year ago, so total pounds of brisket available is further reduced. 

    Prime grade briskets were $2.43 per pound for the week of May 12th.  Even though price has come down 6 cents over the last 3 weeks it is 16 percent higher than the first of the year and 11 percent higher than a year ago.  Choice, branded, and Select quality grade brisket prices are up similar percentages to Prime since January and compared to a year ago.  

    Typically, branded briskets (briskets like certified angus beef or other brands) have the highest price meaning that other quality grades, including Prime, trade at a discount in the wholesale market.  Since February, Prime briskets have commanded the highest price in the market.  That price strength is likely related to slightly fewer cattle grading Prime and more Choice than a year ago.  Many smaller, high end BBQ restaurants source Prime and branded briskets due to their cooked qualities.

    What might we expect in our favorite brisket BBQ spots in coming months?  Tight beef supplies and reduced slaughter will keep the pressure on for higher prices.  Restaurants will face higher costs and their ability to pass those on in the form of higher prices might be limited.  Even though less beef is produced leading to higher prices, fears of a recession, reduced consumer incomes, and spending may limit the ability to pass on higher costs. 


    Anderson, David. “Brisket Prices on the Rise.” Southern Ag Today 3(20.2). May 16, 2023. Permalink

    Photo by Hayden Walker: https://www.pexels.com/photo/a-person-slicing-barbecue-beef-brisket-9397270/

  • Higher Supplies and Lower Prices Projected for U.S. Crops in 2023

    Higher Supplies and Lower Prices Projected for U.S. Crops in 2023

    On May 12th, USDA released the latest World Agricultural Supply and Demand Estimates (WASDE) report. The May WASDE is significant as it provides USDA’s first official projections for the 2023 marketing year. The report provides annual forecasts for the supply and use of various crops based on marketing years, which start August 1 for cotton and rice and September 1 for corn and soybeans. It should also be noted that projections for production are based on the acreage reported in the March 31st USDA Prospective Plantings report and yield forecasts based on trend models or historical yields depending on the crop. Thus, the projections in Table 1 and discussed below will change as the growing season and marketing year advance. 

    U.S. corn production is projected at 15,265 million bushels, based on 84.1 million harvested acres and a national average yield per harvested acre of 181.5 bushels. If realized, this would be a record yield and level of corn production. Combined with carryover stocks from last year, the total U.S. corn supply is projected to be 10% higher than in 2022. This supply increase is offset by a 5% increase in total use. Feed use is projected to increase by 375 million bushels, and ethanol to increase by 50 million bushels. Exports are projected to be up 18%, at 2,100 million bushels. Corn ending stocks are projected at 2,222 million bushels, a 57% increase from 2022. The average farm price is projected at $4.80 per bushel. 

    Like corn, U.S. soybeans are projected to see higher supplies and lower prices in 2023. U.S. soybean production is projected to be 4,510 million bushels, a 5% increase from 2022. Most of the production increase is due to a higher expected yield of 52 bushels per harvested acre – also a record if realized. On the demand side, domestic crushings are projected to increase by 90 million bushels from 2022, but exports are projected to decrease by 40 million bushels. With supplies outpacing demand, ending stocks are projected at 335 million bushels, a 56% increase. 

    U.S. cotton is projected to plant less acreage in 2023 but will see higher production than in 2022. The 2022 cotton crop saw a record level of abandonment, with 13.76 million acres planted but only 7.31 million acres harvested, mainly due to dry conditions in Texas. Currently, USDA projects 11.26 million acres planted with 8.71 million acres harvested. It will be important to keep an eye on acres abandoned as the year advances, with growing conditions in West Texas remaining dry. In the May WASDE, U.S. cotton production is projected at 15.50 million bales, a 7% increase from 2022. On the demand side, exports are expected to increase by 0.9 million bales to 13.5 million bales. With higher exports, cotton ending stocks are projected to decrease by 0.20 million bales to 3.30 million bales. The average farm price is projected to weaken to 78 cents per pound. 

    Lastly, the carryover of long-grain rice from 2022 is low at 16.8 million hundredweight but is more than offset by higher production. Long-grain rice production is projected to increase by 11% to 142 million hundredweight. Exports are expected to increase by 4.0 million hundredweight to 52 million, but any further expansion is expected to be challenged by competition from South America. Ending stocks are projected to remain flat at 16.8 million hundredweight, the same as in 2022. Like other crops, the average farm price is projected lower to $15.00 hundredweight. Unlike other crops, though, the long-grain rice price is projected to remain above its 2021 price. 

    Overall, the USDA WASDE report projects a bearish supply and demand picture and lower prices compared to last year. There remains a large amount of uncertainty for the 2023 crop; however, USDA’s initial projections indicate lower prices for many southern row crops. Actual planted acreage, weather, and crop growth are some of the main factors that will determine if lower prices becomes a reality.


    Maples, William E. “Higher Supplies and Lower Prices Projected for U.S. Crops in 2023.Southern Ag Today 3(20.1). May 15, 2023. Permalink

  • Beef Custom Harvest Agreement Considerations  

    Beef Custom Harvest Agreement Considerations  

    Many cattle producers utilize a custom-exempt processing facility in their direct-to-consumer businesses. In this scenario, the producer sells a live calf (or fractional share thereof) to the consumer and then delivers the live animal to the custom-exempt facility, where it will be processed for the purchaser.  

    Anyone using this approach should have a custom harvest agreement to memorialize the contractual agreement between the producer and purchaser. 

    The following topics should be considered when drafting a custom harvest agreement:

    • Description of product being sold.  Be clear in the agreement that it is the live animal being sold to the consumer, not the processed beef.  Be clear on what percentage of the animal the customer is purchasing. If selling a specific animal, be sure to include the ear tag number or other description of the animal.
    • Educational information.  Include information a purchaser may not realize, such as the difference between the live animal weight and boxed beef weight, the amount of freezer space needed for a full, half, or quarter beef, and a sample cut sheet.
    • How will payment be calculated?  Describe how the price for the animal will be calculated, such as a flat fee or price per pound.  If per-pound, will it be calculated on the live weight or hanging weight of the animal? 
    • When and how will payment be due?  Detail any required deposit amount. Set payment deadlines. Identify allowable payment methods. 
    • Processing fees.  Typically, the purchaser pays the processor directly, and this should be spelled out in the agreement. 
    • Reselling/donating meat from the animal is prohibited.  Make clear in the custom harvest agreement that due to federal law, the beef from this animal may not be resold or donated.  
    • Point at which animal is property of the buyer.  Make clear at which point in time the animal officially becomes the property of the buyer.  Certainly, this has to be done at least by the point in time when it is delivered to the custom processing facility but could be as early as when the initial deposit is made.  This is important in the event of the death of an animal prior to delivery to a processing facility. 

    A custom harvest agreement provides important information to the purchaser and ensures both parties are on the same page about the sales transaction. For more information on direct-to-consumer beef sales, click here.


    Lashmet, Tiffany. “Beef Custom Harvest Agreement Considerations.Southern Ag Today 3(19.5). May 12, 2023. Permalink